



Google Drops 13% in Worst Post-Earnings Performance Ever, but History Shows 84.6% Win Rate Buying After 8% Drop
TradingKey - Shares of Google (GOOGL)(GOOG) tumbled more than 13% in early trading following its third-quarter earnings report, marking the company's worst post-earnings stock performance on record. Lower-than-expected Search revenue and a sharp increase in planned capital expenditures for next year led investors to reevaluate the balance between AI spending and earnings returns.
JPMorgan lowered its price target on Alphabet from $425 to $375, while Goldman Sachs cut its 12-month price target from $435 to $385, a reduction of about 11.5%, while maintaining a "Buy" rating. Based on the October 28 closing price of $324.89, Goldman Sachs' new price target implies an upside potential of approximately 18.5%.
Alphabet's third-quarter Search & other revenue came in at $63.35 billion, missing Goldman Sachs' forecast of $64.2 billion and falling about 2.4% short of the consensus estimate of $64.895 billion. With Search being a crucial revenue driver for the company, its weaker-than-expected performance has intensified market focus on whether core business growth can support expanding AI investments. Meanwhile, the company maintained its 2026 capital expenditure guidance of $195 billion to $205 billion and signaled a further substantial increase in spending for 2027.
As of press time, Google shares remained down 11.6% at $284.33.
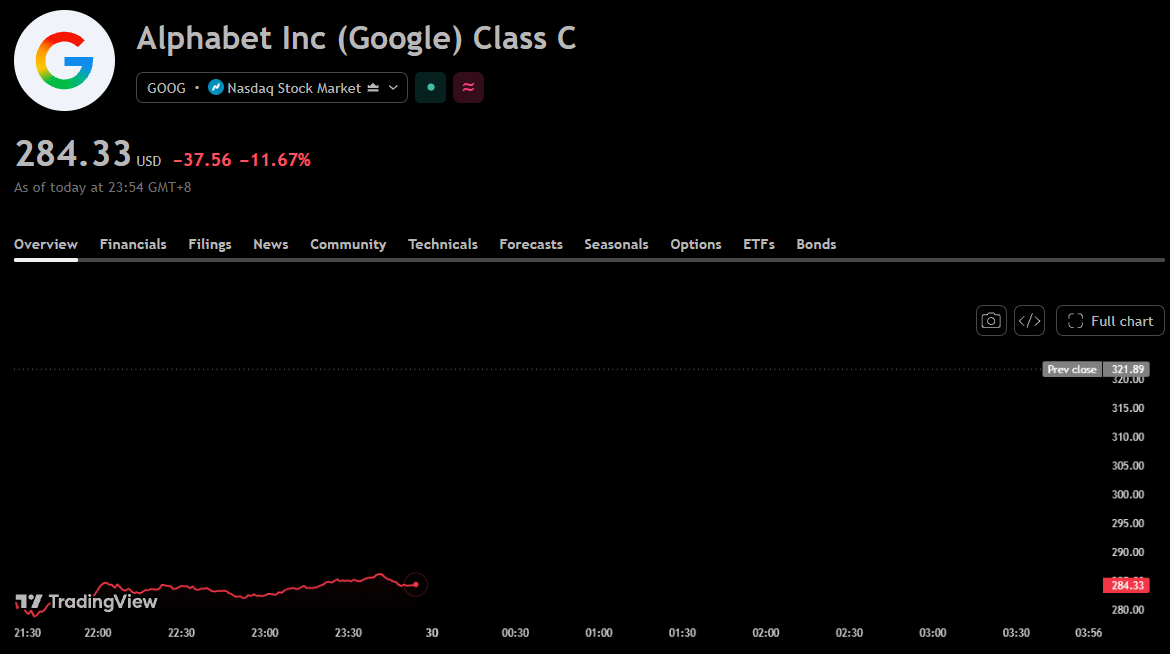
Google stock chart, Source: TradingView
However, Goldman Sachs analyst Eric Sheridan and his team remain bullish on Alphabet's long-term positioning in consumer and enterprise AI computing. Their rationale relies on an app ecosystem reaching over one billion users, alongside capabilities forged by large-scale computing investments: as AI commercialization moves from infrastructure to platforms and applications, Google has the opportunity to reach users and expand revenue through its existing products.
In addition, despite Google recording its worst post-earnings stock performance in history this time, post-plunge price trends offer another reference point. As of October 28, 2026, GOOGL has experienced 13 single-day closing drops of over 8% in its history. Buying at the closing price on those days and holding for 60 trading days yielded positive returns 11 times, translating to a historical win rate of 84.6%.
Historical Plunge Date | Daily Closing Change | 20-Trading-Day Return | 60-Trading-Day Return |
November 5, 2004 | -8.31% | 4.10% | 21.60% |
January 20, 2006 | -8.48% | -7.70% | 1.20% |
February 1, 2008 | -8.58% | -11.40% | 8.30% |
July 18, 2008 | -9.77% | 6.00% | -20.80% |
September 29, 2008 | -11.61% | -13.50% | -21.80% |
December 1, 2008 | -9.21% | 14.00% | 27.10% |
April 15, 2011 | -8.26% | -2.30% | 1.40% |
January 20, 2012 | -8.38% | 3.20% | 4.00% |
October 18, 2012 | -8.01% | -3.90% | 2.30% |
March 12, 2020 | -8.20% | 8.50% | 30.30% |
March 16, 2020 | -11.63% | 17.90% | 36.50% |
October 26, 2022 | -9.14% | 3.70% | 2.90% |
October 25, 2023 | -9.51% | 10.30% | 17.10% |
It should be noted that this sample includes sharp declines triggered by earnings as well as other factors, rather than focusing exclusively on post-earnings moves; furthermore, two losses exceeded 20%, indicating that a high win rate is still accompanied by significant risk.
Nothing in this material constitutes investment advice, personal recommendation, investment research, an offer, or a solicitation to buy or sell any financial instrument. The content has been prepared without consideration of your individual investment objectives, financial situation, or needs, and should not be treated as such.
Past performance is not a reliable indicator of future performance and/or results. Forward-looking scenarios or forecasts are not a guarantee of future performance. Actual results may differ materially from those anticipated.
Mitrade makes no representation or warranty as to the accuracy or completeness of the information provided and accepts no liability for any loss arising from reliance on such information.
Recommended Articles


