



British Pound defies strong US GDP as BoE rate hike bets support Cable
- GBP/USD gains 0.19% to 1.3340 despite stronger US economic data.
- US GDP expands 3.4%, while Core PCE inflation reaches 3.1%.
- Markets price November BoE hike as December Fed tightening odds reach 81%.
The Pound Sterling appreciates against the US Dollar on Thursday, even though US economic data was solid: GDP figures exceeded estimates, inflation rose, and the job market is robust. The GBP/USD trades at 1.3340, up 0.19%.
GBP/USD advances despite resilient US growth, high Core PCE reading as investors eye BoE next week rate hike
In the US, the Gross Domestic Product (GDP) in its preliminary read was 3.4% YoY, exceeding forecasts of 3.2% and Q2’s 2.2% print. Consumer spending, which was resilient, topped the previous print of 3.4% at 3.6% YoY, indicating that the economy is heating up.
With the economy pushing up, so does inflation. The Fed’s favourite inflation gauge, the Core Personal Consumption Expenditures (PCE) Price Index expanded by 3.1% YoY as expected, cementing the case for further tightening by the US central bank, which decided to hold rates on Wednesday.
Other data showed that jobless claims for the week ending October 24 dipped from 195K to 194K, below forecasts of a 199K jump.
The data release increased the chances of a Fed hike at the December 9 meeting, with traders pricing in an 81% chance of a 25-basis-point move.
In the UK, traders digested the budget presented by Finance Minister John Healey, who said he would raise rates on banks, gambling, savers, landlords, and online shopping. On the other hand, he is set to introduce measures against high energy prices.
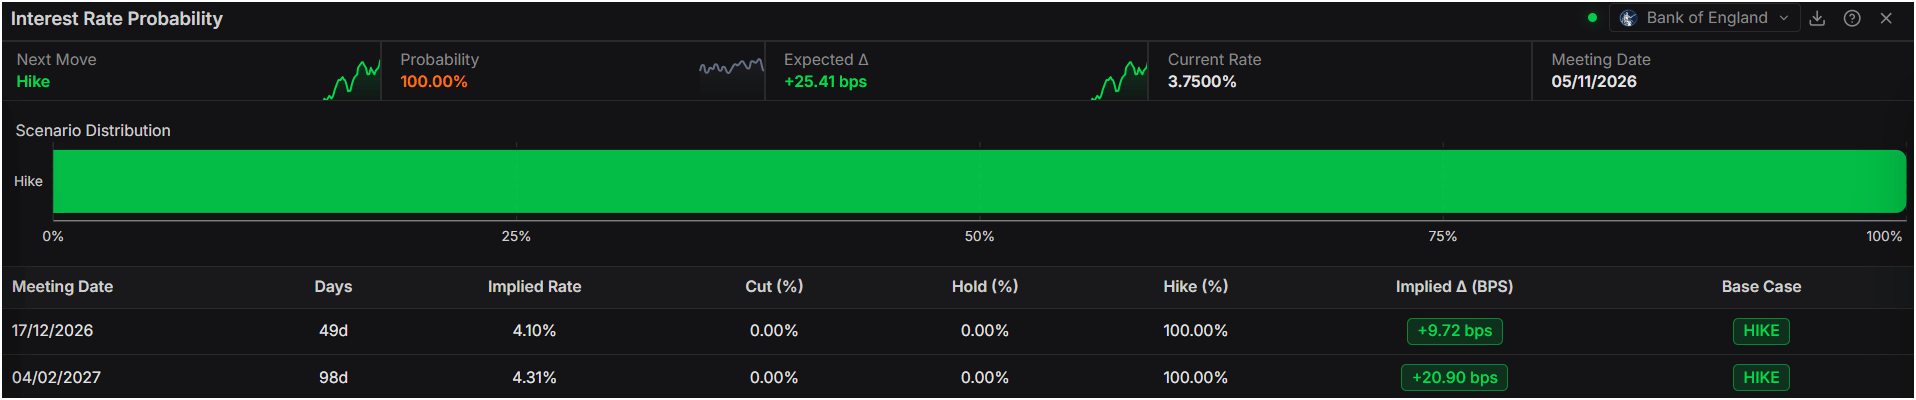
Beyond the budget, GBP/USD traders look ahead to the Bank of England (BoE) policy meeting next week. The markets priced in a 25-basis-point hike in November and another next February, revealed Prime Terminal.
GBP/USD Price Forecast: Technical outlook
In the daily chart, GBP/USD trades at 1.3368, holding a mildly bearish tone as spot remains capped beneath the simple moving average cluster around 1.3385 and a descending trend-line resistance at 1.3393. The pair has reclaimed some ground from recent lows, and the Relative Strength Index (14) at 54.4 hints at improving momentum, yet the broader structure still shows price trading below former rising support lines turned resistance near 1.3652 and 1.3830, reinforcing the idea of a capped recovery rather than a clear bullish trend.
On the topside, initial resistance is located at the simple moving average cluster around 1.3385, followed closely by the descending trend-line barrier at 1.3393; a sustained break above these levels would open the path toward the former upward-sloping supports now acting as resistance near 1.3652 and 1.3830. On the downside, the nearest notable underlying demand is seen at the prior downward resistance trend-line break around 1.3253, where buyers could attempt to slow any corrective pullback.
(The technical analysis of this story was written with the help of an AI tool. Know more.)
Pound Sterling Price Today
The table below shows the percentage change of British Pound (GBP) against listed major currencies today. British Pound was the strongest against the Australian Dollar.
| USD | EUR | GBP | JPY | CAD | AUD | NZD | CHF | |
|---|---|---|---|---|---|---|---|---|
| USD | -0.09% | -0.32% | 0.02% | -0.06% | 0.29% | -0.02% | -0.14% | |
| EUR | 0.09% | -0.23% | 0.11% | 0.00% | 0.38% | 0.06% | -0.05% | |
| GBP | 0.32% | 0.23% | 0.34% | 0.24% | 0.63% | 0.30% | 0.18% | |
| JPY | -0.02% | -0.11% | -0.34% | -0.11% | 0.26% | -0.08% | -0.18% | |
| CAD | 0.06% | -0.01% | -0.24% | 0.11% | 0.37% | 0.05% | -0.06% | |
| AUD | -0.29% | -0.38% | -0.63% | -0.26% | -0.37% | -0.31% | -0.44% | |
| NZD | 0.02% | -0.06% | -0.30% | 0.08% | -0.05% | 0.31% | -0.08% | |
| CHF | 0.14% | 0.05% | -0.18% | 0.18% | 0.06% | 0.44% | 0.08% |
The heat map shows percentage changes of major currencies against each other. The base currency is picked from the left column, while the quote currency is picked from the top row. For example, if you pick the British Pound from the left column and move along the horizontal line to the US Dollar, the percentage change displayed in the box will represent GBP (base)/USD (quote).
Nothing in this material constitutes investment advice, personal recommendation, investment research, an offer, or a solicitation to buy or sell any financial instrument. The content has been prepared without consideration of your individual investment objectives, financial situation, or needs, and should not be treated as such.
Past performance is not a reliable indicator of future performance and/or results. Forward-looking scenarios or forecasts are not a guarantee of future performance. Actual results may differ materially from those anticipated.
Mitrade makes no representation or warranty as to the accuracy or completeness of the information provided and accepts no liability for any loss arising from reliance on such information.
Recommended Articles


