



USD/CAD Price Forecast: 100-day EMA remains key hurdle
- USD/CAD consolidates around 1.3790 as the US NFP data takes centre stage.
- Fed’s Waller said that recent data shows some signs of disinflation.
- Traders have trimmed down Fed interest rate hike expectations to 50%.
The Canadian Dollar (CAD) trades broadly sideways against the US Dollar (USD) at around 1.3790 on Friday after a strong Thursday, with investors awaiting the United States (US) Nonfarm Payrolls (NFP) data for August, which will be published at 12:30 GMT.
The USD/CAD fell sharply on Thursday as the US Dollar faced sharp selling pressure after Federal Reserve (Fed) Governor Christopher Waller said recent data signals some cool-off in inflationary pressures. This led to a downward revision in the Fed’s interest rate expectations.
Waller flags data-dependent September Fed call, keeps Dollar bulls on alert
Fed’s Waller delivered a mildly less hawkish tone, with the FXS Speechtracker score at 6.1/10, slightly below the 6.3/10 established baseline, as the speech balanced recognition of “finally” emerging disinflation with a clear willingness to hike if August inflation runs hot. The key remark that Waller is inclined to hold rates steady at the September 15-16 meeting if data show continued progress, but would support a “small adjustment” higher if progress reverses, underscores a finely tuned reaction function that keeps a tightening bias alive while tempering immediate rate-hike expectations. Overall, the message is data-dependent and conditionally hawkish, supportive of the Dollar on upside inflation surprises but limiting aggressive repricing of near-term hikes.
The FXS Fed Sentiment Index fell by 2.06 points to 125.38, signaling a modest pullback in perceived hawkishness relative to recent communications captured by the FXS Speechtracker. However, with the index still well above the neutral 100 mark, the Fed remains firmly in hawkish territory, indicating that markets should continue to price a meaningful risk of further tightening even as the tone edges incrementally toward patience.
The CME FedWatch tool shows that the odds of the Fed hiking interest rates at the September meeting have diminished to 50% from 63.2% seen on Wednesday.
Looking ahead to the official labour market report, TD Securities says, "We expect August NFP to rebound to 95k after July posted a decline of 23k," and stresses that "risks to our payrolls forecasts appear hawkish, and we would not rule out an outsized positive surprise." On the jobless rate, the bank expects limited movement, noting that "the UE rate likely went sideways at 4.1% with balanced risks." TD Securities concludes that "a modestly hawkish employment report will reaffirm the Fed's attention on inflation, but it will be by itself unlikely to push the Committee towards hikes."
USD/CAD Technical Analysis
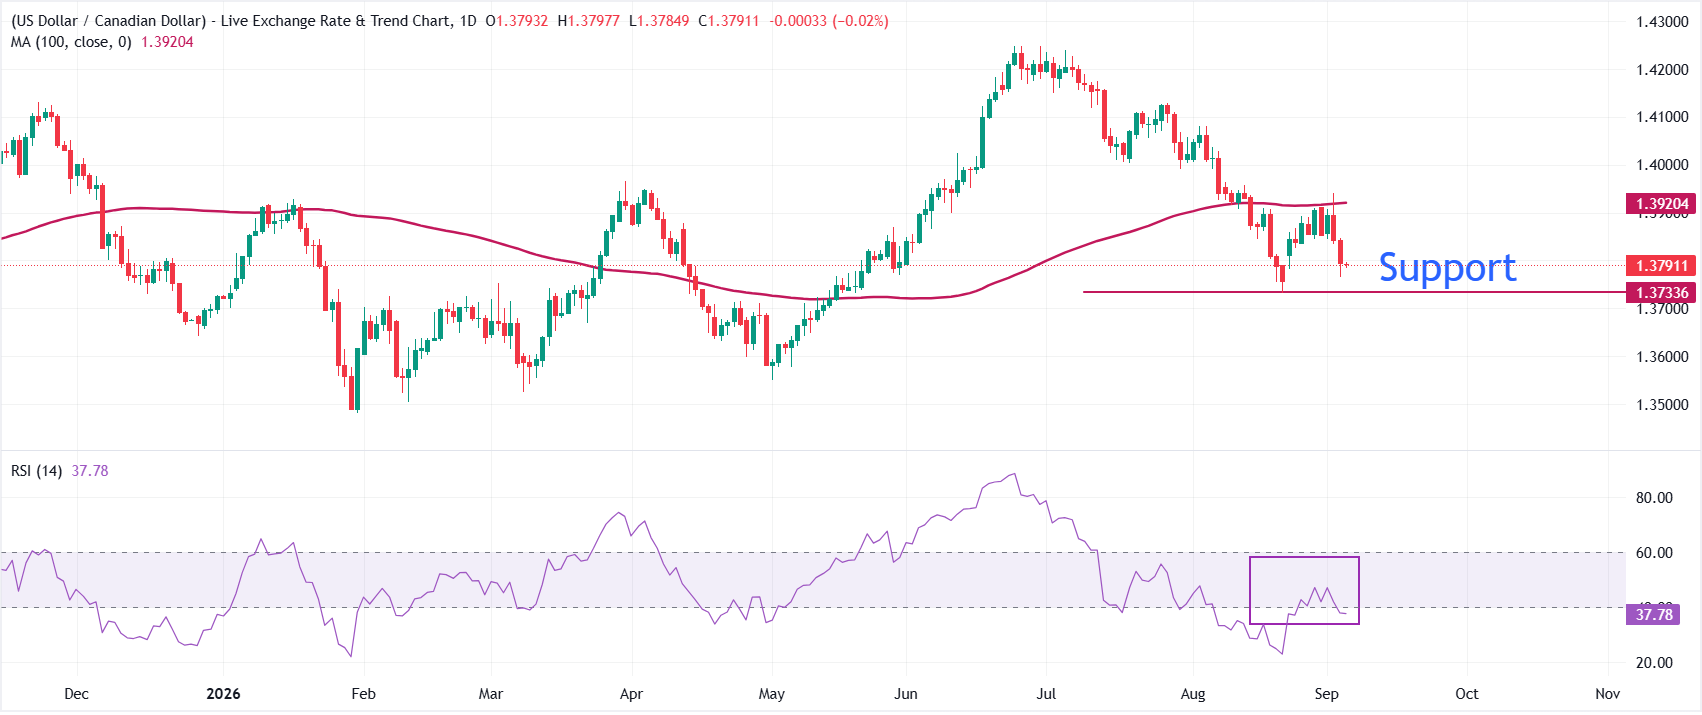
In the daily chart, USD/CAD trades at 1.3791, keeping a bearish near-term tone as spot holds beneath the 100-day Simple Moving Average (SMA) at 1.3920. The pair’s failure to reclaim this medium-term gauge suggests rallies remain capped for now, while the Relative Strength Index (RSI) at about 38 sits in bearish territory but shy of oversold, hinting at lingering downside pressure rather than exhaustion.
On the topside, the 100-day SMA at 1.3920 is the first meaningful resistance that bulls would need to clear to ease the current downside bias and open the way for a more sustained recovery. On the downside, the pair might enter a fresh downside leg if it fails to hold the August 21 low at 1.3732.
(The technical analysis of this story was written with the help of an AI tool. Know more.)
Nonfarm Payrolls FAQs
Nonfarm Payrolls (NFP) are part of the US Bureau of Labor Statistics monthly jobs report. The Nonfarm Payrolls component specifically measures the change in the number of people employed in the US during the previous month, excluding the farming industry.
The Nonfarm Payrolls figure can influence the decisions of the Federal Reserve by providing a measure of how successfully the Fed is meeting its mandate of fostering full employment and 2% inflation. A relatively high NFP figure means more people are in employment, earning more money and therefore probably spending more. A relatively low Nonfarm Payrolls’ result, on the either hand, could mean people are struggling to find work. The Fed will typically raise interest rates to combat high inflation triggered by low unemployment, and lower them to stimulate a stagnant labor market.
Nonfarm Payrolls generally have a positive correlation with the US Dollar. This means when payrolls’ figures come out higher-than-expected the USD tends to rally and vice versa when they are lower. NFPs influence the US Dollar by virtue of their impact on inflation, monetary policy expectations and interest rates. A higher NFP usually means the Federal Reserve will be more tight in its monetary policy, supporting the USD.
Nonfarm Payrolls are generally negatively-correlated with the price of Gold. This means a higher-than-expected payrolls’ figure will have a depressing effect on the Gold price and vice versa. Higher NFP generally has a positive effect on the value of the USD, and like most major commodities Gold is priced in US Dollars. If the USD gains in value, therefore, it requires less Dollars to buy an ounce of Gold. Also, higher interest rates (typically helped higher NFPs) also lessen the attractiveness of Gold as an investment compared to staying in cash, where the money will at least earn interest.
Nonfarm Payrolls is only one component within a bigger jobs report and it can be overshadowed by the other components. At times, when NFP come out higher-than-forecast, but the Average Weekly Earnings is lower than expected, the market has ignored the potentially inflationary effect of the headline result and interpreted the fall in earnings as deflationary. The Participation Rate and the Average Weekly Hours components can also influence the market reaction, but only in seldom events like the “Great Resignation” or the Global Financial Crisis.
Nothing in this material constitutes investment advice, personal recommendation, investment research, an offer, or a solicitation to buy or sell any financial instrument. The content has been prepared without consideration of your individual investment objectives, financial situation, or needs, and should not be treated as such.
Past performance is not a reliable indicator of future performance and/or results. Forward-looking scenarios or forecasts are not a guarantee of future performance. Actual results may differ materially from those anticipated.
Mitrade makes no representation or warranty as to the accuracy or completeness of the information provided and accepts no liability for any loss arising from reliance on such information.
Recommended Articles


