



Cardano Price Forecast: Extends gains as whale accumulation and derivatives positioning fuel bullish bias
- Cardano extends its gains on Friday after finding support around the key EMAs earlier this week.
- Improving derivatives metrics and accumulation by certain whale wallets support a bullish outlook for ADA.
- The technical outlook suggests further gains as momentum indicators show signs of strengthening.
Cardano (ADA) extends its gains, trading above $0.224 on Friday, after retesting and finding support around a key support zone earlier this week. Improving derivatives positioning and accumulation by certain whale wallets are adding to the bullish sentiment, while strengthening momentum indicators suggest ADA could see further gains if the recovery continues.
Derivatives metrics support a bullish bias
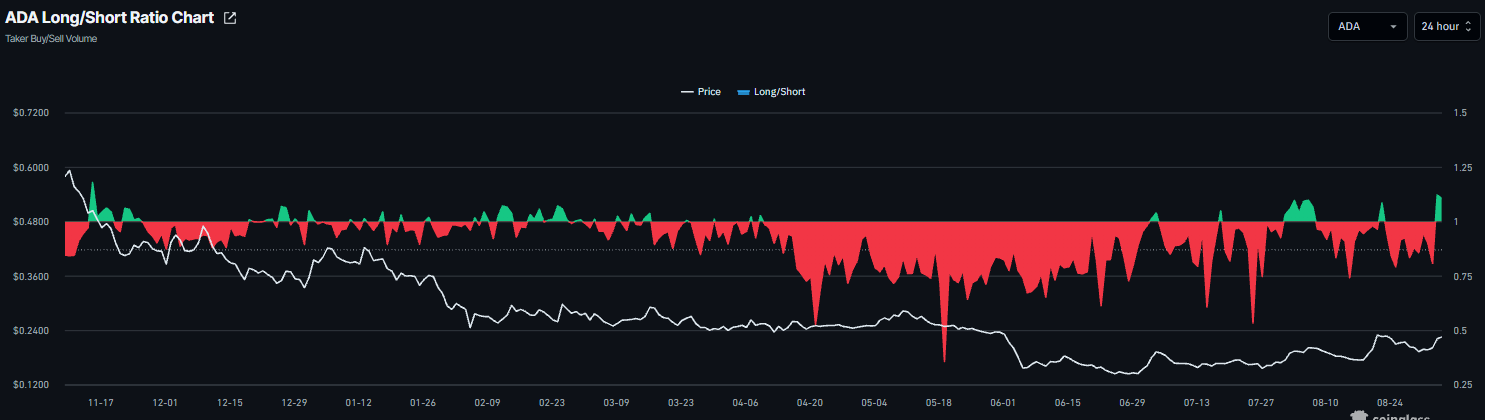
Cardano derivatives metrics show a bullish outlook. CoinGlass’ long-to-short ratio for ADA reads 1.10 on Friday, nearing the highest level over a month. This ratio above one reflects bullish sentiment, as more traders are betting on Cardano to rally.
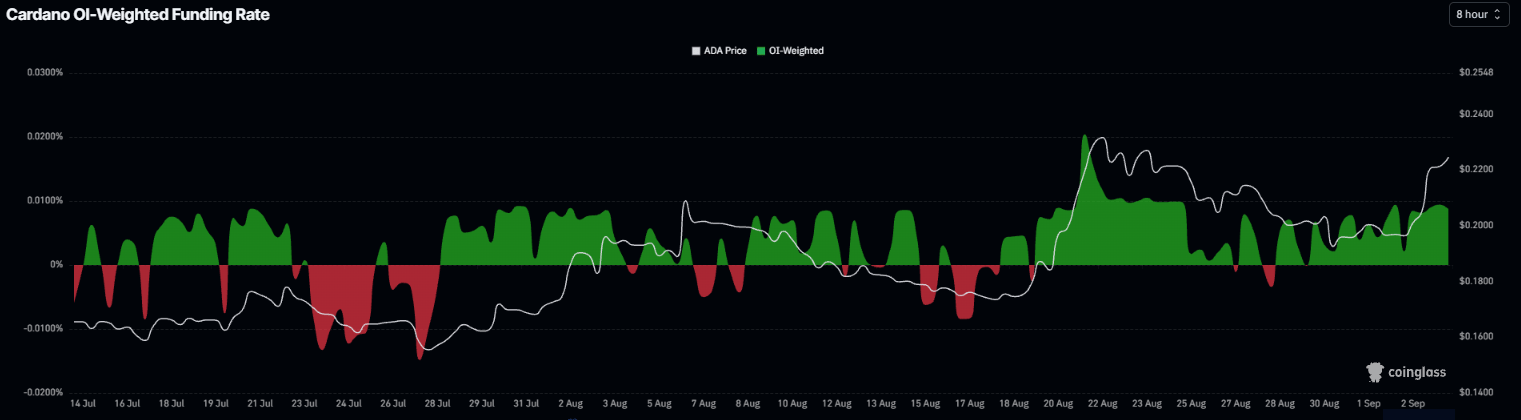
In addition, funding rates also point to a strengthening outlook. CoinGlass’ OI-weighted funding rate data for Cardano flipped positive on Sunday and read 0.0087% on Friday. This positive rate indicates longs are paying shorts and signals a bullish sentiment.
Whales accumulating recent dips
Santiment’s Supply Distribution data shows certain large-wallet holders (whales) buying ADA during recent price dips, supporting a positive outlook for the token.
The metric indicates that whales holding between 1 million and 10 million ADA tokens (yellow line) have accumulated 60 million ADA tokens since Sunday. During the same period, wallets holding between 10 million and 100 million (blue line) remained stable, while other holders with between 100,000 and 1 million offloaded 10 million ADA tokens.
This buy-the-dip scenario, signaled by the yellow-line wallet, suggests sustained long-term interest among large-wallet holders and has lifted Cardano’s price 17% so far this week.
 [09-1788498223270.00.11, 04 Sep, 2026].png)
Cardano technical outlook: Finds support around key zone
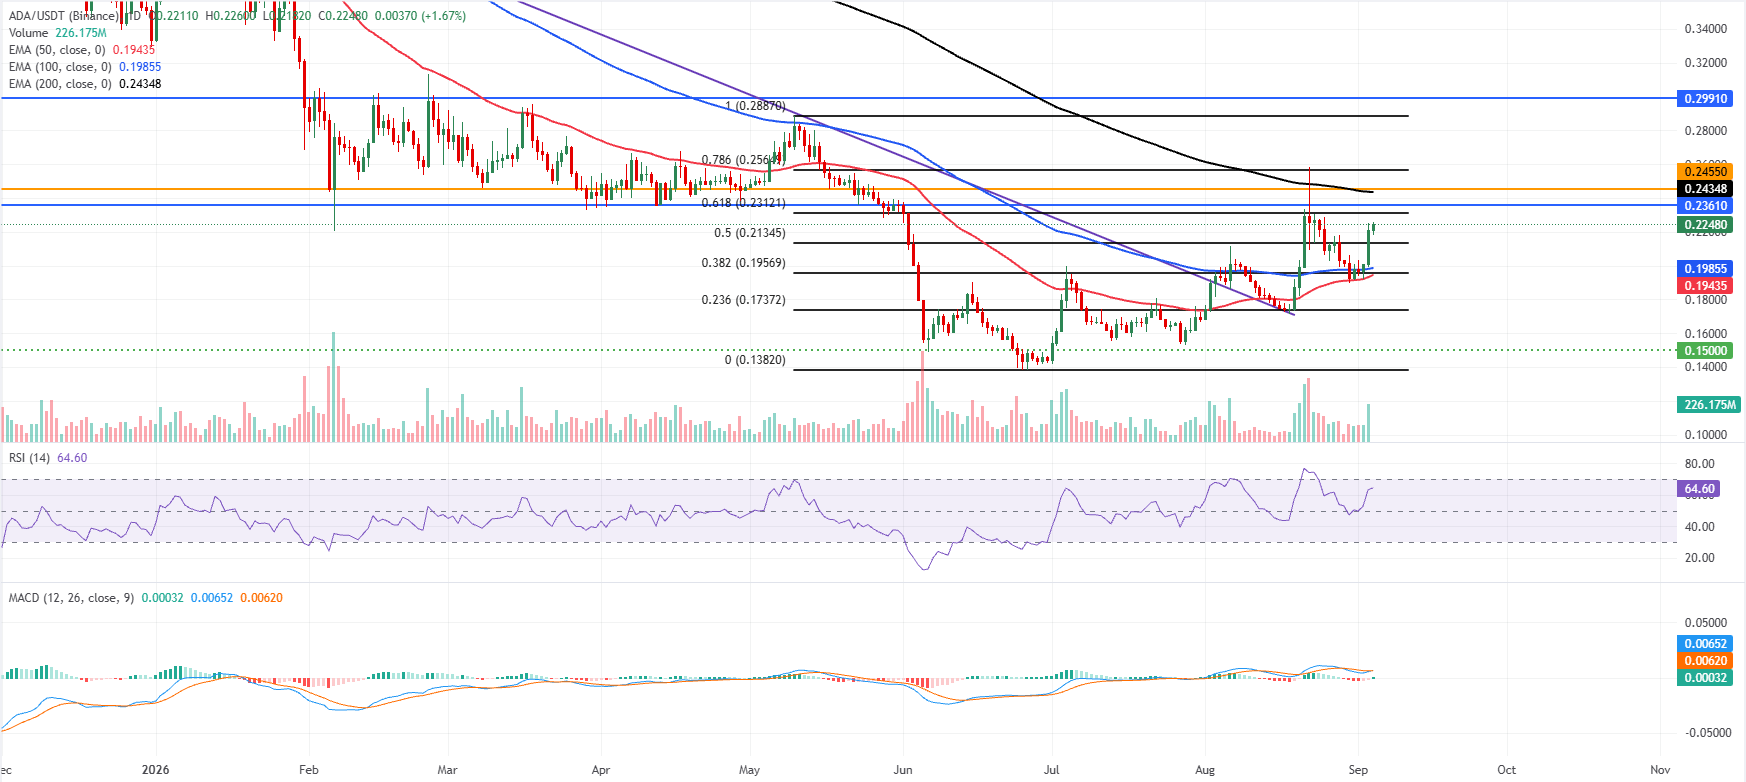
Cardano price trades at $0.224 on Friday, holding a constructive near-term tone as it sits above the 50-day and 100-day Exponential Moving Averages (EMAs) while still capped beneath the 200-day EMA. This positioning suggests a recovery phase within a broader downtrend, with buyers defending the recent breakout over the mid-$0.210 area.
The Relative Strength Index (RSI) at 64 hovers in bullish territory without yet reaching extreme overbought conditions, while the Moving Average Convergence Divergence (MACD) has turned marginally positive, hinting that upward momentum is building but remains fragile as price approaches overhead supply.
On the topside, initial resistance emerges at the 61.8% Fibonacci retracement near $0.231, followed by a tighter barrier at the horizontal level around $0.236. Above that, the 200-day EMA clustered with the $0.245 horizontal cap defines a tougher supply zone, ahead of a more distant resistance pivot near $0.299.
On the downside, immediate support is implied by the recent pivot zone just under the current price at the 50% retracement near $0.213, with the 100-day EMA at $0.198 and the 38.2% Fibonacci retracement near $0.195 reinforcing a broader demand band around the high-$0.190s. A deeper slide would expose the $0.173 Fibonacci level and, if that fails, the more strategic horizontal floor near $0.150.
(The technical analysis of this story was written with the help of an AI tool. Know more.)
Nothing in this material constitutes investment advice, personal recommendation, investment research, an offer, or a solicitation to buy or sell any financial instrument. The content has been prepared without consideration of your individual investment objectives, financial situation, or needs, and should not be treated as such.
Past performance is not a reliable indicator of future performance and/or results. Forward-looking scenarios or forecasts are not a guarantee of future performance. Actual results may differ materially from those anticipated.
Mitrade makes no representation or warranty as to the accuracy or completeness of the information provided and accepts no liability for any loss arising from reliance on such information.
Recommended Articles


