


CFDs are complex instruments and come with a high risk of losing money rapidly due to leverage. 80% of retail investor accounts lose money when trading CFDs with this provider. You should consider whether you understand how CFDs work and whether you can afford to take the high risk of losing your money.

Uniswap purchases rival PONS token for long-term alignment as both coins rally

Source Fxstreet
  • Uniswap has purchased the native token of a memecoin launchpad, citing long-term alignment. 
  • Details of the acquisition or allocation, such as size, price, or wallet address, remain undisclosed.
  • Uniswap Labs' pool.trade and Pons remain rivals on Robinhood Chain, while UNI hits an annual high and PONS hits a record high.

Uniswap (UNI) has purchased Pons (PONS) tokens in an undisclosed deal on Friday, citing long-term alignment with the memecoin launchpad token and its rival on the Robinhood chain. The nature of the deal, whether it's an acquisition or allocation, remains unknown, but Uniswap now holds a stake in Pons.

https://x.com/coinbureau/status/2095708176318607438

Pons has emerged as a leading memecoin launchpad on the Robinhood chain, routing tokens off its bonding curve to Uniswap V4 and rivaling Uniswap Labs’ pools.trade launchpad launched last month on the Robinhood chain.

PONS trades at its record high above $0.6800 at press time on Friday, advancing its price discovery mode. The price data shows parabolic growth in PONS, driven by its growing launchpad fees paid on Robinhood.
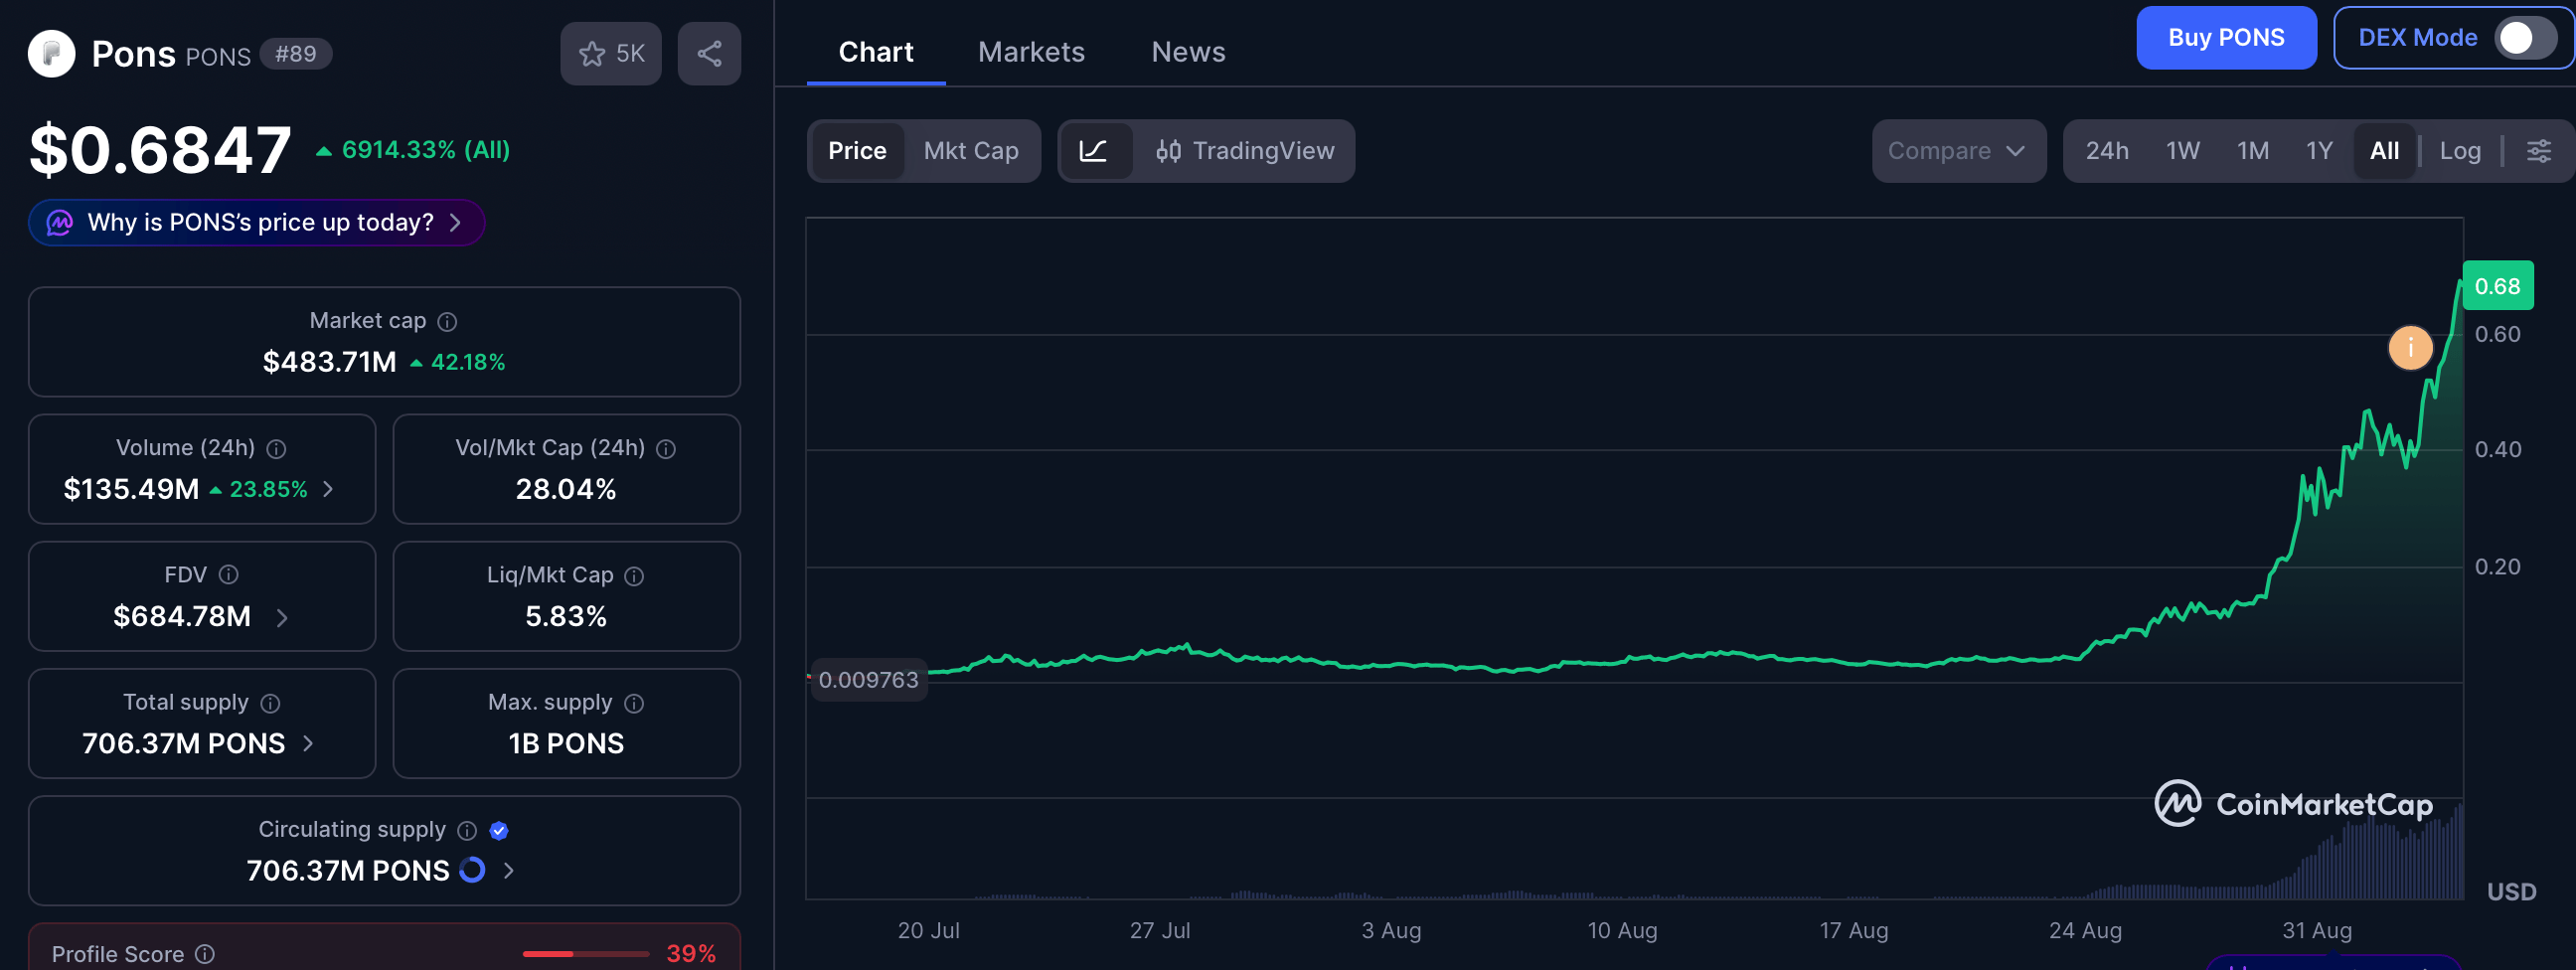
PONS market data. Source: CoinMarketCap

Uniswap rally gains traction

Uniswap hovers around $6.30 at press time on Friday, extending a strong bullish phase. The pair has pushed well beyond the 50-, 100-, and 200-day Exponential Moving Averages (EMAs) near $4.2640, $3.9145, and $4.0034, respectively, suggesting a broadly supportive trend backdrop.

Momentum remains overheated on the daily chart, with the Relative Strength Index (RSI) hovering in overbought territory near 81, while the Moving Average Convergence Divergence (MACD) rises steadily above zero, hinting that upside pressure persists even as the risk of a corrective pause grows.

A confirmed breakout above the December 28 swing high at $6.5690 could mark a fresh annual high and potentially target the 127.2% Fibonacci extension level at $8.7227, measured from $6.5690 to $2.3160.

Chart Analysis UNI/USDT (Binance)
UNI/USDT daily price chart.

On the downside, initial protection emerges around the 78.6% Fibonacci retracement at roughly $5.2554, ahead of the dynamic support reinforced by the 50-day EMA around $4.2640 and the 200-day EMA near $4.0034.

(The technical analysis of this story was written with the help of an AI tool. Know more.)

Disclaimer: The content available on Mitrade Insights is provided for informational and marketing purposes only. It has not been prepared in accordance with legal requirements designed to promote the independence of investment research and is not subject to any prohibition on dealing ahead of the dissemination of investment research
Nothing in this material constitutes investment advice, personal recommendation, investment research, an offer, or a solicitation to buy or sell any financial instrument. The content has been prepared without consideration of your individual investment objectives, financial situation, or needs, and should not be treated as such.
Past performance is not a reliable indicator of future performance and/or results. Forward-looking scenarios or forecasts are not a guarantee of future performance. Actual results may differ materially from those anticipated.
Mitrade makes no representation or warranty as to the accuracy or completeness of the information provided and accepts no liability for any loss arising from reliance on such information.
placeholder
Pi Network Price Forecast: Whale Accumulation and Technical Confluence Put PI on Breakout WatchPi Network trades higher near a key $0.247 resistance zone, with whale accumulation, a 50-day EMA/Fibonacci confluence and bullish RSI–MACD signals all putting PI on breakout watch as long as weekly support at $0.221 holds.
Author  Mitrade
Nov 24, 2025
Pi Network trades higher near a key $0.247 resistance zone, with whale accumulation, a 50-day EMA/Fibonacci confluence and bullish RSI–MACD signals all putting PI on breakout watch as long as weekly support at $0.221 holds.
placeholder
Aave Price Forecast: AAVE eyes bullish breakout as on-chain and derivatives data turns supportiveAave (AAVE) price hovers around $172 on Wednesday, nearing the upper trendline of the falling parallel channel pattern. A break above this technical pattern favors the bulls.
Author  FXStreet
Jan 07, Wed
Aave (AAVE) price hovers around $172 on Wednesday, nearing the upper trendline of the falling parallel channel pattern. A break above this technical pattern favors the bulls.
placeholder
BTC holds recent gains above 50-day EMA amid improving momentumBitcoin (BTC) slides slightly but holds most of the recent gains, reclaiming the 50-day Exponential Moving Average (EMA) at $64,300 at the time of writing on Tuesday after rising 2.5% the previous day.
Author  FXStreet
Aug 18, Tue
Bitcoin (BTC) slides slightly but holds most of the recent gains, reclaiming the 50-day Exponential Moving Average (EMA) at $64,300 at the time of writing on Tuesday after rising 2.5% the previous day.
placeholder
WTI Price Forecast: Climbs above $86.00 as 100-day SMA breakout comes into playWest Texas Intermediate (WTI) – the benchmark US Crude Oil price – attracts buyers for the second straight day on Tuesday as escalating US-Iran tensions and the standoff over the Strait of Hormuz continue to fuel supply concerns.
Author  FXStreet
Sep 01, Tue
West Texas Intermediate (WTI) – the benchmark US Crude Oil price – attracts buyers for the second straight day on Tuesday as escalating US-Iran tensions and the standoff over the Strait of Hormuz continue to fuel supply concerns.
placeholder
Ripple and Stellar outlook: XRP ETF demand strengthens, XLM RWA market hits $4 billion milestoneRipple (XRP) and Stellar (XLM) are showing signs of recovery on Tuesday after rebounding slightly the previous day, following double-digit corrections last week.
Author  FXStreet
Sep 01, Tue
Ripple (XRP) and Stellar (XLM) are showing signs of recovery on Tuesday after rebounding slightly the previous day, following double-digit corrections last week.
Related Instrument
goTop
quote