



Silver Price Forecast: XAG/USD falls like house of cards on Fed’s hawkish narrative
- Silver price dives over 4% to near $61 due to elevated US Treasury Yields.
- The Fed is highly anticipated to hike interest rates again this year.
- This week, the US NFP data will be the key trigger for global markets.
Silver price (XAG/USD) is down 4.3% to near $61.50 during the European trading session on Monday. The white metal nosedives as elevated United States (US) Treasury Yields have diminished its appeal.
At press time, 10-year US Treasury Yields are close to its 19-year high of 5.23% posted on Friday.
Higher oil prices due to persistent disruption in the global energy supply amid Middle East conflicts and the increased possibility of more interest rate hikes by the Federal Reserve (Fed) in the near term have prompted US Treasury Yields.
US data resilience lifts Yields as Fed tightening narrative builds
Analysts at Deutsche Bank highlight that, alongside recent energy moves, “another factor lifting bond yields yesterday was the ongoing resilience in the economic data.” They point to US weekly initial jobless claims, which came in at “just 197k in the week ending September 19 (vs. 200k expected),” underscoring the strength of the labour market. Deutsche Bank notes that this release is “one of the timeliest indicators we get on the state of the labour market,” and that it has pushed “the 4-week moving average (which Fed Chair Warsh has previously cited) down to 202.25k.” In their view, these developments “played into the current narrative that the US economy is growing strongly, which in turn would give the Fed the space to keep hiking rates.”
Currently, the CME FedWatch tool shows an almost 68% chance that the Fed will hike interest rates again in the October policy meeting.
Next trigger is US NFP
This week, the strength of hawkish Fed expectations will be tested by the US Nonfarm Payrolls (NFP) data for September, which will be released on Friday. The US NFP report will likely show that the economy created 100K fresh jobs, lower than 162K in August.
Silver Technical Analysis
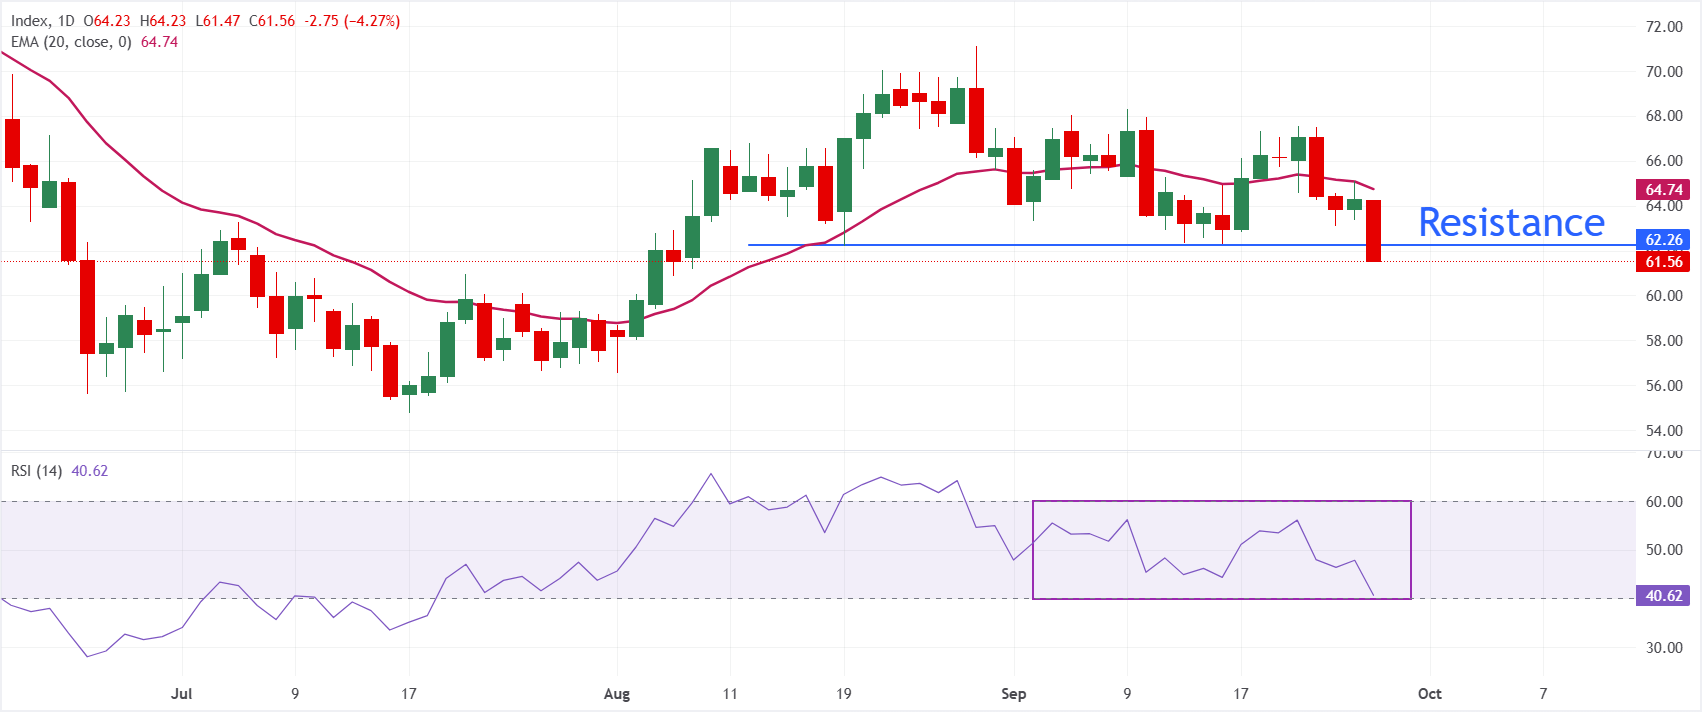
In the daily chart, XAG/USD trades at $61.50, keeping a bearish near-term bias as it holds below the 20-day exponential moving average (EMA) at $64.74. The pair has retreated from recent highs and remains capped by this short-term trend indicator, while the Relative Strength Index (RSI) at 40.61 stays below the neutral 50 line, hinting at lingering downside pressure rather than an oversold extreme.
On the topside, immediate resistance is located at $62.26, followed by the 20-day EMA at $64.74, and a daily close above this barrier would be needed to ease the current bearish tone. On the downside, the white metal could extend its decline towards $60.00
(The technical analysis of this story was written with the help of an AI tool. Know more.)
Silver FAQs
Silver is a precious metal highly traded among investors. It has been historically used as a store of value and a medium of exchange. Although less popular than Gold, traders may turn to Silver to diversify their investment portfolio, for its intrinsic value or as a potential hedge during high-inflation periods. Investors can buy physical Silver, in coins or in bars, or trade it through vehicles such as Exchange Traded Funds, which track its price on international markets.
Silver prices can move due to a wide range of factors. Geopolitical instability or fears of a deep recession can make Silver price escalate due to its safe-haven status, although to a lesser extent than Gold's. As a yieldless asset, Silver tends to rise with lower interest rates. Its moves also depend on how the US Dollar (USD) behaves as the asset is priced in dollars (XAG/USD). A strong Dollar tends to keep the price of Silver at bay, whereas a weaker Dollar is likely to propel prices up. Other factors such as investment demand, mining supply – Silver is much more abundant than Gold – and recycling rates can also affect prices.
Silver is widely used in industry, particularly in sectors such as electronics or solar energy, as it has one of the highest electric conductivity of all metals – more than Copper and Gold. A surge in demand can increase prices, while a decline tends to lower them. Dynamics in the US, Chinese and Indian economies can also contribute to price swings: for the US and particularly China, their big industrial sectors use Silver in various processes; in India, consumers’ demand for the precious metal for jewellery also plays a key role in setting prices.
Silver prices tend to follow Gold's moves. When Gold prices rise, Silver typically follows suit, as their status as safe-haven assets is similar. The Gold/Silver ratio, which shows the number of ounces of Silver needed to equal the value of one ounce of Gold, may help to determine the relative valuation between both metals. Some investors may consider a high ratio as an indicator that Silver is undervalued, or Gold is overvalued. On the contrary, a low ratio might suggest that Gold is undervalued relative to Silver.
Nothing in this material constitutes investment advice, personal recommendation, investment research, an offer, or a solicitation to buy or sell any financial instrument. The content has been prepared without consideration of your individual investment objectives, financial situation, or needs, and should not be treated as such.
Past performance is not a reliable indicator of future performance and/or results. Forward-looking scenarios or forecasts are not a guarantee of future performance. Actual results may differ materially from those anticipated.
Mitrade makes no representation or warranty as to the accuracy or completeness of the information provided and accepts no liability for any loss arising from reliance on such information.
Recommended Articles


