



Dow Jones Industrial Average bounces on Iran's latest Hormuz offer
- DJIA bounces toward 51,800 on Iran's offer to reopen Hormuz.
- Iran's terms start with the June deal that collapsed into fighting.
- 10-year Treasury yield at its highest since June 2007, above 5.2%.
Iran has offered to reopen the Strait of Hormuz within seven days of Washington accepting its terms, and buyers have taken the Dow Jones Industrial Average higher before Washington has replied. The index trades near 51,800 on Friday and is on track to end a three-session losing run.
West Texas Intermediate (WTI) Crude Oil fell toward $92.00 on the offer. Cheaper fuel helps 29 of the Dow's 30 members, since Chevron (CVX) is its only oil producer, and it takes some pressure off the inflation the Fed is raising rates to fight. Japan's Kyodo News reported the same seven-day offer on Tuesday, and the index fell that day and the two after it.
Iran's seven-day plan starts by going back to June
Iran's Foreign Minister Abbas Araghchi is staying in New York over the weekend to wait for an answer. The terms ask Washington to return to the memorandum of understanding (MoU) agreed in June, lift its naval blockade, unfreeze some Iranian assets, restore an oil sanctions waiver and end Israel's war in southern Lebanon, most of it within four to five days. The June MoU swapped passage through Hormuz for an end to the blockade, and it fell apart into renewed fighting.
The fighting hasn't paused for the talks. Houthi missiles fired at Saudi Arabia on Thursday sent Brent Crude Oil to a session high near $108.00 before it fell back on the phased-deal report, and Brent had gained more than 17% in September by then. That bill lands on every Dow member that ships goods or sells to drivers until tankers move through the strait freely, whatever is agreed in New York.
Reuters reported on Thursday that negotiators in New York are weighing a phased agreement, and that report is what buyers are paying for. President Trump has called a deal close dozens of times since the war began on February 28, and on Tuesday he said he expects one right after the US election. Iranian President Masoud Pezeshkian wants one before it, so the two sides agree there should be a deal and disagree on which side of November 3 it lands.
Consumers expect 4.6% inflation, and the Fed's rate tops out at 4%
The 10-year Treasury yield touched 5.23% on Friday, its highest since June 2007, and it was below 4.8% two weeks ago. The 30-year yield reached its highest since 2004 on Thursday. Mortgages and company debt are priced off those yields, and the average 30-year mortgage rate is above 7%, which is the housing market Home Depot (HD) and Sherwin-Williams (SHW) sell into.
Friday's data kept another hike on the table. Durable goods orders were flat in August against a forecast 0.4% drop, and orders for business equipment outside aircraft rose 1.6% against 0.5% expected. The final University of Michigan (UoM) survey showed consumers expecting 4.6% inflation over the next year, above the Fed's 3.75-4.00% rate.
Traders cut the odds of an October hike to about 66% from 77.5% on Thursday as Crude Oil fell, and the rally leans on that change rather than on the 10-year yield, which hasn't come off its high. Fed Governor Barr said on Wednesday that further increases are likely to be needed, and New York Fed President Williams called another hike this year reasonable on Thursday.
Fed Chair Warsh no longer signals moves in advance, so those odds carry no steer from the Federal Open Market Committee (FOMC) before it decides on October 28, six days before the midterms. The Dow is about where it began the week, and in that week the 10-year yield rose to a 19-year high.
Technical levels
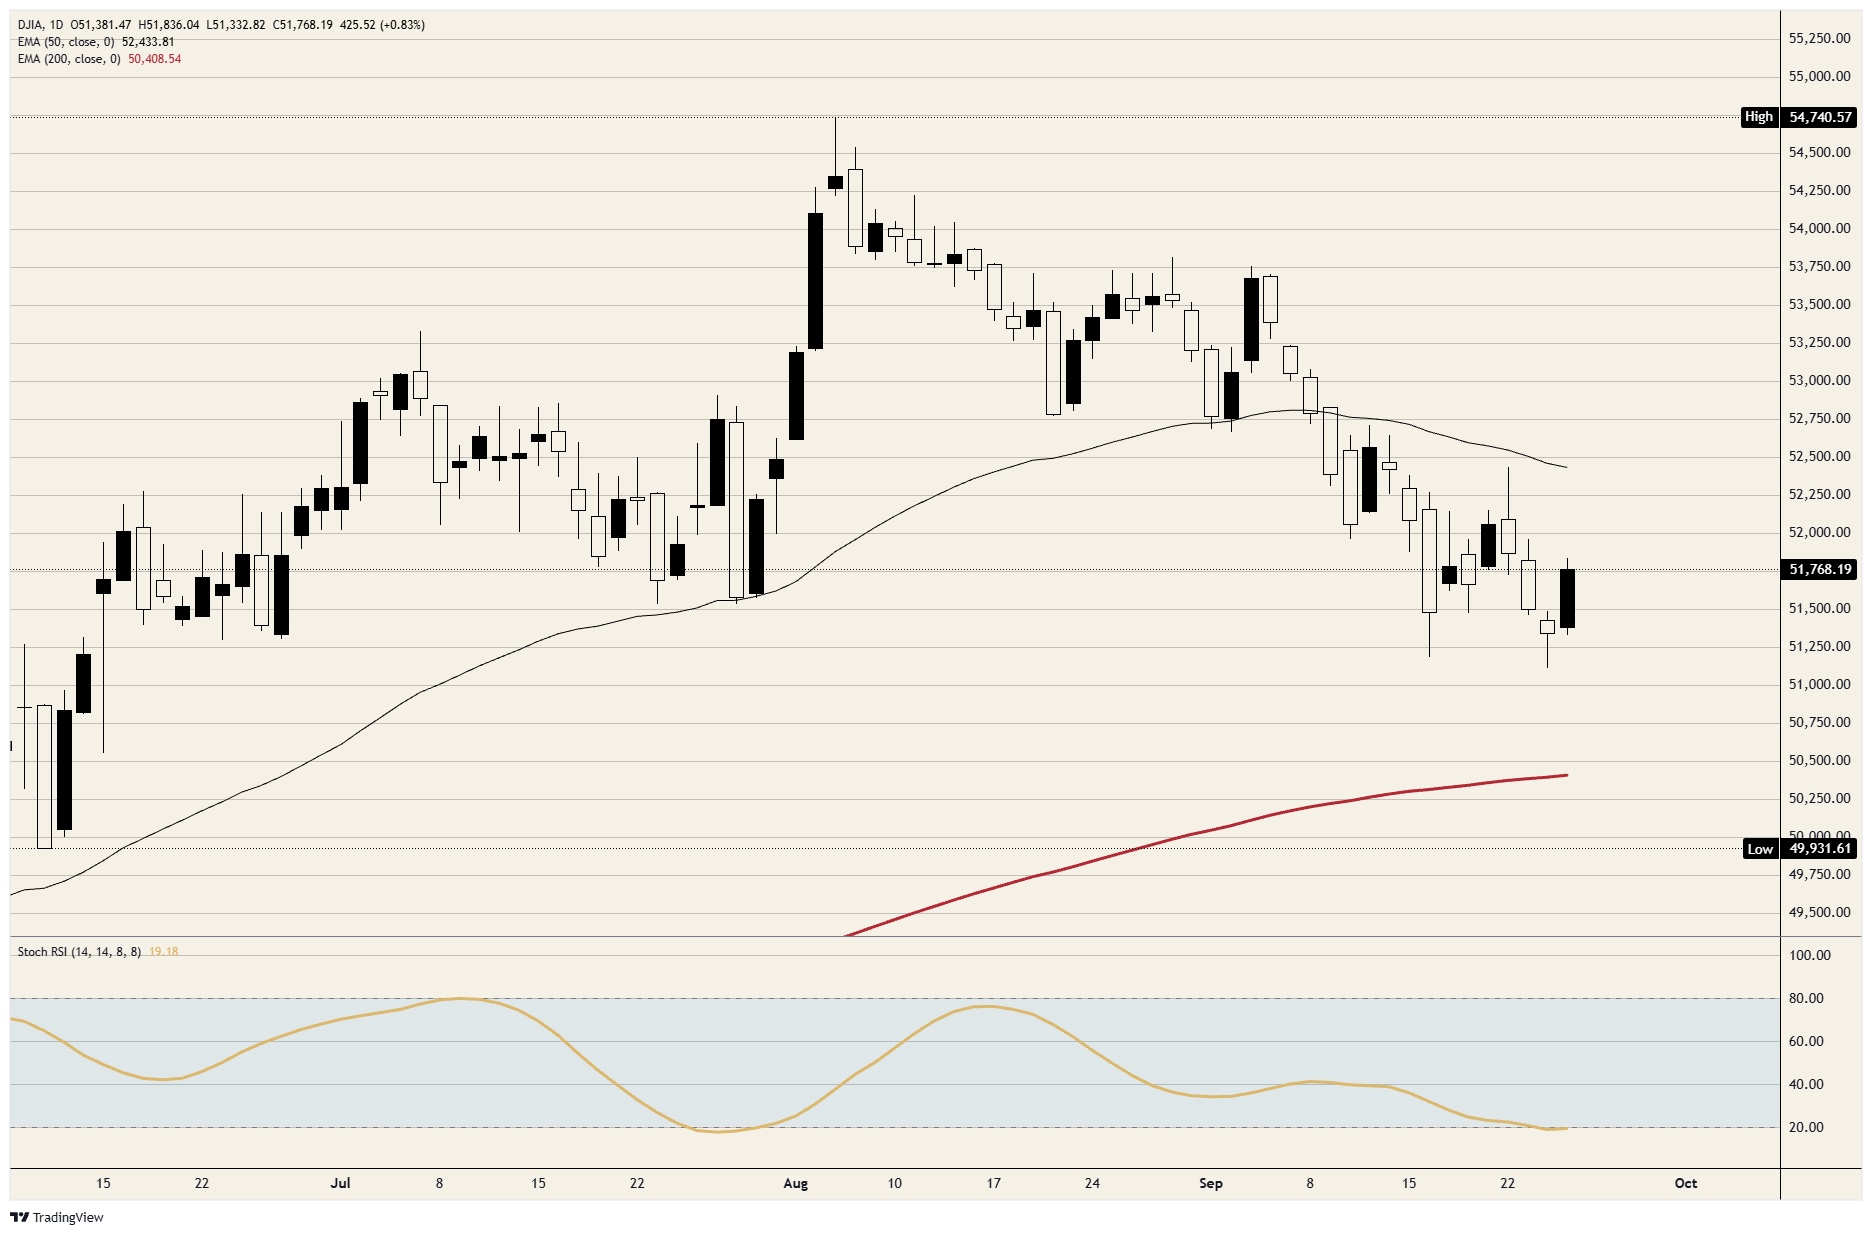
Resistance: The session high just above 51,800 is where the rally stalled. Above it, 52,000 is the level the index gave up on Tuesday and hasn't regained on a closing basis, and Tuesday's high near 52,400 capped the last push higher.
Support: The session low in the 51,300 area came on the Michigan release and held. Below it, Thursday's low near 51,100 is the lowest since June.
Bias: The lean is short below 52,000, with Thursday's low near 51,100 as the first objective and the 200-day Exponential Moving Average (EMA) near 50,400 as the second. The daily Stochastic Relative Strength Index (Stoch RSI) is near 19, at the bottom of its range, so the bounce could stretch toward 52,000 without changing the call. A daily close above 52,000 ends the short case.
Dow Jones daily chart
Dow Jones FAQs
The Dow Jones Industrial Average, one of the oldest stock market indices in the world, is compiled of the 30 most traded stocks in the US. The index is price-weighted rather than weighted by capitalization. It is calculated by summing the prices of the constituent stocks and dividing them by a factor, currently 0.152. The index was founded by Charles Dow, who also founded the Wall Street Journal. In later years it has been criticized for not being broadly representative enough because it only tracks 30 conglomerates, unlike broader indices such as the S&P 500.
Many different factors drive the Dow Jones Industrial Average (DJIA). The aggregate performance of the component companies revealed in quarterly company earnings reports is the main one. US and global macroeconomic data also contributes as it impacts on investor sentiment. The level of interest rates, set by the Federal Reserve (Fed), also influences the DJIA as it affects the cost of credit, on which many corporations are heavily reliant. Therefore, inflation can be a major driver as well as other metrics which impact the Fed decisions.
Dow Theory is a method for identifying the primary trend of the stock market developed by Charles Dow. A key step is to compare the direction of the Dow Jones Industrial Average (DJIA) and the Dow Jones Transportation Average (DJTA) and only follow trends where both are moving in the same direction. Volume is a confirmatory criteria. The theory uses elements of peak and trough analysis. Dow’s theory posits three trend phases: accumulation, when smart money starts buying or selling; public participation, when the wider public joins in; and distribution, when the smart money exits.
There are a number of ways to trade the DJIA. One is to use ETFs which allow investors to trade the DJIA as a single security, rather than having to buy shares in all 30 constituent companies. A leading example is the SPDR Dow Jones Industrial Average ETF (DIA). DJIA futures contracts enable traders to speculate on the future value of the index and Options provide the right, but not the obligation, to buy or sell the index at a predetermined price in the future. Mutual funds enable investors to buy a share of a diversified portfolio of DJIA stocks thus providing exposure to the overall index.
Nothing in this material constitutes investment advice, personal recommendation, investment research, an offer, or a solicitation to buy or sell any financial instrument. The content has been prepared without consideration of your individual investment objectives, financial situation, or needs, and should not be treated as such.
Past performance is not a reliable indicator of future performance and/or results. Forward-looking scenarios or forecasts are not a guarantee of future performance. Actual results may differ materially from those anticipated.
Mitrade makes no representation or warranty as to the accuracy or completeness of the information provided and accepts no liability for any loss arising from reliance on such information.
Recommended Articles


