



Quant Price Forecast: QNT rallies 350% in a week on major tokenization deal
- Quant is down nearly 10% on Monday, showing signs of mild easing after rallying nearly 350% last week.
- Quant partnered with The Clearing House on Thursday, emerging as a settlement layer for tokenized deposits across 25 major US banks.
- The technical outlook for QNT is bullish, with the price trading around a 4-year high amid strong bullish momentum.
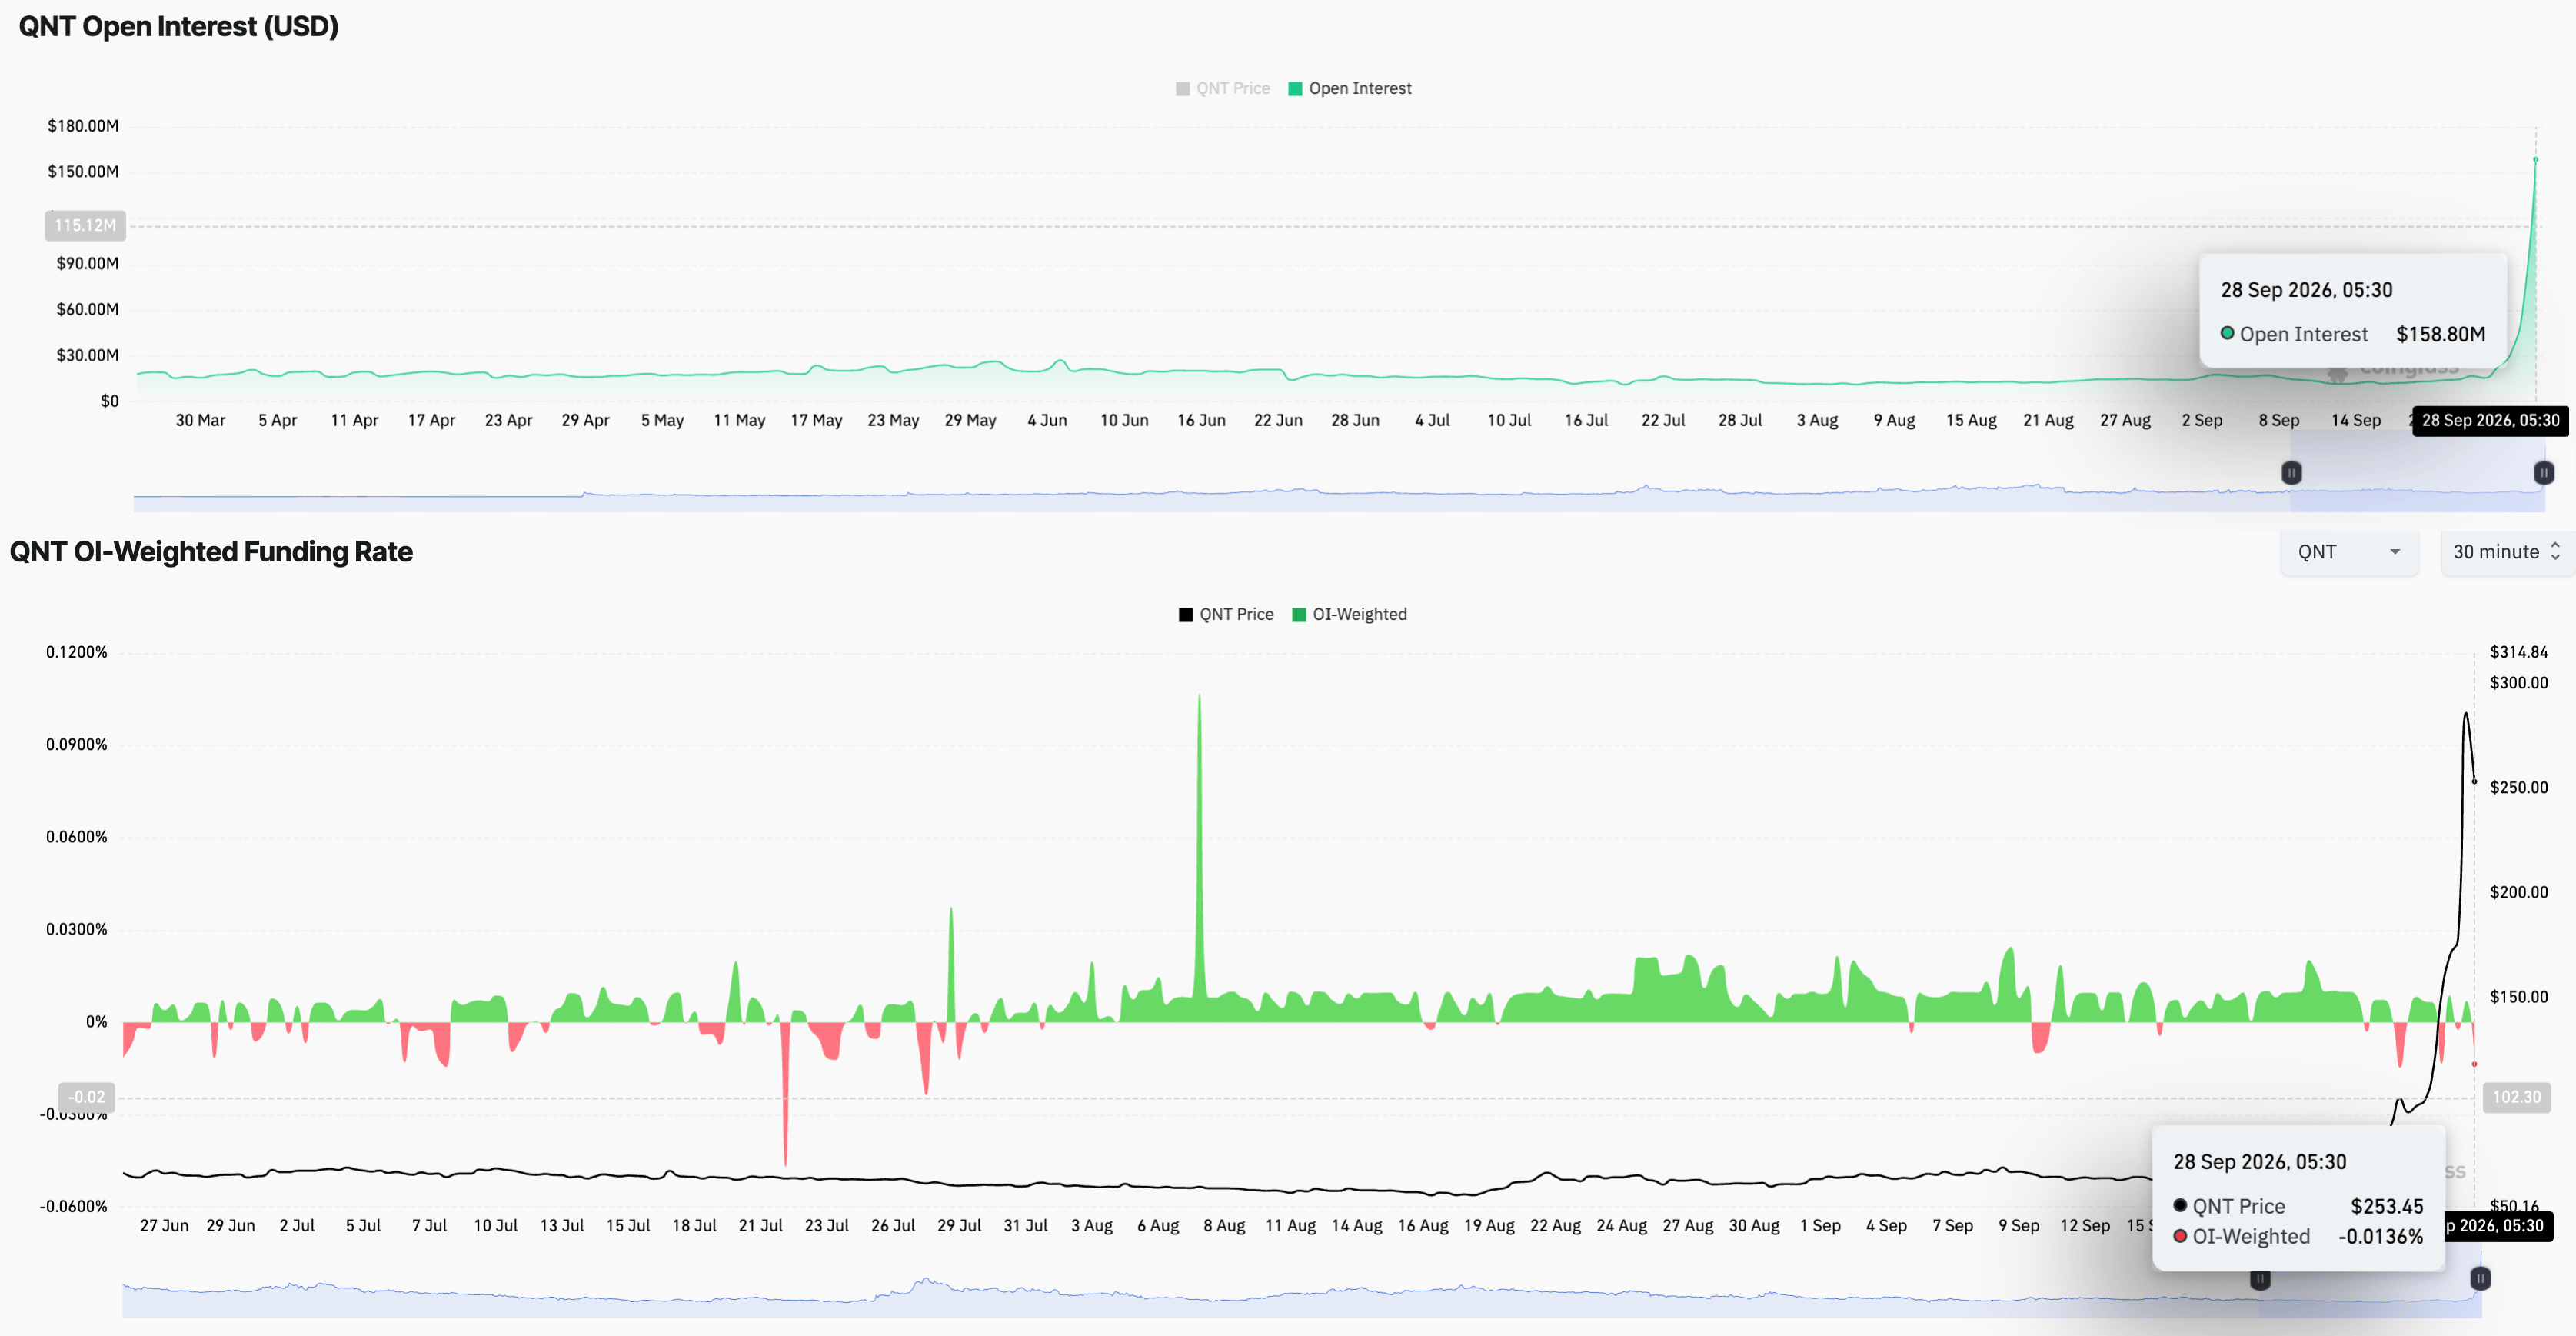
Quant (QNT) price hovers above $250 on Monday following a parabolic rise of nearly 350% last week. The Clearing House deal positions Quant as a settlement layer across 25 major banks for tokenized deposits amid the US government's strong push for tokenized stocks and other Real-World Assets (RWAs). Retail speculation builds toward QNT, with its futures Open Interest rising to a record high of $158.80 million, indicating firm leverage-exposed participation.
Bullish speculation grows firm on tokenized deposits deal
Quant rallied nearly 350% last week, gaining strong retail demand on the announcement of a partnership with The Clearing House. The deal enables Quant to serve as the transaction layer for clearing and settling tokenized deposits across 25 major US banks, as previously reported by FXStreet.
On the retail side, the QNT futures Open Interest (OI) surged to $158.80 million, suggesting a sharp increase in leverage-driven positional buildup. At the same time, the funding rate fluctuates, flipping to -0.0136%, suggesting a mild bearish incline among traders as the rally stretches thin.
Technical outlook: QNT rally steadies above $250 as bulls eye a fresh record high
Quant trades around $254 at press time on Monday, holding steady after a parabolic rise last week. QNT sits well above the major 50-, 100-, and 200-week Exponential Moving Averages (EMAs) at $87.78, $88.89 and $102.44, respectively, providing a broad underlying support zone.
The 50-week EMA crosses above the 200-week EMA, which is commonly referred to as a Golden Cross pattern, suggesting a long-term bullish trend reversal. Momentum on the week chart hits record high levels, with the Relative Strength Index (RSI) at 80, deep into the overbought territory. At the same time, the Moving Average Convergence Divergence (MACD) and signal line extend an uptrend to 26.22 and 20.85, with expanding bullish histograms, suggesting a firm control of buyers on the trend.
The Fibonacci retracement over last week's price range from $64.16 to $373.00 highlights the immediate support level at the 78.6% Fibonacci retracement level at $255, followed by the October 17, 2022 and December 2, 2024 highs around $228 and $171.70, respectively.
Looking up, QNT must surpass last week's high at $373 to test its record high of $430 set by the September 6, 2021 high. A confirmed breakout above this level could target the 127.2% Fibonacci extension level at $602.05.
(The technical analysis of this story was written with the help of an AI tool. Know more.)
Nothing in this material constitutes investment advice, personal recommendation, investment research, an offer, or a solicitation to buy or sell any financial instrument. The content has been prepared without consideration of your individual investment objectives, financial situation, or needs, and should not be treated as such.
Past performance is not a reliable indicator of future performance and/or results. Forward-looking scenarios or forecasts are not a guarantee of future performance. Actual results may differ materially from those anticipated.
Mitrade makes no representation or warranty as to the accuracy or completeness of the information provided and accepts no liability for any loss arising from reliance on such information.
Recommended Articles


