



Bitcoin and Gold Outlook: BTC reclaims $82K, XAU approaches $4,200 as October rate hike bets dim
- Bitcoin ticks up and trades above $82,000 as bulls push to regain control after a sharp correction.
- Gold rises for two straight days, trading near $4,200 on Friday, backed by a gradual upward shift in momentum indicators.
- Traders are increasingly pricing in a lower probability of an October rate hike even as most Fed officials signal expectations for an additional raise before year-end.
Bitcoin (BTC) continues to regain momentum on Friday, trading above $82,000. Buyers are increasingly taking on more risk after a sharp week-long correction to lows near $80,000. Stability followed by a steady uptrend could restore conviction in Bitcoin’s ability to sustain a breakout toward $90,000 in the short to medium term.
Gold (XAU/USD) continues its uptick, trading close to $4,200 at the time of writing. This marks the metal’s second consecutive daily gain, reinforcing the view that sentiment may be transitioning from bearish to neutral, with a possible pivot to a bullish stance on the horizon.
October rate hike bets fall ahead of US inflation data
The September Federal Open Market Committee (FOMC) minutes revealed a unanimous decision to raise interest rates by 25 basis points to a 3.75-4.00% range. Committee members concurred that this move aligns with the Federal Reserve’s (Fed) commitment to returning inflation to the long-term 2% target.
Despite the odds of an October rate hike falling below 20%, according to CME Group’s FedWatch tool, the majority of officials expected another interest rate hike to be appropriate by year-end. The Committee emphasized that the decision to raise rates in September was approached with an open mind and that future policy deliberations would rely on incoming data, the central bank’s implications for the economic outlook and the balance of risks.
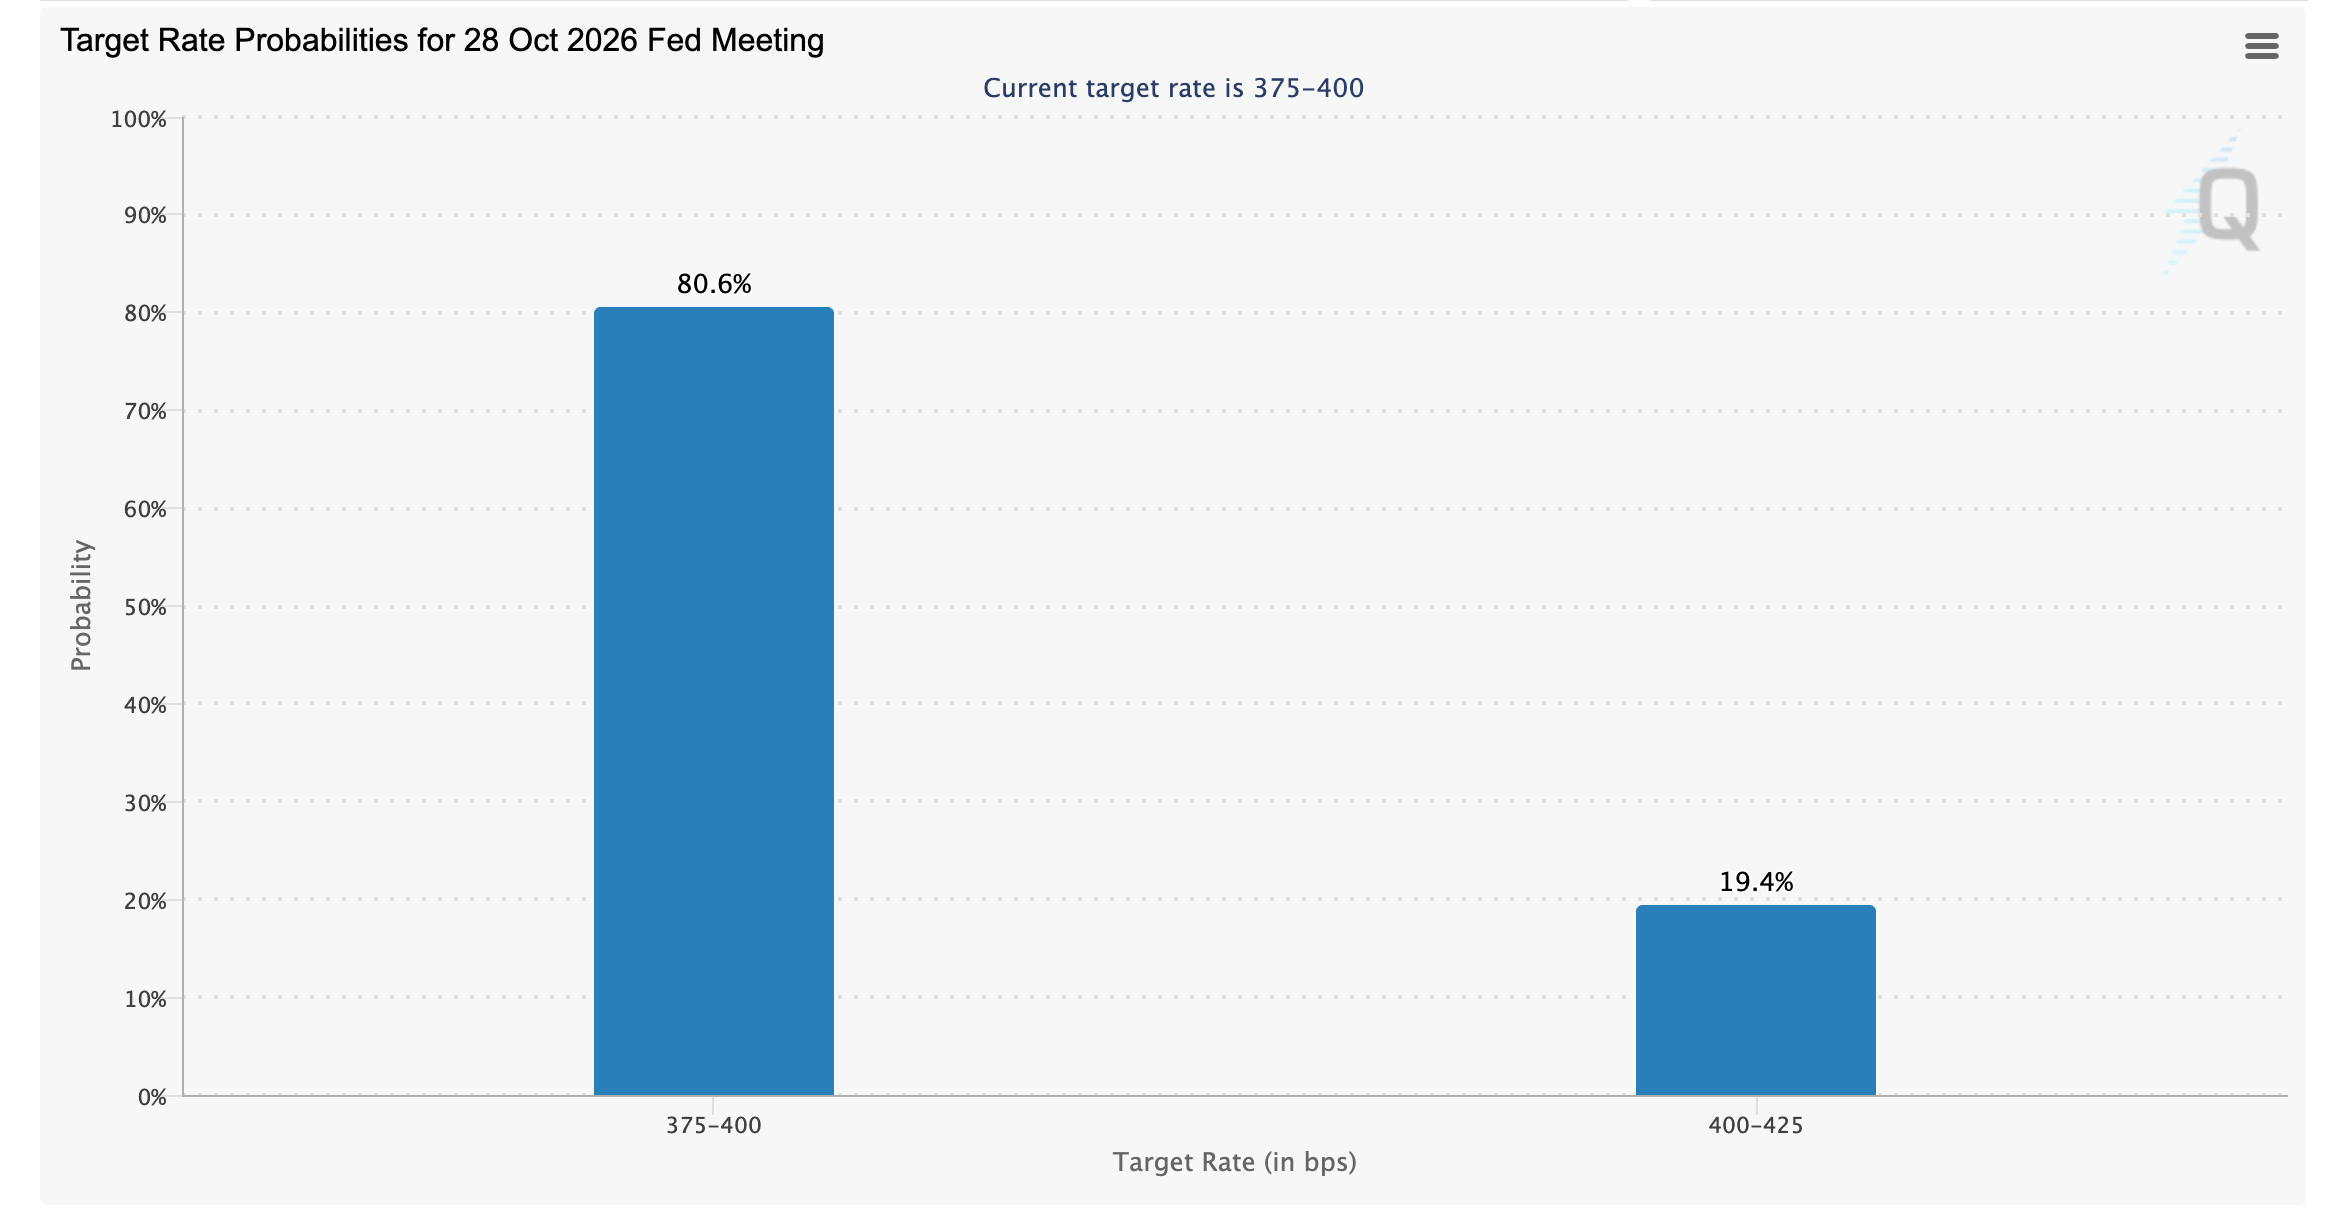
The Bureau of Labor Statistics (BLS) is expected to release the United States (US) Consumer Price Index (CPI) report on Wednesday. This crucial inflation gauge broadly shapes the Committee’s monetary policy decision. The release comes ahead of October’s FOMC meeting, which is widely expected to leave interest rates unchanged.
Crypto Finance said in an emailed analysis report that “October hike odds fell to 17% from about 69% a week earlier, but Wednesday's Minutes showed most officials still expect another hike by year-end after September's move to 3.75–4.00%. October is off the table. December is not.”
Technical analysis: Bitcoin defends support with recovery on the horizon
Bitcoin is gradually gaining momentum from the weekly low near $80,000 to trade above $82,000. On one hand, the sudden correction spooked investors, resulting in cascading losses. On the other hand, it may have been a healthy pullback, encouraging traders to increase risk exposure following the liquidation of overleveraged long positions.
Bitcoin still maintains a bullish near-term bias as price holds above the short-, medium- and long-term Exponential Moving Averages (EMAs), reinforcing a broader constructive structure. Momentum is more cautious, with the Relative Strength Index (RSI) hovering near the neutral 50 line and the Moving Average Convergence Divergence (MACD) below zero, hinting that upside could be vulnerable to pullbacks despite the supportive trend backdrop.
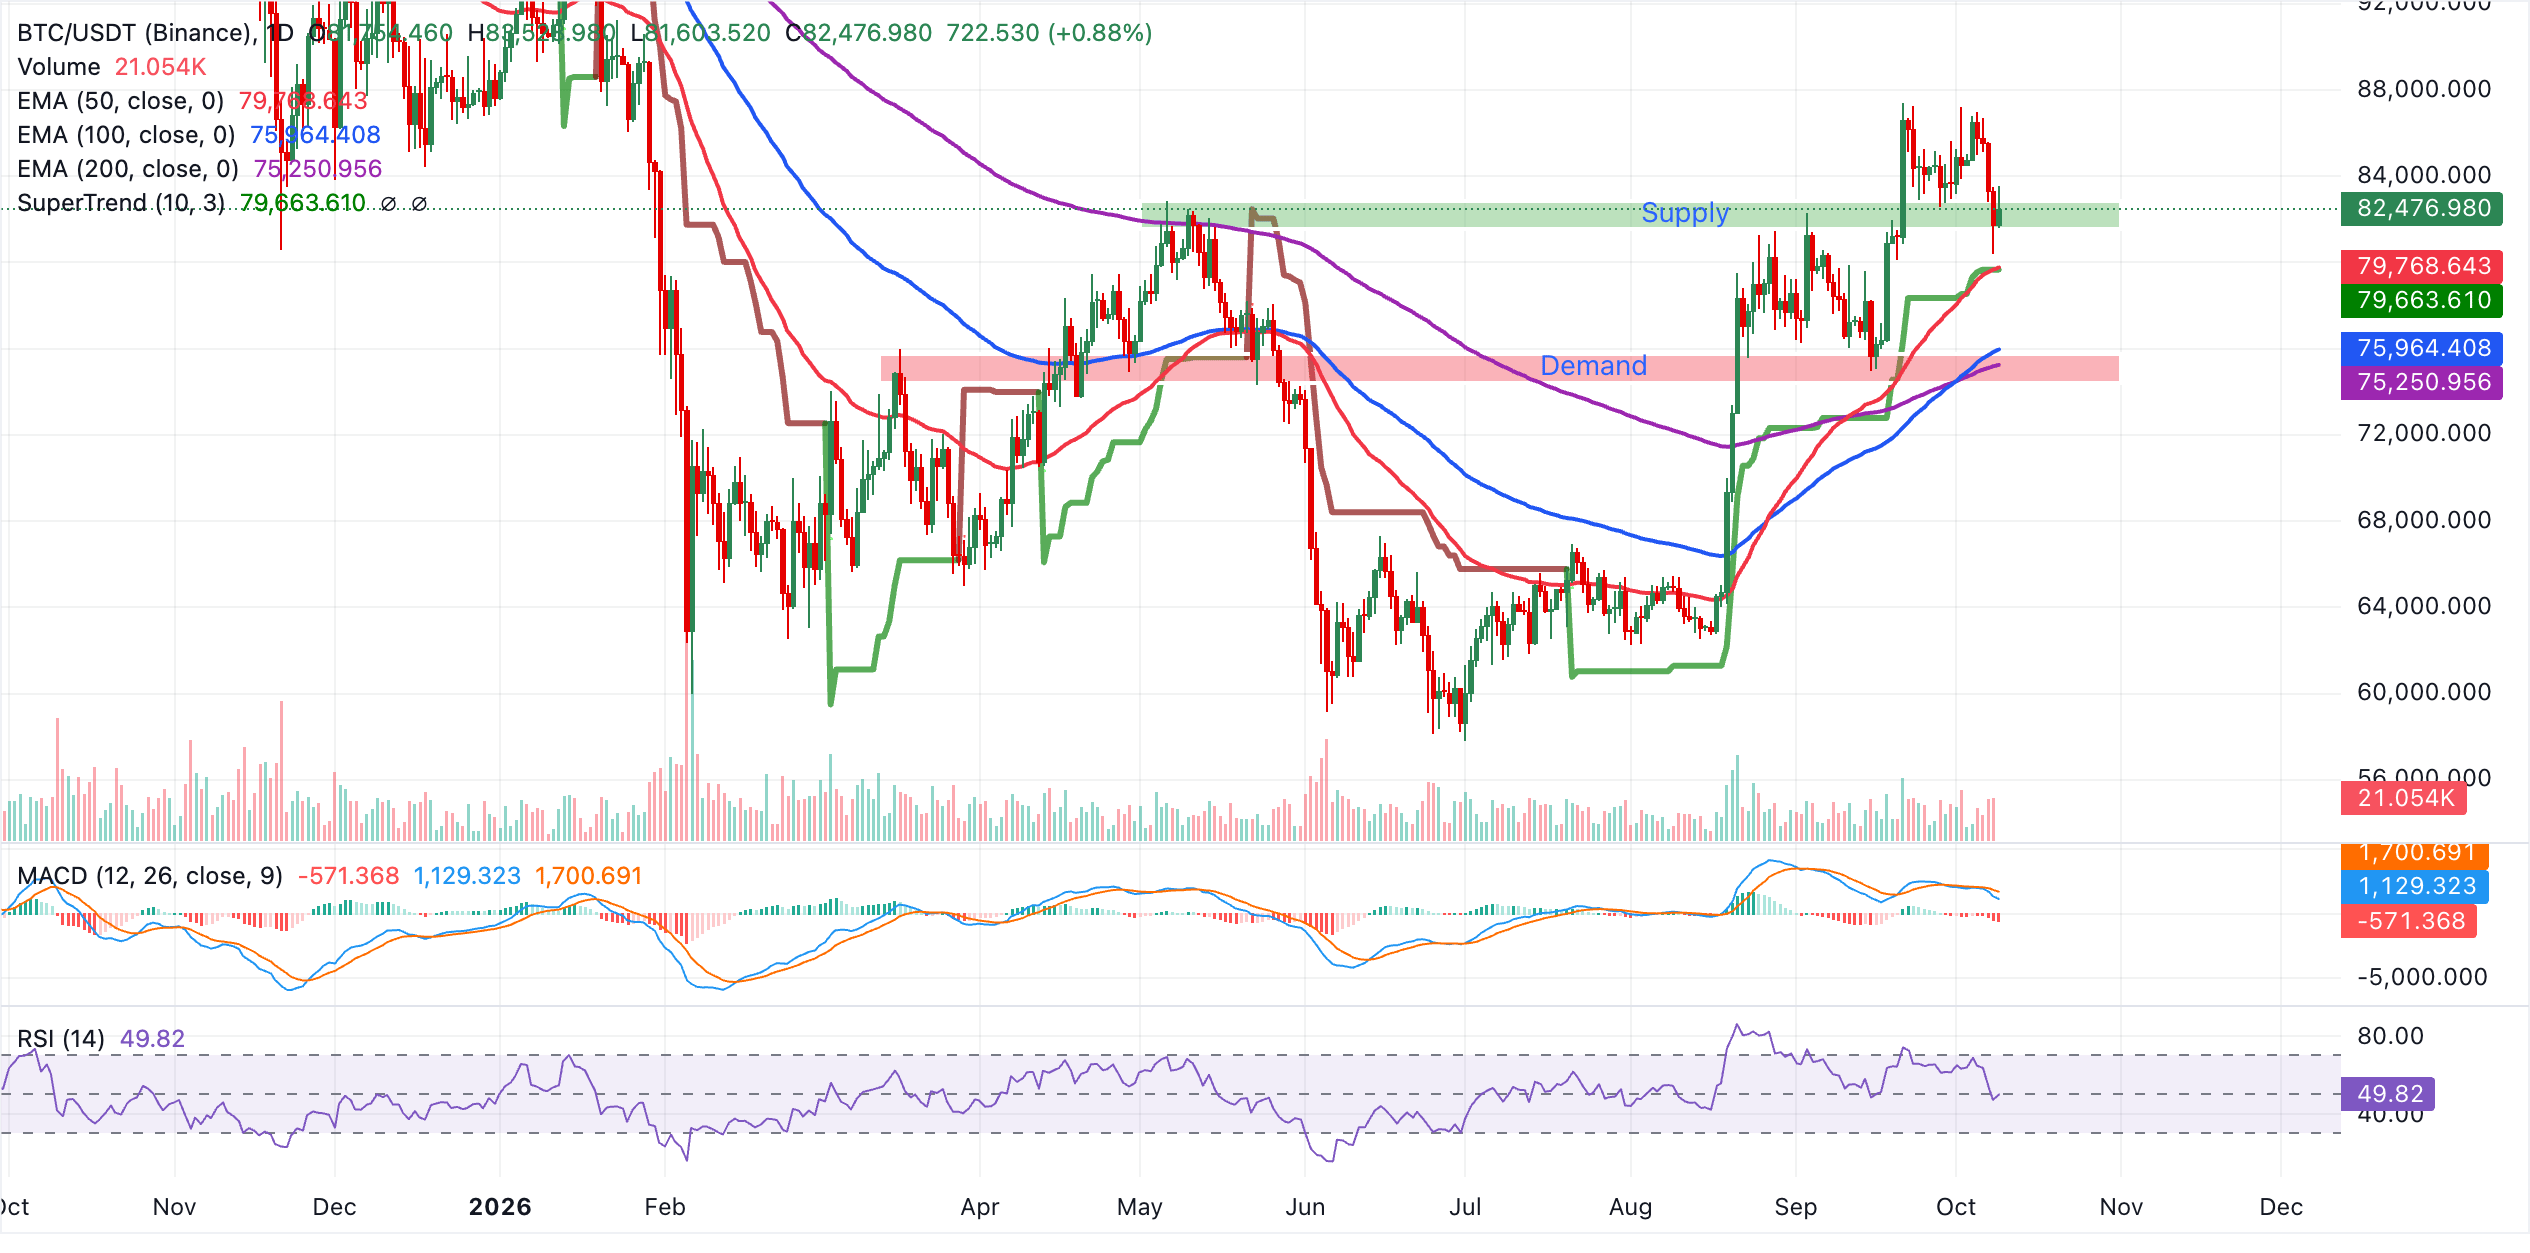
Initial support is around $79,768-$79,664, where the 50-day EMA aligns with the SuperTrend level, and a deeper correction would expose the clustered medium-term floors at the 100-day EMA near $75,964 and the 200-day EMA at $75,251.
On the topside, the absence of nearby mapped resistance levels on the daily chart suggests that Bitcoin's recovery could be challenged at key psychological areas, including $84,000 and $88,000, respectively
Gold technical analysis: XAU builds recovery momentum
Gold edges higher near $4,200 despite broadly trading under pressure due to overhead structural hurdles. A daily close above $4,200 would reinforce a potential bullish comeback, even as the pair sustains a bearish near-term bias and remains below key moving averages.
Spot Gold is capped first by the 50-day EMA at $4,276, with the 200-day EMA at $4,304 and the 100-day EMA at $4,320 reinforcing a dense overhead supply zone that suggests rallies are vulnerable.
The SuperTrend signal at $4,373 and the prior trend-line break area near $4,439 further underline the prevailing downside tone, while the MACD indicator has turned less negative but still trades below zero, hinting only at moderating bearish momentum rather than a sustained recovery. Similarly, the RSI at 45 remains neutral-to-soft, consistent with a corrective bounce within a broader capped market.
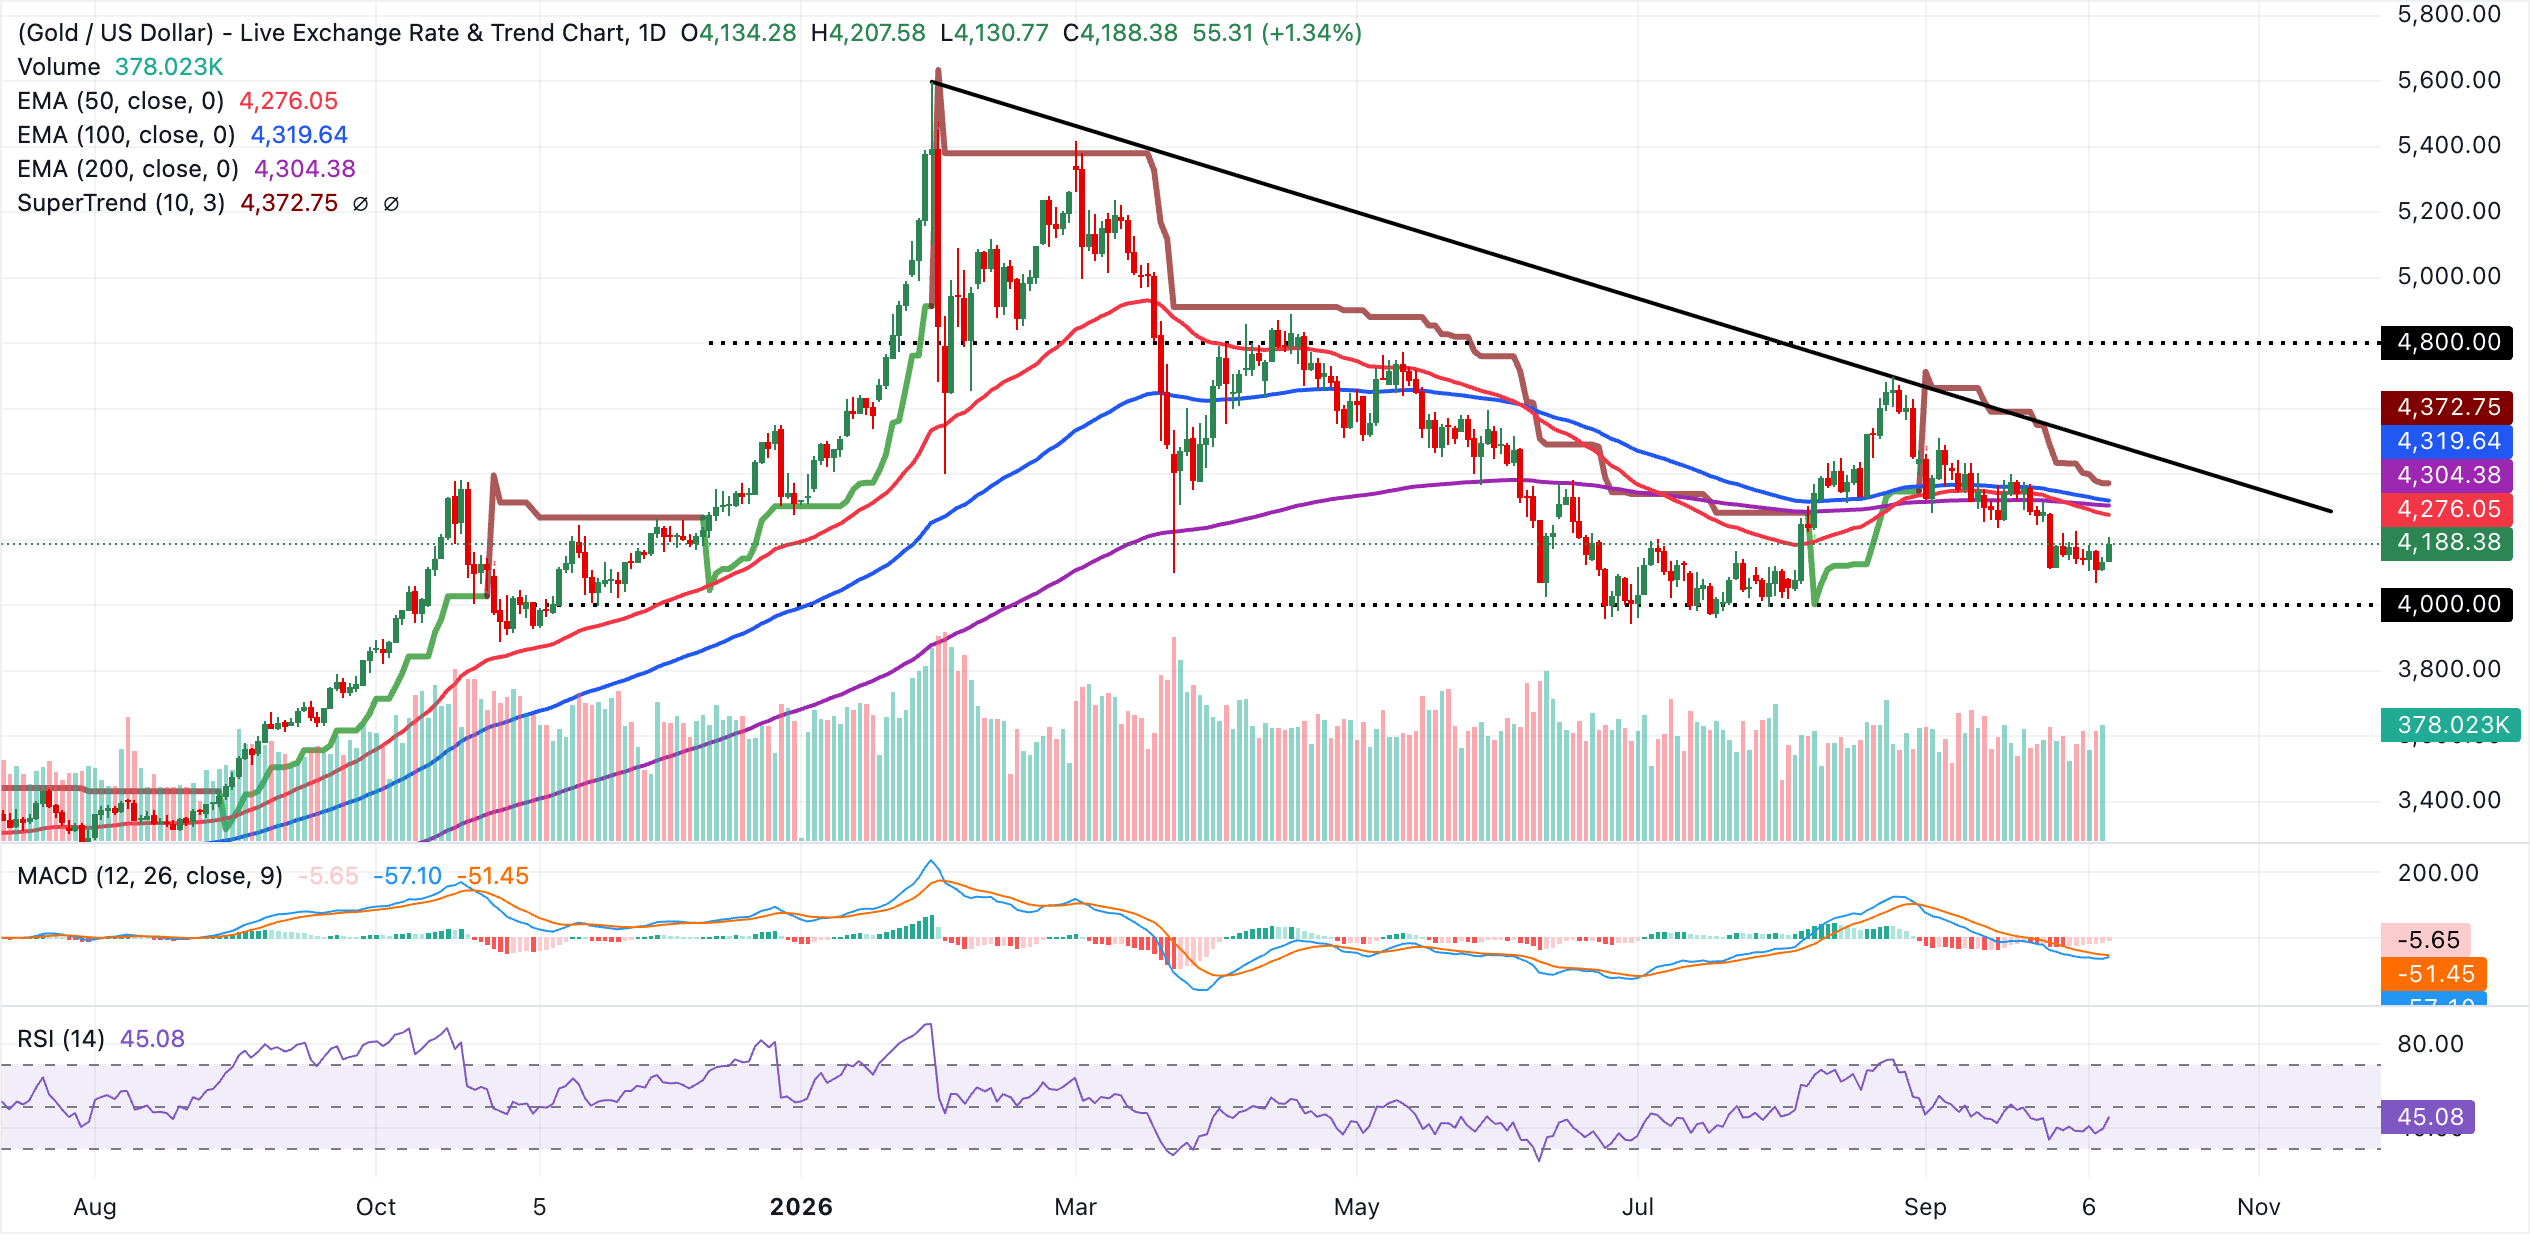
Immediate resistance lies at the 50-day EMA around $4,276, followed by the 200-day EMA near $4,304 and the 100-day EMA near $4,320, where sellers could try to reassert control if price extends higher. Above these clustered averages, the SuperTrend level at roughly $4,373 marks a stronger barrier, ahead of the trendline break region near $4,439, which would need to be cleared to challenge the broader bearish structure.
With no technically defined support areas on the daily chart, any renewed weakness would likely track momentum rather than specific levels, keeping focus on how price behaves as it approaches the above-mentioned resistance band.
(The technical analysis of this story was written with the help of an AI tool. Know more.)
Bitcoin, altcoins, stablecoins FAQs
Bitcoin is the largest cryptocurrency by market capitalization, a virtual currency designed to serve as money. This form of payment cannot be controlled by any one person, group, or entity, which eliminates the need for third-party participation during financial transactions.
Altcoins are any cryptocurrency apart from Bitcoin, but some also regard Ethereum as a non-altcoin because it is from these two cryptocurrencies that forking happens. If this is true, then Litecoin is the first altcoin, forked from the Bitcoin protocol and, therefore, an “improved” version of it.
Stablecoins are cryptocurrencies designed to have a stable price, with their value backed by a reserve of the asset it represents. To achieve this, the value of any one stablecoin is pegged to a commodity or financial instrument, such as the US Dollar (USD), with its supply regulated by an algorithm or demand. The main goal of stablecoins is to provide an on/off-ramp for investors willing to trade and invest in cryptocurrencies. Stablecoins also allow investors to store value since cryptocurrencies, in general, are subject to volatility.
Bitcoin dominance is the ratio of Bitcoin's market capitalization to the total market capitalization of all cryptocurrencies combined. It provides a clear picture of Bitcoin’s interest among investors. A high BTC dominance typically happens before and during a bull run, in which investors resort to investing in relatively stable and high market capitalization cryptocurrency like Bitcoin. A drop in BTC dominance usually means that investors are moving their capital and/or profits to altcoins in a quest for higher returns, which usually triggers an explosion of altcoin rallies.
Nothing in this material constitutes investment advice, personal recommendation, investment research, an offer, or a solicitation to buy or sell any financial instrument. The content has been prepared without consideration of your individual investment objectives, financial situation, or needs, and should not be treated as such.
Past performance is not a reliable indicator of future performance and/or results. Forward-looking scenarios or forecasts are not a guarantee of future performance. Actual results may differ materially from those anticipated.
Mitrade makes no representation or warranty as to the accuracy or completeness of the information provided and accepts no liability for any loss arising from reliance on such information.
Recommended Articles


