



Top AI Coins Forecast: Chainlink, Near Protocol and Bittensor broadly stabilize after sell-off
- Chainlink is gaining momentum above the key $8.00 support level, signaling renewed bullish sentiment.
- Near Protocol remains under broader bearish pressure, slowly gravitating toward the critical $0.62 demand zone.
- Bittensor is exhibiting early signs of a recovery toward $200, supported by bullish signals from the Parabolic SAR indicator.
The cryptocurrency market is stabilizing on Friday as prospects for de-escalation in Middle East geopolitical tensions improve. Artificial Intelligence (AI)-focused tokens such as Chainlink (LINK), Near Protocol (NEAR), and Bittensor (TAO) continue to face selling pressure, yet are defending key technical support levels.
Iran, Oman advance talks on Strait of Hormuz agreement
Iran and Oman are reportedly nearing a deal aimed at resuming commercial shipping through the Strait of Hormuz. However, according to CNN, the agreement does not guarantee an immediate reopening of the strategic waterway. Meanwhile, Iran’s deputy foreign minister has denied any direct negotiations with the United States (US).
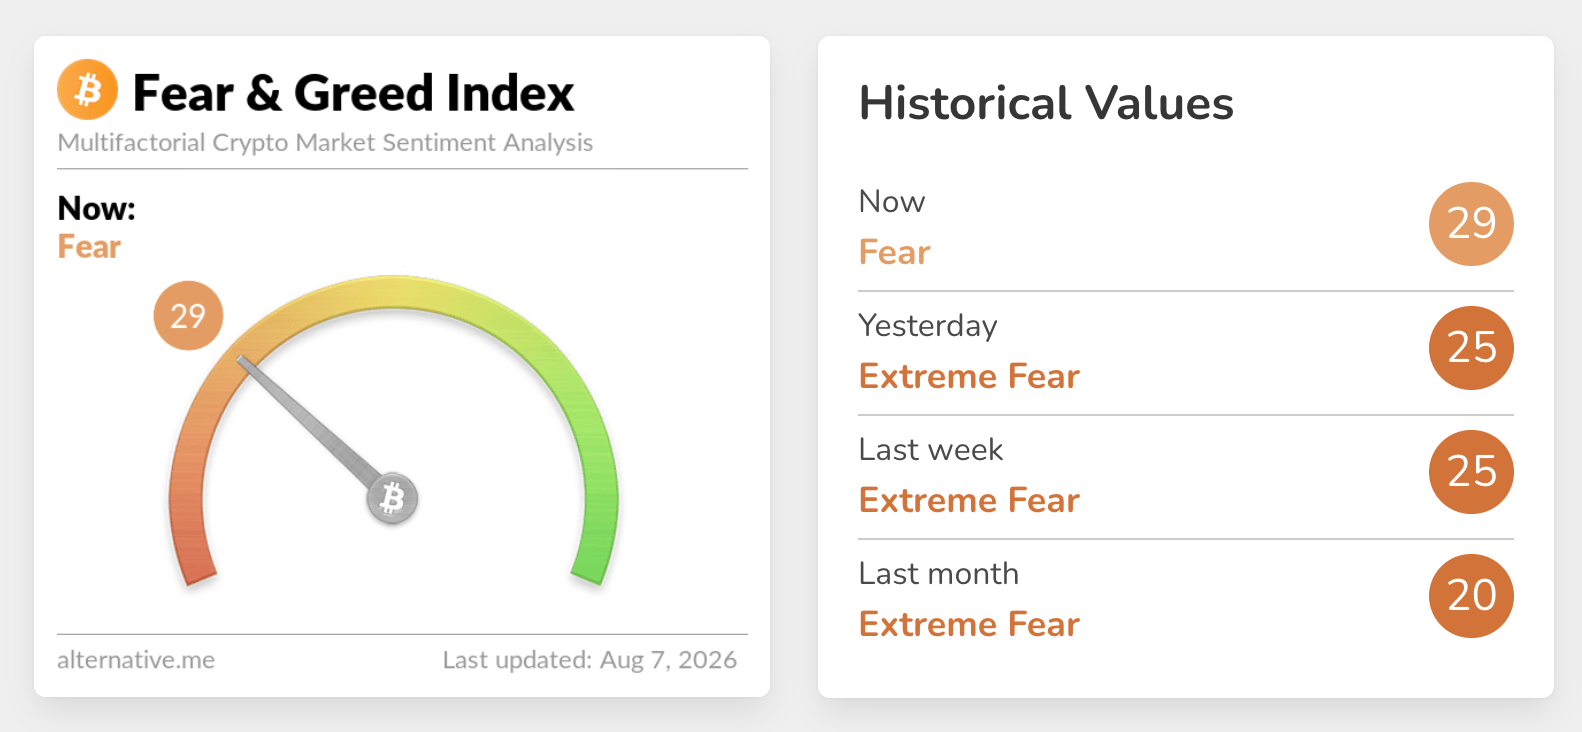
Risk appetite has seen only a slight uptick, with the Fear & Greed Index rising to 29 (Fear) from 25 (Extreme Fear) on Thursday. While sentiment remains cautious, a continued improvement could enhance the appeal of risk assets for investors and increase the likelihood of a sustained market recovery.
Chainlink gains momentum as 50-day EMA limits further gain
Chainlink trades near $8.25, retaining a mildly bearish near-term bias as price slips back under a stack of moving average resistance. The 50-day Exponential Moving Average (EMA) at $8.26, the 100-day EMA at $8.54 and the 200-day EMA at $9.58 all sit overhead, suggesting the recent rebound is losing traction below these dynamic barriers.
Momentum is lackluster, with the Relative Strength Index (RSI) hovering near the midline and the Moving Average Convergence Divergence (MACD) with a negative histogram, hinting that sellers still have the upper hand.
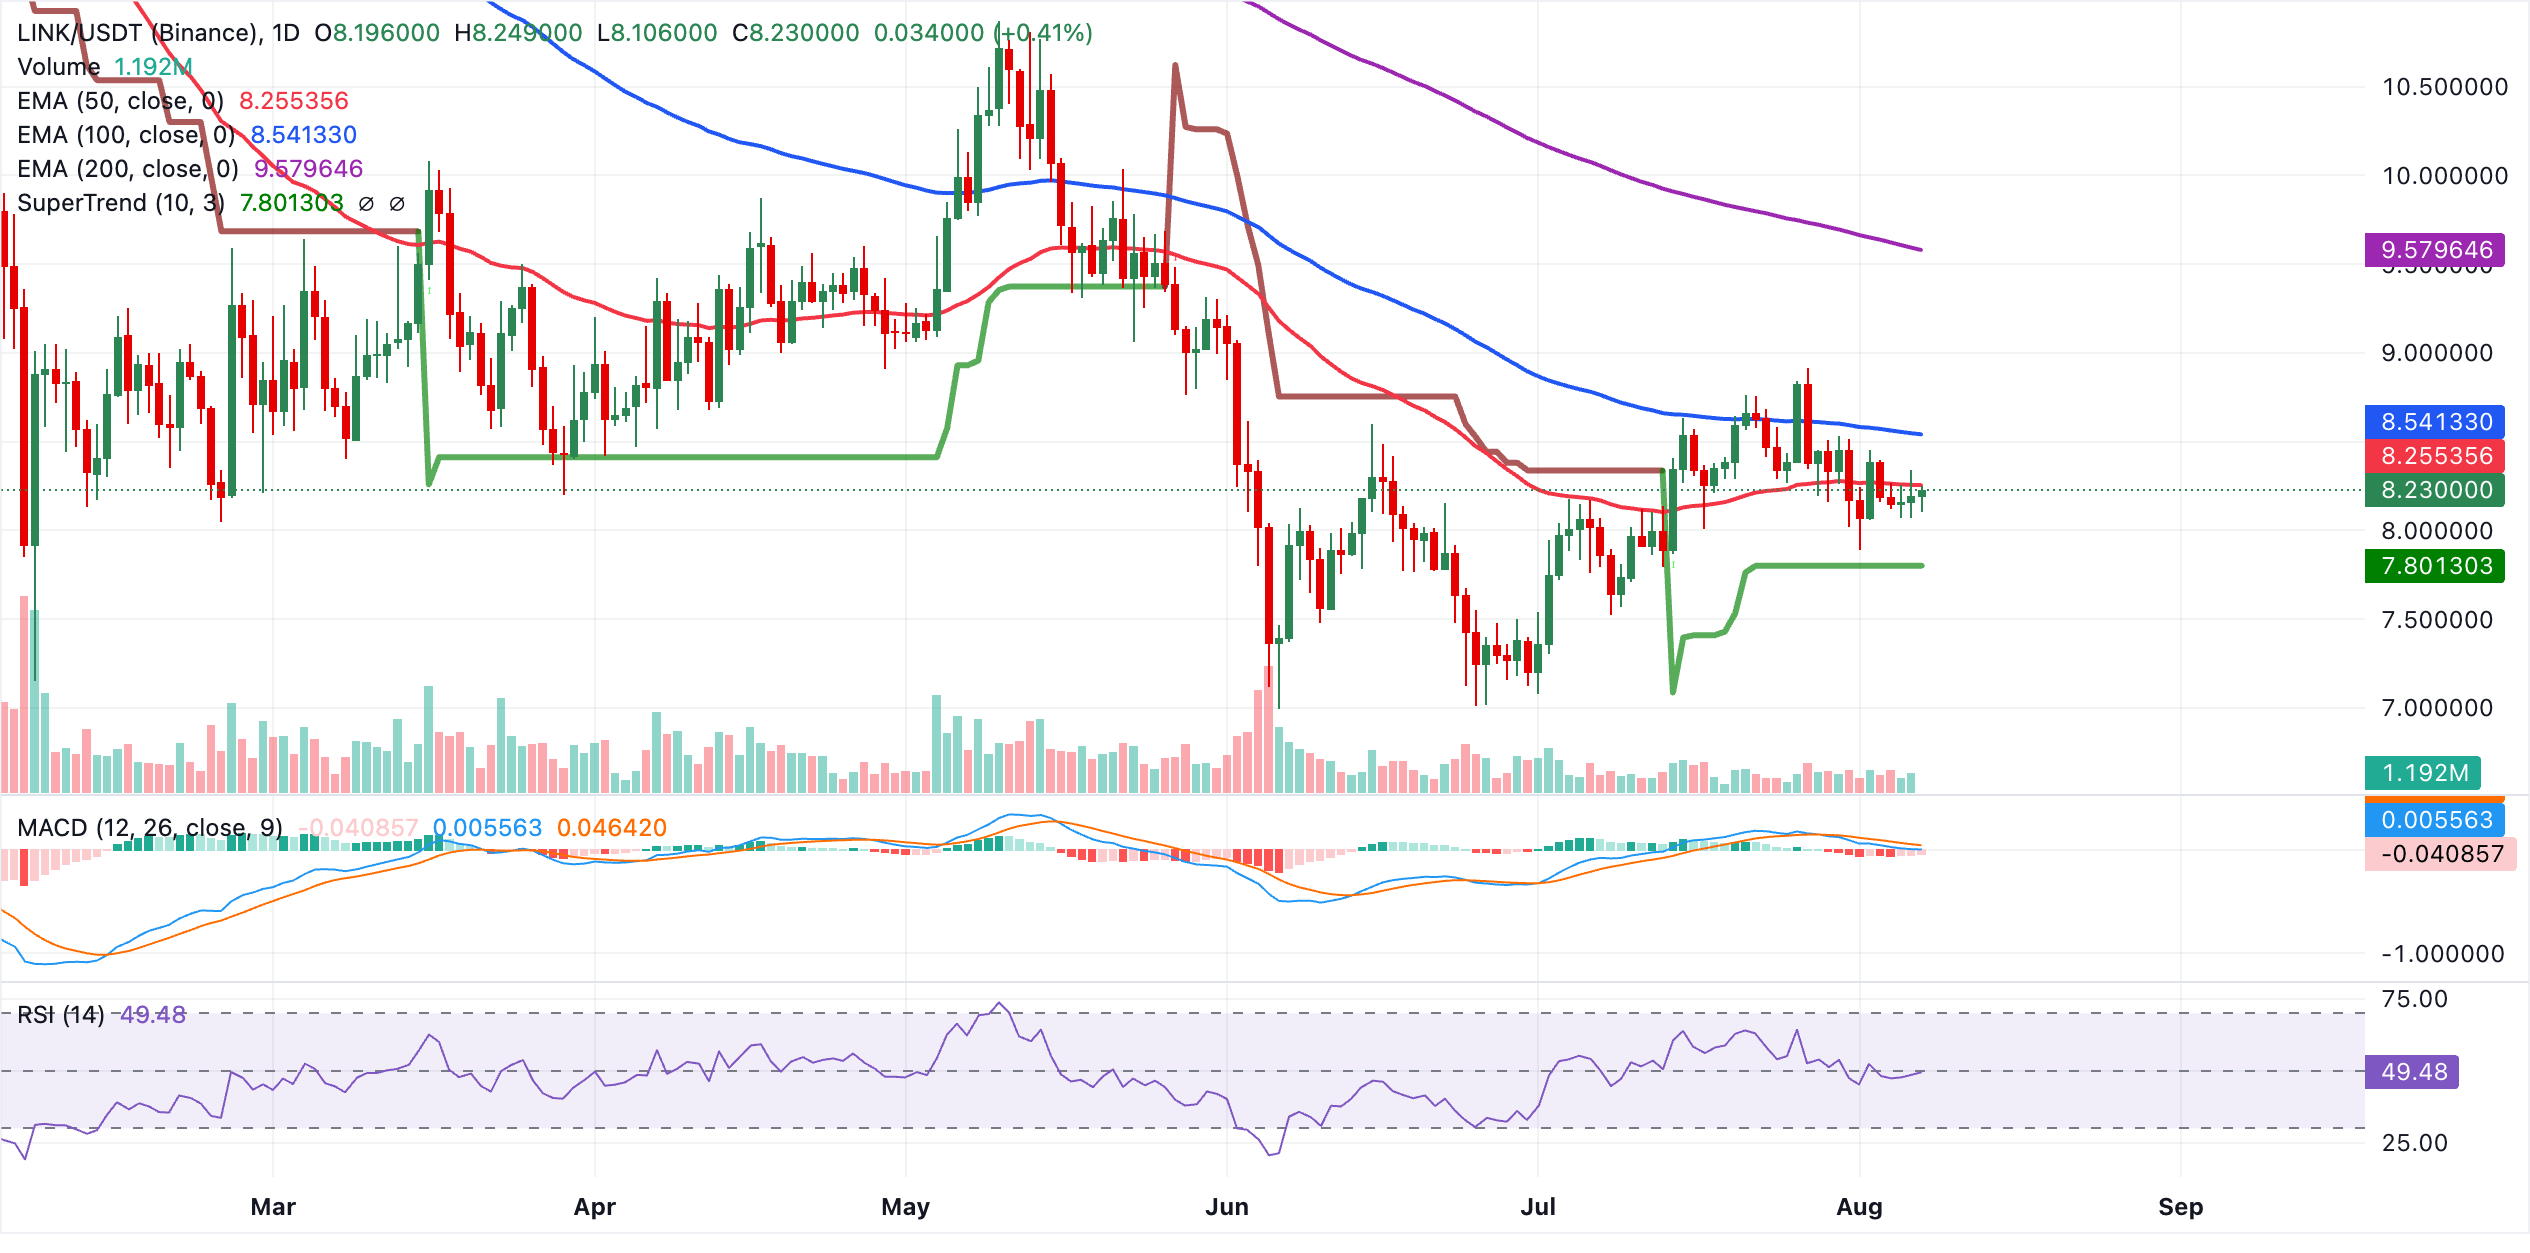
Initial support lies at the SuperTrend line near $7.80, which marks the first structural floor if bearish pressure extends. On the topside, immediate resistance appears at the 50-day EMA at $8.26, followed by the 100-day EMA at $8.54 and then the 200-day EMA at $9.58. A sustained break above this clustered moving-average zone would be needed to shift the bias back toward a more constructive bullish outlook.
NEAR sellers tighten grip as support holds
NEAR trades around $1.6550, keeping a bearish near-term tone as price holds beneath the descending trendline break level at $1.7145 and all key moving averages. The 200-day EMA at $1.7982, together with the 100-day EMA at $1.8265 and the 50-day EMA at $1.8404, forms a layered overhead barrier that suggests rallies are likely to struggle while below this cluster.
Momentum conditions stay soft, with the RSI near 38 on the daily chart hovering in bearish territory and the MACD histogram marginally below zero, hinting that downside pressure remains dominant despite the recent stabilization in price.
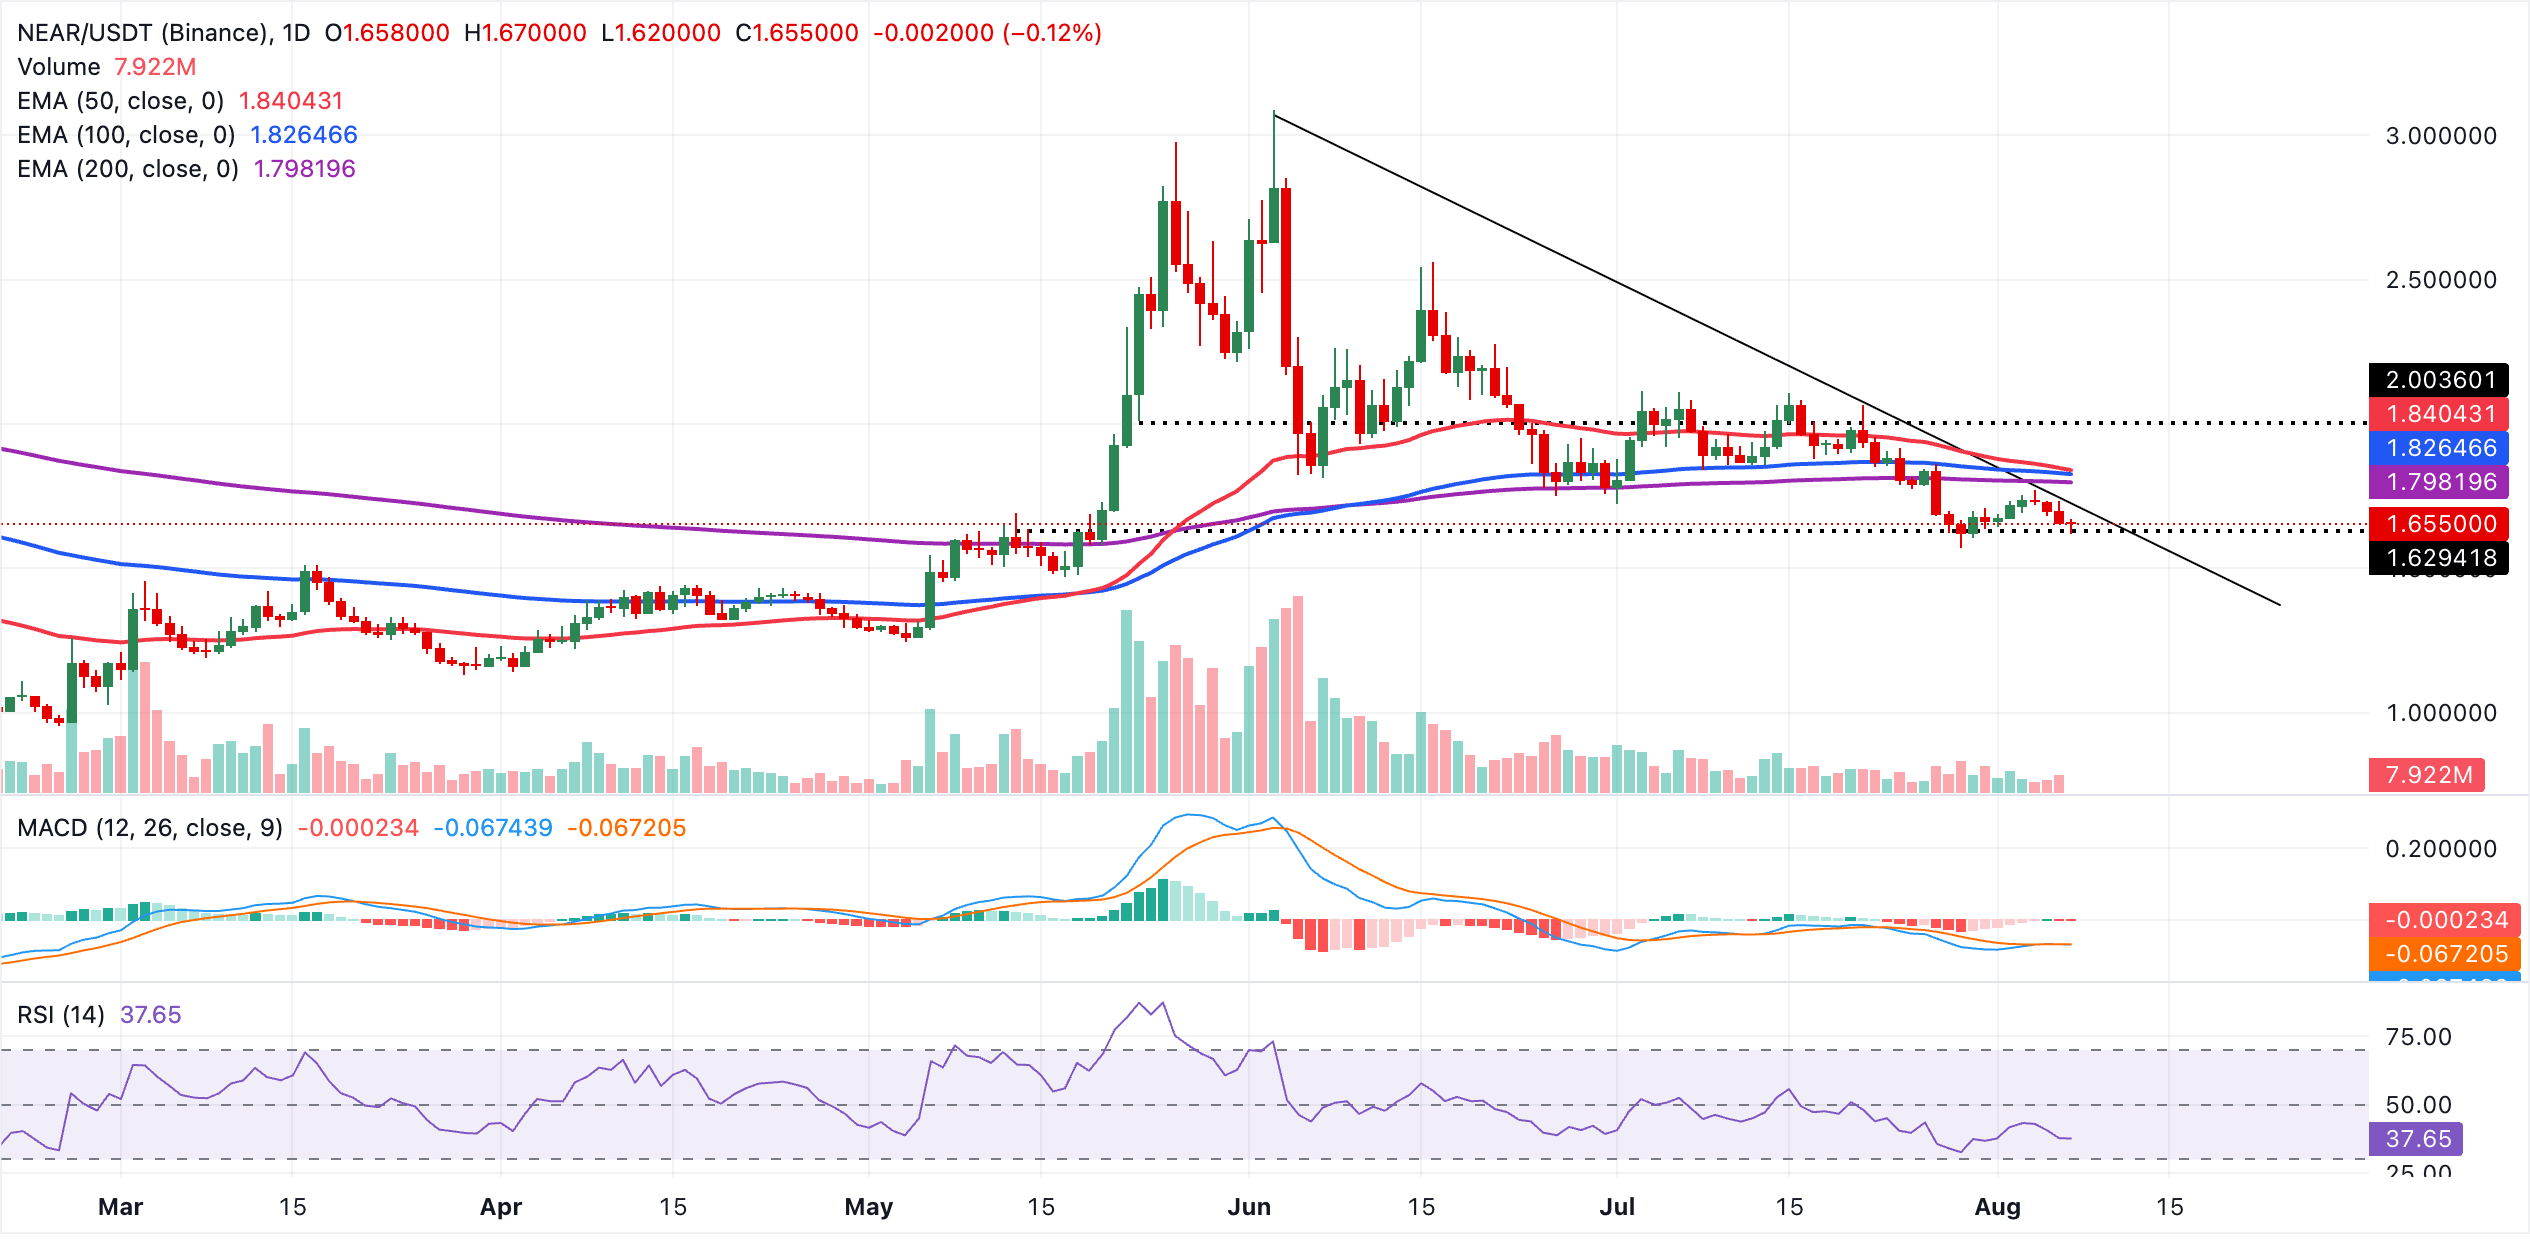
Initial resistance appears at the descending trendline break around $1.7145, where any recovery would first be tested. A sustained move above this level would expose the 200-day EMA at $1.7982, followed by the 100-day EMA at $1.8265 and the 50-day EMA at $1.8404, which together define a broader supply zone capping the medium-term recovery potential. On the flip side, investors may look to psychological round numbers and recent swing lows at $1.6200 and $1.6000 for potential re-engagement if the sell-off persists.
Bittensor eyes break above $200 in breakout attempt
Bittensor holds below the short and medium-term moving averages, with the 50-day EMA near $206, the 100-day EMA around $221 and the 200-day EMA close to $241, all acting as overhead resistance and keeping the broader tone bearish despite the recent rebound from sub-$190 levels.
The Parabolic SAR at about $186 sits beneath the spot price and offers the nearest dynamic support, while a positive MACD histogram and an RSI just below the midline hint at improving but still tentative upside momentum within a capped environment.
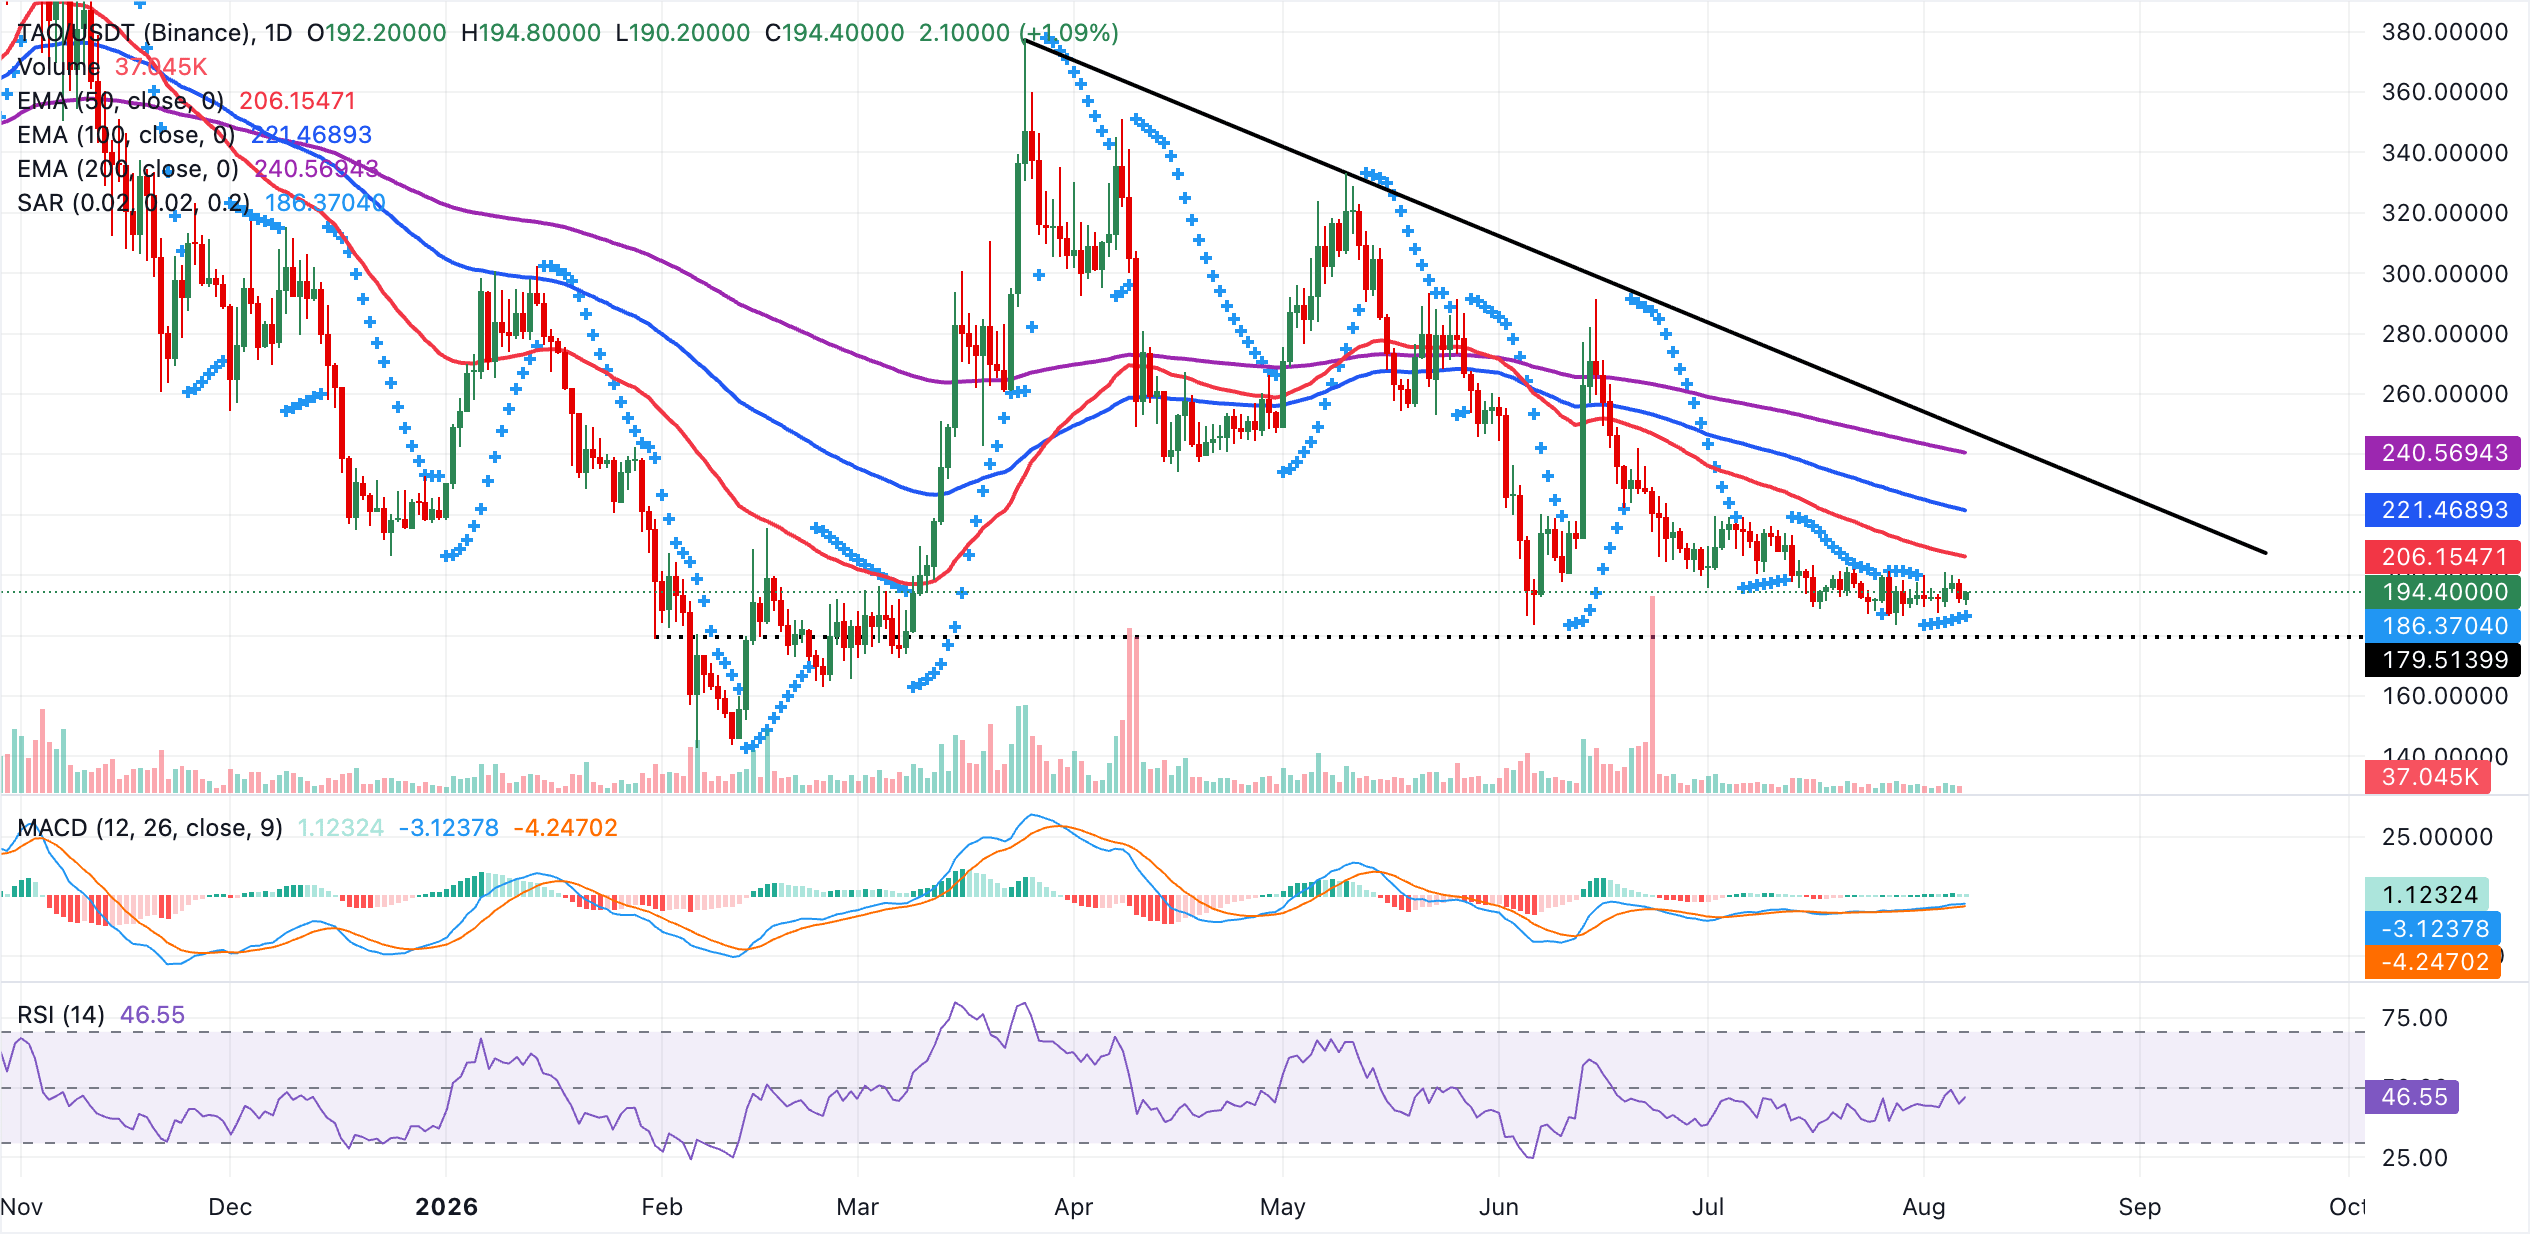
Initial resistance lies at the 50-day EMA around $206. A daily close above this level would expose the 100-day EMA near $221, with the 200-day EMA at $241 and the descending resistance trendline around $248 forming a broader supply band higher up. On the downside, immediate support is provided by the Parabolic SAR at $186. A break beneath this level would likely re-open the path toward the recent swing lows at $190 and $180, reinforcing the prevailing bearish bias.
(The technical analysis of this story was written with the help of an AI tool. Know more.)
Cryptocurrency prices FAQs
Token launches influence demand and adoption among market participants. Listings on crypto exchanges deepen the liquidity for an asset and add new participants to an asset’s network. This is typically bullish for a digital asset.
A hack is an event in which an attacker captures a large volume of the asset from a DeFi bridge or hot wallet of an exchange or any other crypto platform via exploits, bugs or other methods. The exploiter then transfers these tokens out of the exchange platforms to ultimately sell or swap the assets for other cryptocurrencies or stablecoins. Such events often involve an en masse panic triggering a sell-off in the affected assets.
Macroeconomic events like the US Federal Reserve’s decision on interest rates influence crypto assets mainly through the direct impact they have on the US Dollar. An increase in interest rate typically negatively influences Bitcoin and altcoin prices, and vice versa. If the US Dollar index declines, risk assets and associated leverage for trading gets cheaper, in turn driving crypto prices higher.
Halvings are typically considered bullish events as they slash the block reward in half for miners, constricting the supply of the asset. At consistent demand if the supply reduces, the asset’s price climbs.
Nothing in this material constitutes investment advice, personal recommendation, investment research, an offer, or a solicitation to buy or sell any financial instrument. The content has been prepared without consideration of your individual investment objectives, financial situation, or needs, and should not be treated as such.
Past performance is not a reliable indicator of future performance and/or results. Forward-looking scenarios or forecasts are not a guarantee of future performance. Actual results may differ materially from those anticipated.
Mitrade makes no representation or warranty as to the accuracy or completeness of the information provided and accepts no liability for any loss arising from reliance on such information.
Recommended Articles


