



Ethereum Price Forecast: ETH on-chain signal remains weak even as mild retail distribution continues
Ethereum price today: $1,880
- Ethereum on-chain signals have been weak over the past week following minimal changes in exchange net flows and reserves.
- Retail wallets distributed 160K ETH while whales accumulated roughly 100K ETH.
- ETH fails to escape the key EMAs consolidation range.
Ethereum (ETH) continued to consolidate in the tight $1,800-$2,000 range on Thursday amid weak signals across key on-chain metrics.
ETH Exchange Netflow, which measures the difference between coins flowing in and out of exchanges, indicates mild dominance in selling activity after its 14-day moving average flipped positive.
 - All Exchanges (20)-1786678321792.png)
A similar trend is evident in the Exchange Reserves metric, which measures the total amount of ETH held on exchanges. The metric has been largely flat over the past week, with a slight rise to 15.13 million ETH over the last two days. Rising values are historically more associated with increased selling pressure.
The Coinbase Premium Index, a measure of US sentiment, has also remained in negative territory, declining further to -0.081 in the past two days despite improvement in the US stock market.
-1786678354632.png)
In contrast, US spot ETH exchange-traded funds (ETFs) recorded $244.9 million in net inflows last week, according to SoSoValue data. So far this week, the products have only seen modest outflows of $8.9 million.
The divergence indicates improving sentiment among traditional and institutional investors in the US while crypto-native investors remain cautious.
The cautious sentiment likely stems from small-scale investors or retail wallets. Over the past week, wallets with a balance of 100-1K and 1K-10K ETH offloaded a combined 160K ETH, continuing a distribution pattern that has been consistent since late April.
On the other hand, whale investors, wallets with a balance of 10K-100K ETH, have been on the opposite side of that distribution, accumulating roughly 100K ETH over the past week.
Meanwhile, CryptoQuant contributor analyst MorenoDV suggested that Ethereum may be approaching another bottom after the Net Unrealized Profit/Loss (NUPL) of ETH held on Binance declined near the key -0.35 level.
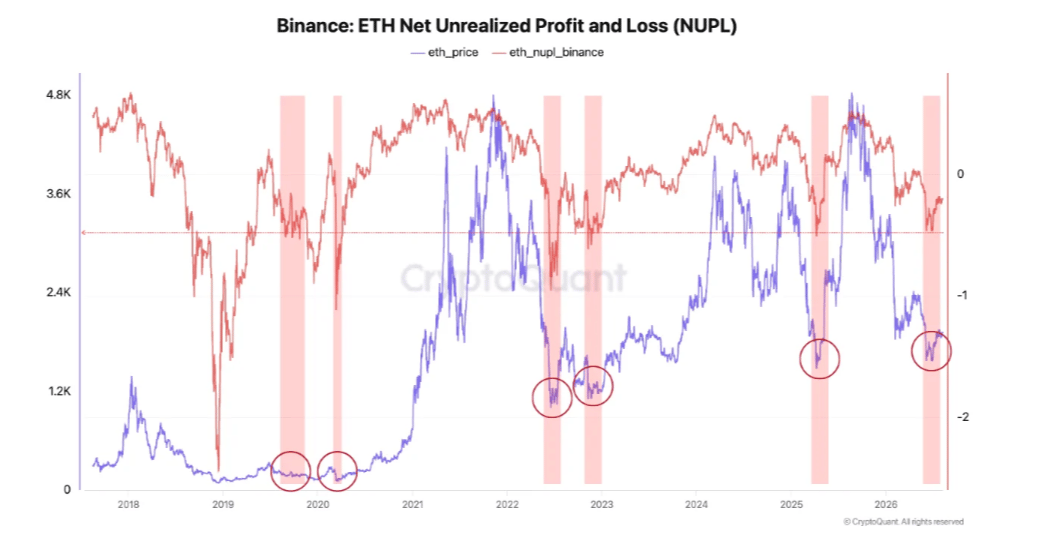
"Historically, [these] levels coincided with the lows of late 2019 and March 2020, both 2022 bottoming phases, the 2025 correction and the latest drawdown,” wrote MorenoDV. “Different catalysts produced the same underlying condition: losses had become severe enough to suggest that selling pressure was already mature.”
The analyst noted that after loss-sensitive investors have capitulated, the remaining supply may be unwilling to sell at lower valuations. As a result, modest demand may return due to the less marginal supply generated by distributors.
Ethereum Price Forecast: ETH fails to escape tight EMA range
Ethereum has seen $30 million in liquidations over the past 24 hours, led by $21.1 million in long liquidations, according to Coinglass data.
Following that move, ETH is holding a constructive near-term bullish bias on the daily chart, hovering above the 20- and 50-day Exponential Moving Averages (EMAs) at $1,884 and $1,865, respectively. Meanwhile, a mildly positive Relative Strength Index (RSI) near 52 and a neutral Stochastic reading around 55 hint at steady, rather than aggressive, upside momentum.
On the topside, immediate resistance emerges at the 100-day EMA at $1,922, followed by the horizontal barrier near $1,961, with more distant levels at $2,172 and $2,431, reinforcing a broader supply zone.
On the downside, initial support is provided by the 20- and 50-day EMAs, ahead of stronger underlying demand at the horizontal floor around $1,809. A break below that area would expose deeper supports at $1,701 and $1,507.
(The technical analysis of this story was written with the help of an AI tool. Know more.)
Nothing in this material constitutes investment advice, personal recommendation, investment research, an offer, or a solicitation to buy or sell any financial instrument. The content has been prepared without consideration of your individual investment objectives, financial situation, or needs, and should not be treated as such.
Past performance is not a reliable indicator of future performance and/or results. Forward-looking scenarios or forecasts are not a guarantee of future performance. Actual results may differ materially from those anticipated.
Mitrade makes no representation or warranty as to the accuracy or completeness of the information provided and accepts no liability for any loss arising from reliance on such information.
Recommended Articles


