



Raydium Price Forecast: Rally signals trend reversal amid network growth, buyback
- Raydium is up nearly 9% on Thursday, extending its 41% rally from Sunday.
- On-chain data shows an increase in network growth driven by user activity and staking.
- Raydium bought back $640,000 worth of RAY tokens, reducing its circulating supply.
Raydium (RAY) maintains a firm bullish tone, posting nearly 9% gains on Thursday and extending its 41% rally from Sunday. Solana-based Decentralized Exchange (DEX) is witnessing a surge in network activity and growth amid new token launches. The technical outlook for Raydium signals a potential upside toward $1.50 as momentum holds firm despite overbought conditions.
DeFi network activity heats up
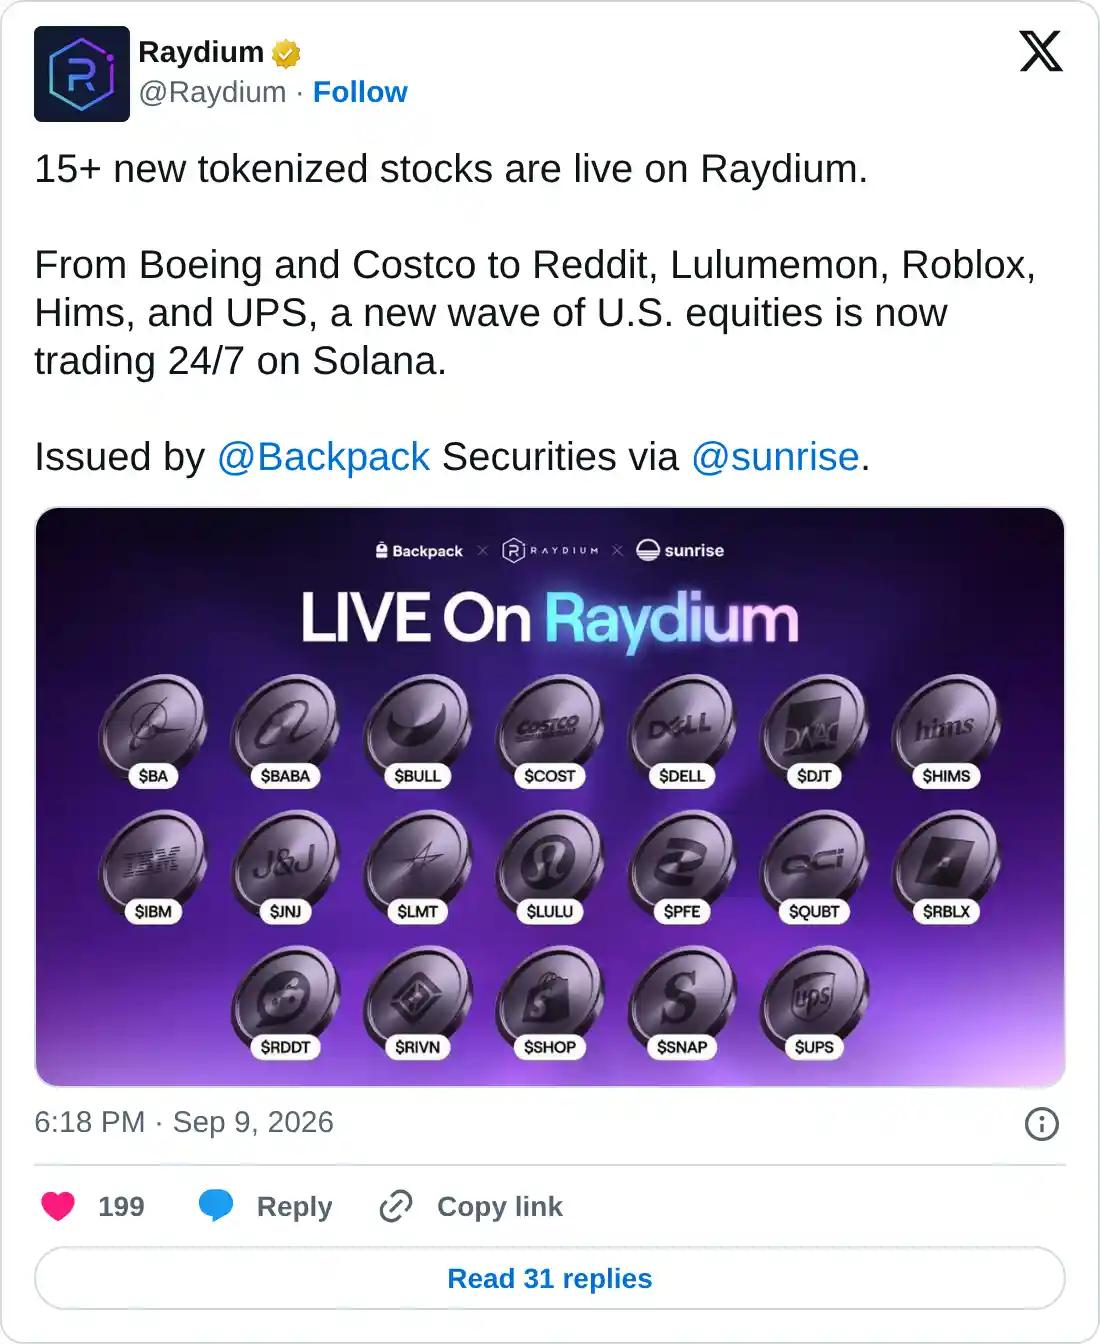
Raydium’s network activity shows early signs of renewed user demand amid the launch of more than 15 tokenized US equities, including Boeing, Costco, Reddit, Lulumemon, and Roblox. This follows the recent launch of the Bittensor (TAO) and Dogecoin (DOGE) pairs, reflecting the expansion of DeFi offerings.
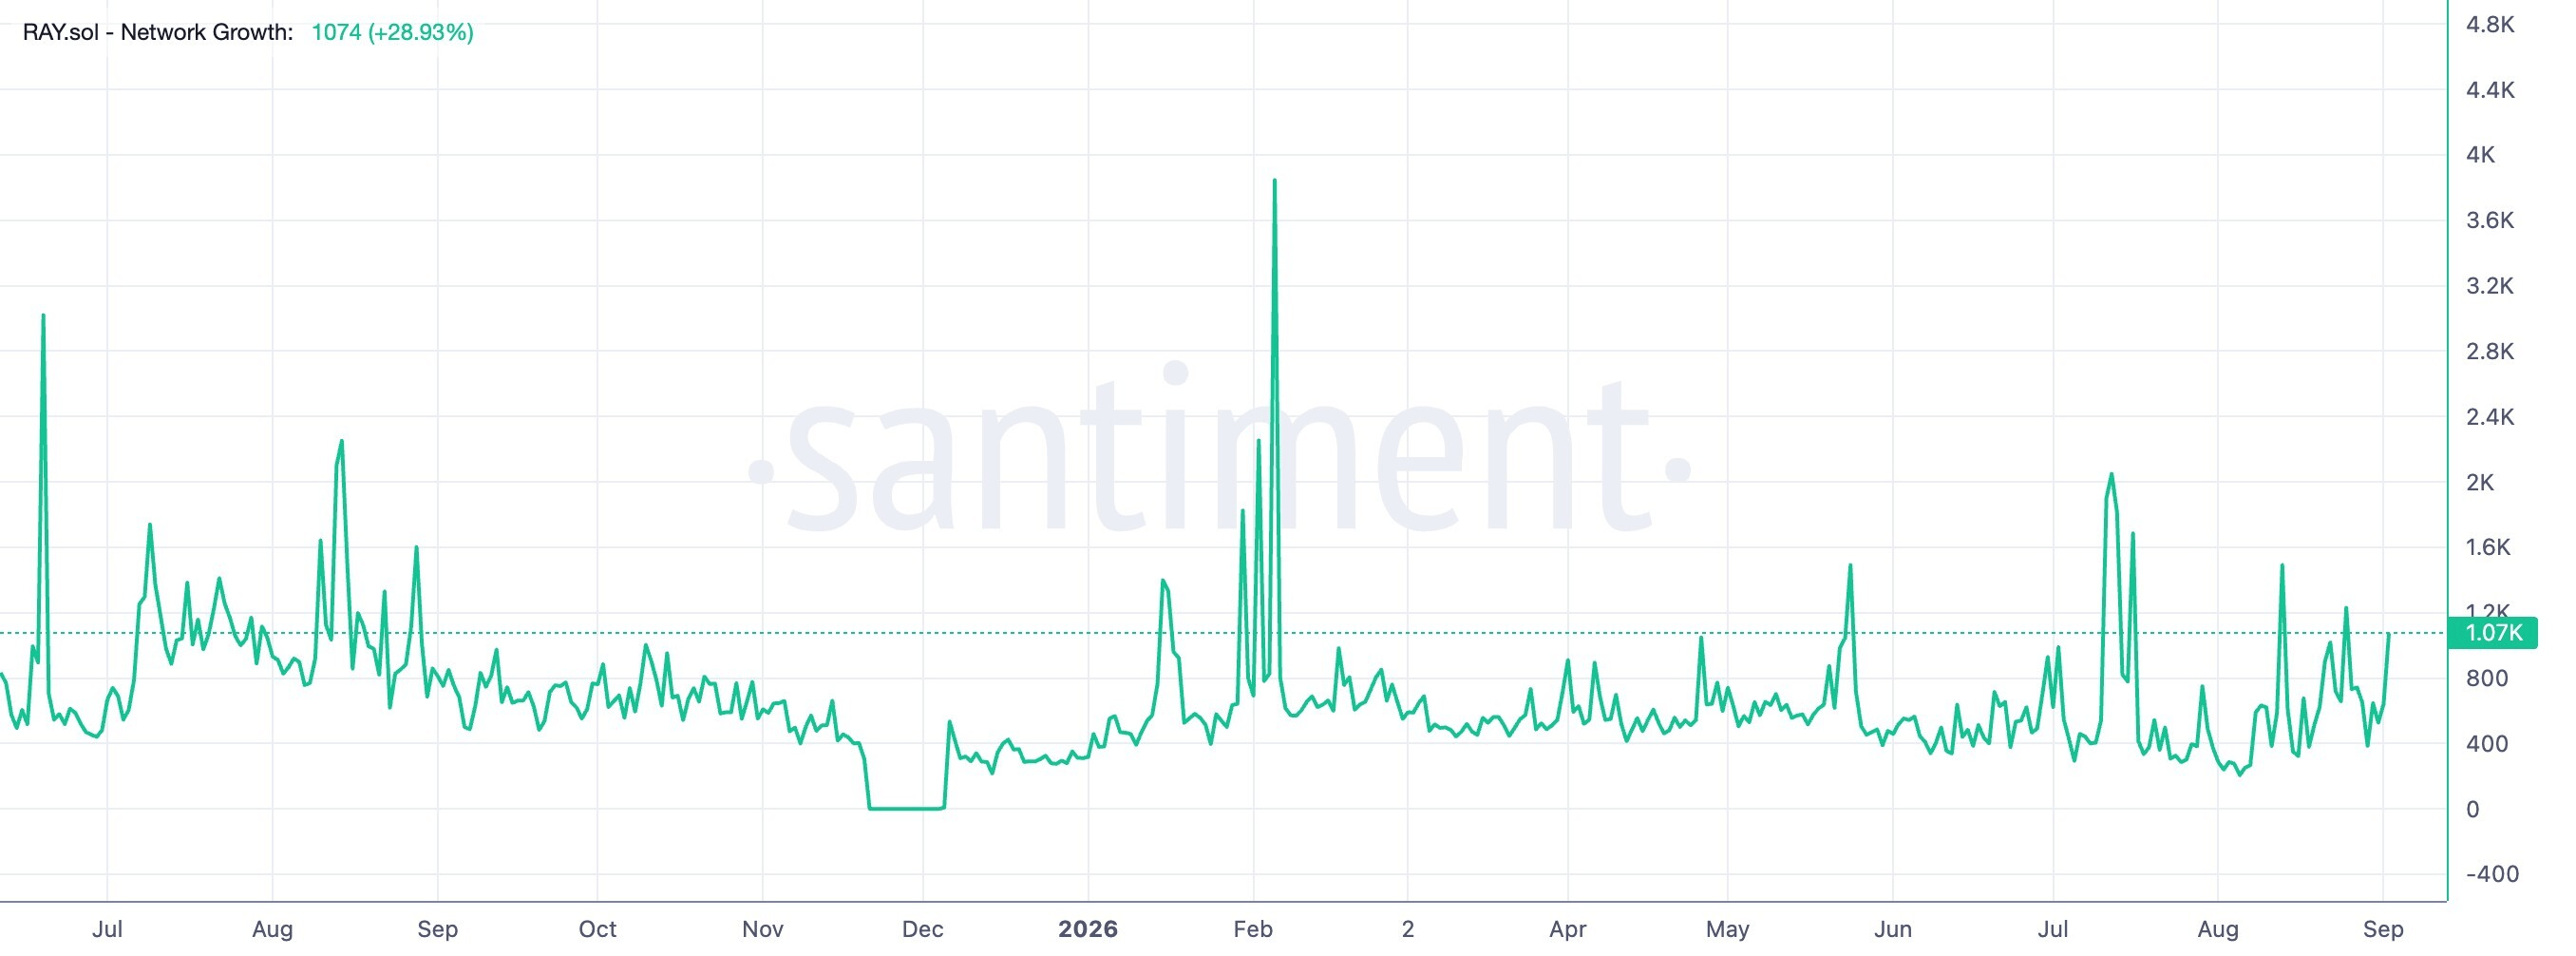
Santiment data shows Raydium’s network growth, a metric that tracks user adoption over time based on the number of new addresses transferring for the first time, 1,074 on Wednesday. Multiple spikes over the past month reflect waves of new users joining the network.
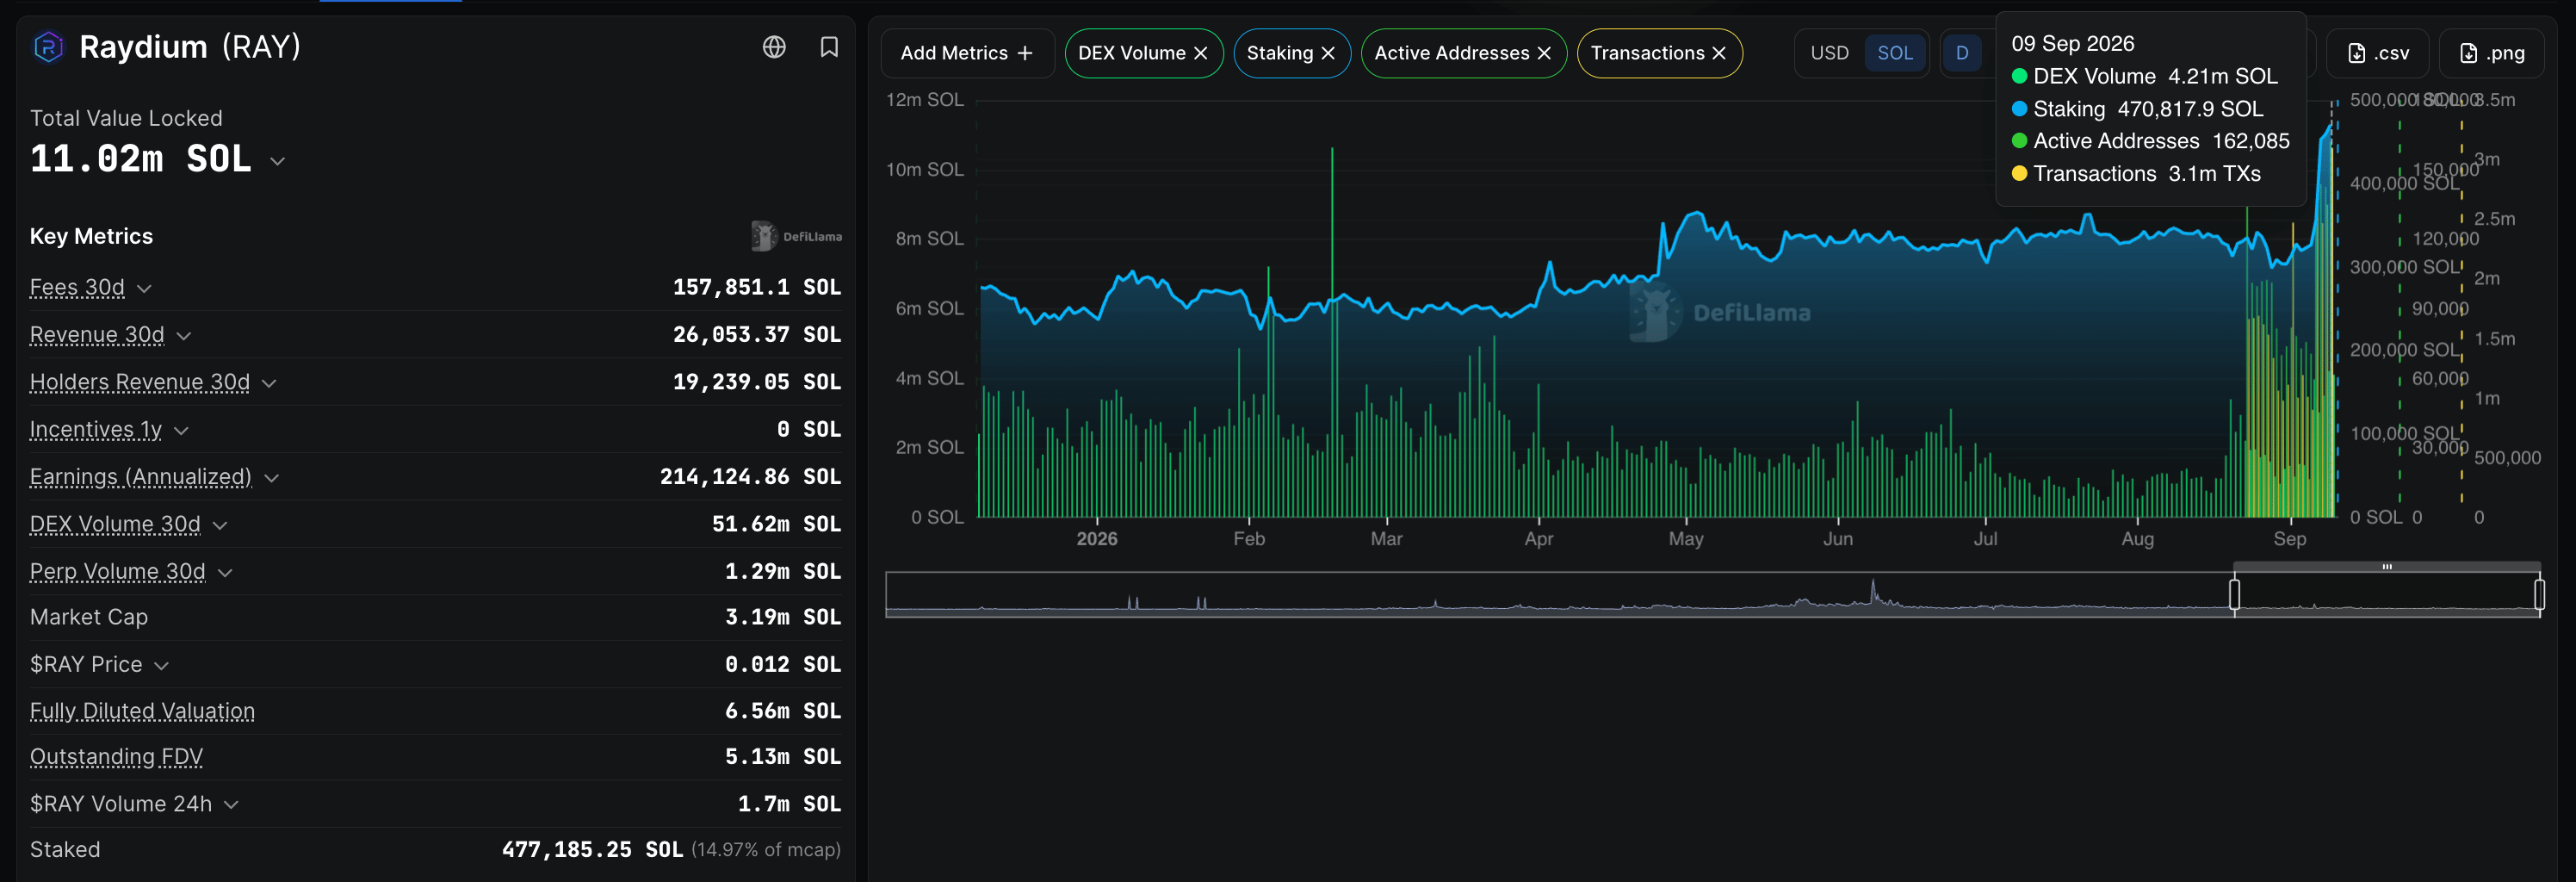
Corroborating with renewed network strength, DeFiLlama data shows SOL staked on Raydium reached a new high of 470,817 tokens on Wednesday, suggesting fresh inflows. At the same time, the active addresses and transactions stood at 162,085 users and 3.1 million, respectively, hitting a monthly high.
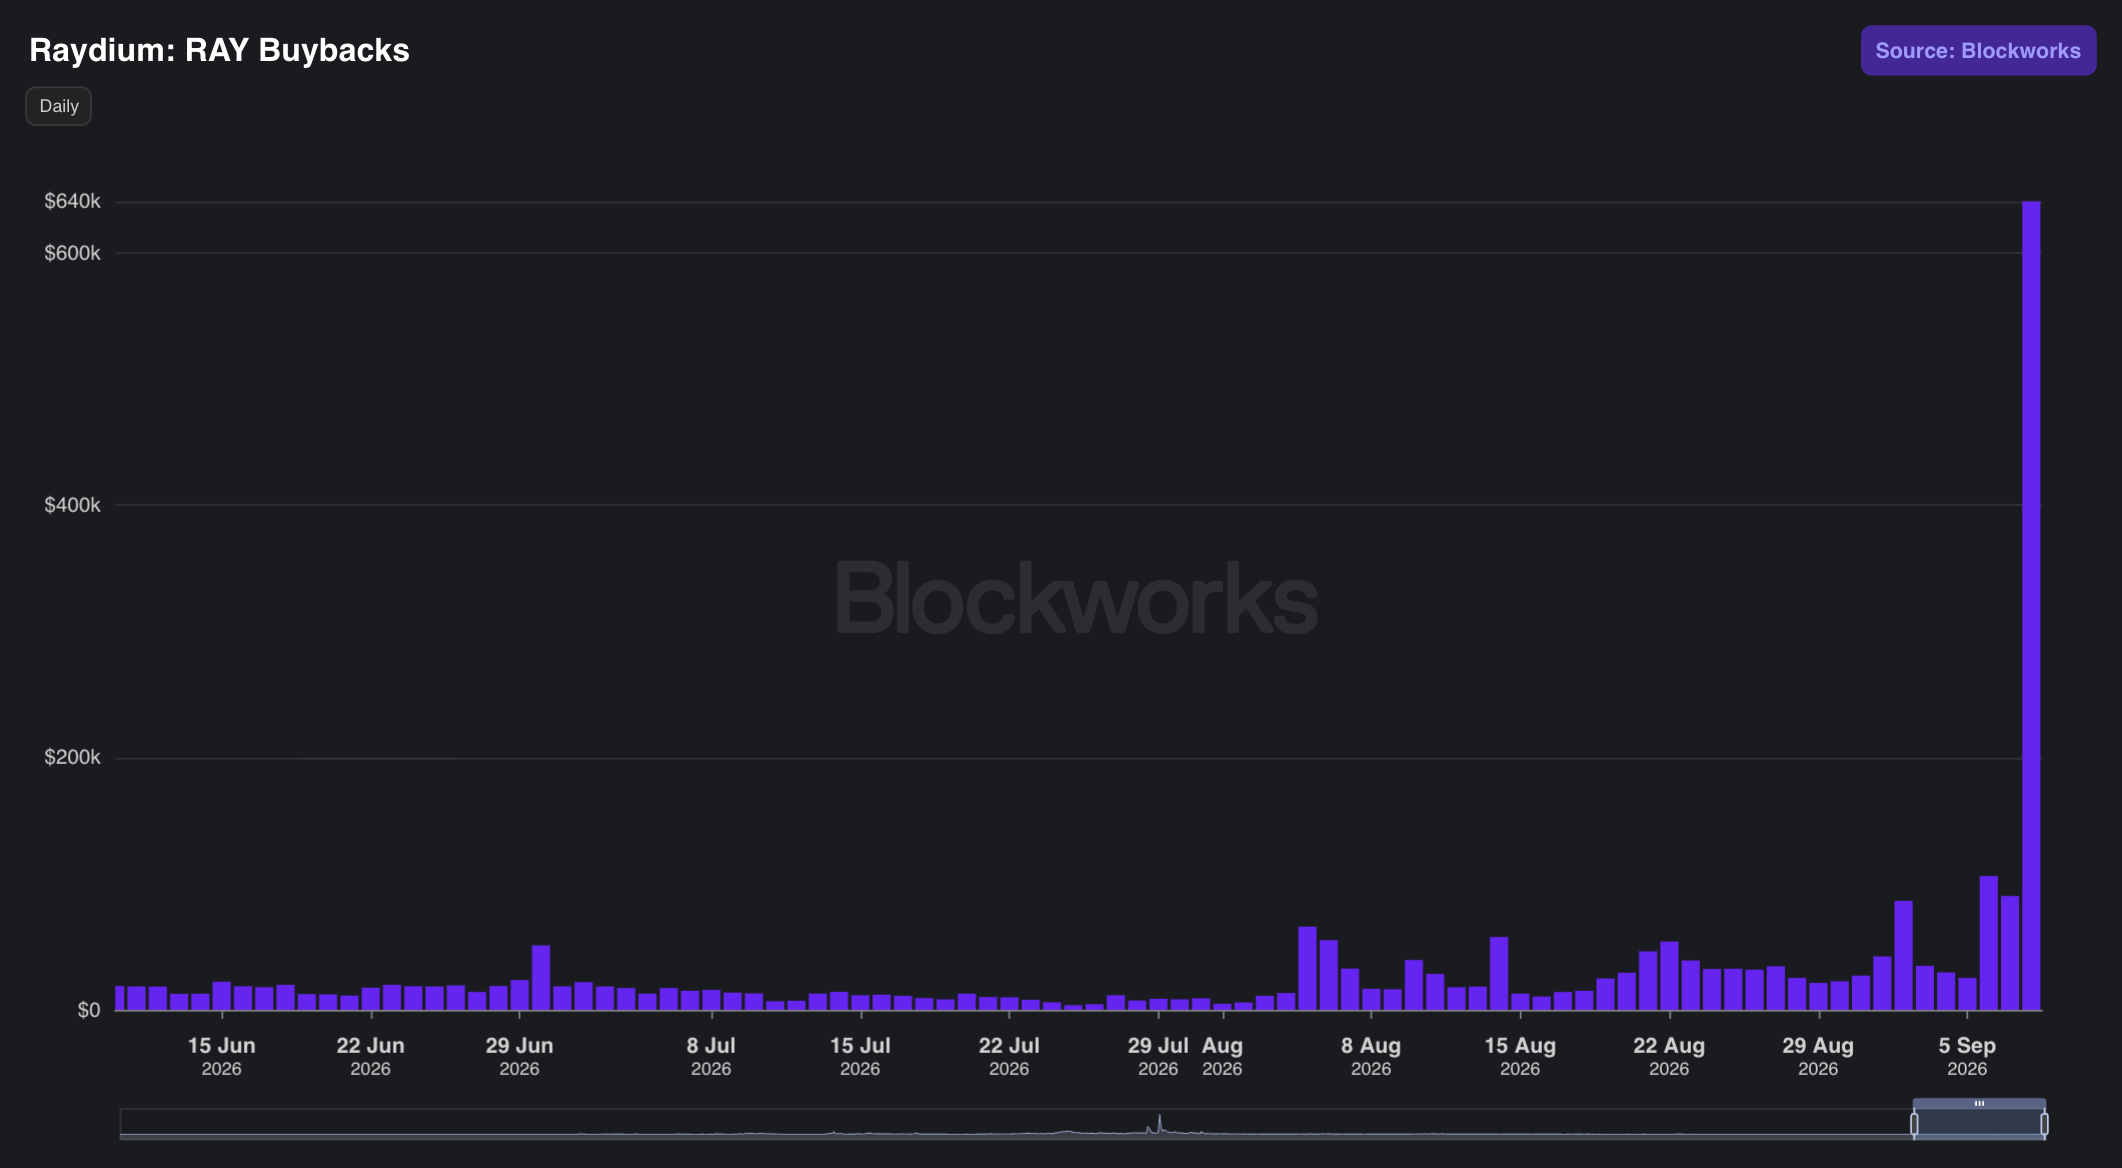
In addition, Raydium bought back $640,788 worth of RAY tokens on Wednesday, the largest buyback to date, bringing the cumulative buyback to $2.1 million. Typically, buybacks reduce the circulating supply, artificially inflating the token price as long as demand holds.
Technical outlook: Raydium eyes $1.50 breakout
Raydium holds well above $1.3500 at press time on Thursday, testing the bullish breakout of the $1.2900 supply zone. The DEX token holds well above the 50-, 100-, and 200-day Exponential Moving Averages (EMAs), reinforcing a strong bullish near-term bias.
From a technical perspective, RAY must confirm the bullish breakout of the December 4 high at $1.2910 for a sustained recovery. The Fibonacci retracement over the previous downswing from $1.2910 to the June 6 low at $0.5330 projects the 127.2% Fibonacci extension at $1.4917, close to the $1.50 psychological threshold as the next bullish target.
Momentum remains firmly positive as the Relative Strength Index (RSI) hovers deep in overbought territory near 81 on the daily chart and the Moving Average Convergence Divergence (MACD) line stays above its signal line with an expanding positive histogram, hinting that upside pressure persists even as conditions look increasingly stretched.
On the downside, initial support is seen at the recent Fibonacci swing high around the 100% retracement at $1.2910, with a deeper pullback exposing the 78.6% retracement at $1.1287 and the $1.00 round figure.
(The technical analysis of this story was written with the help of an AI tool. Know more.)
Nothing in this material constitutes investment advice, personal recommendation, investment research, an offer, or a solicitation to buy or sell any financial instrument. The content has been prepared without consideration of your individual investment objectives, financial situation, or needs, and should not be treated as such.
Past performance is not a reliable indicator of future performance and/or results. Forward-looking scenarios or forecasts are not a guarantee of future performance. Actual results may differ materially from those anticipated.
Mitrade makes no representation or warranty as to the accuracy or completeness of the information provided and accepts no liability for any loss arising from reliance on such information.
Recommended Articles


