



Pi Network Price Forecast: PI recovery trend faces headwinds near the $0.10 threshold
- Pi Network edges higher on Thursday, struggling to advance its recovery above the $0.10 threshold.
- Market sentiment and social chatter surrounding Pi Network weigh on recovery chances.
- The technical outlook for PI indicates an upside bias as momentum holds firm.
Pi Network (PI) edges higher on Thursday, extending its stalled recovery phase as buyers struggle to reclaim the $0.10 level. The broader cryptocurrency market's risk-on sentiment is moderating, while social chatter surrounding Pi Network remains muted, weighing on its extended recovery prospects. The technical outlook for PI remains bullish as upside momentum holds firm.
Weary market sentiment weighs on Pi Network
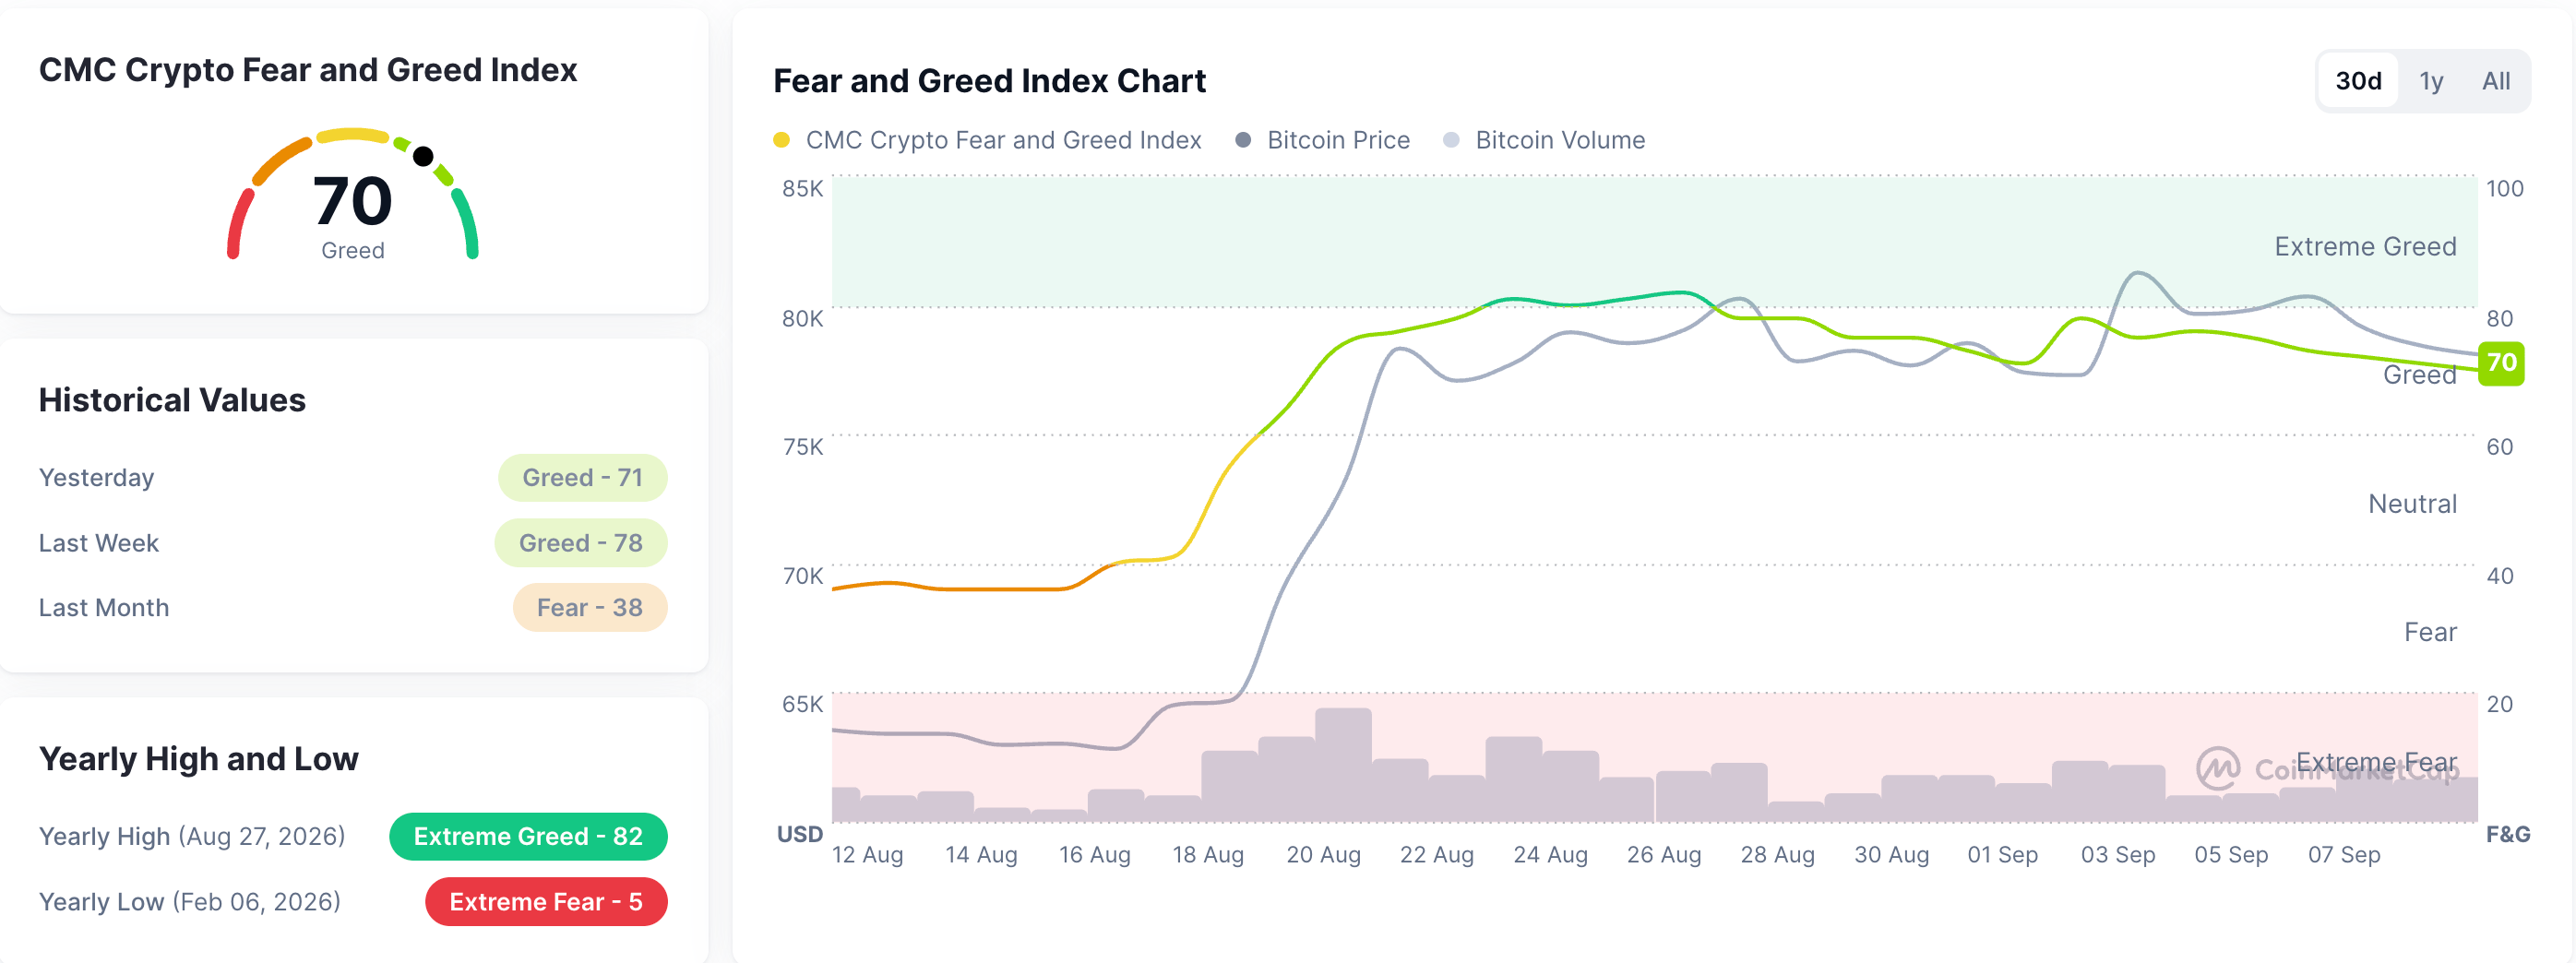
Pi Network struggles to extend its recovery as the broader market risk-on sentiment begins to fade. CoinMarketCap’s Fear and Greed Index shows a reading of 70 on Thursday, down from 78 last week, suggesting reduced bullish intent among crypto investors.
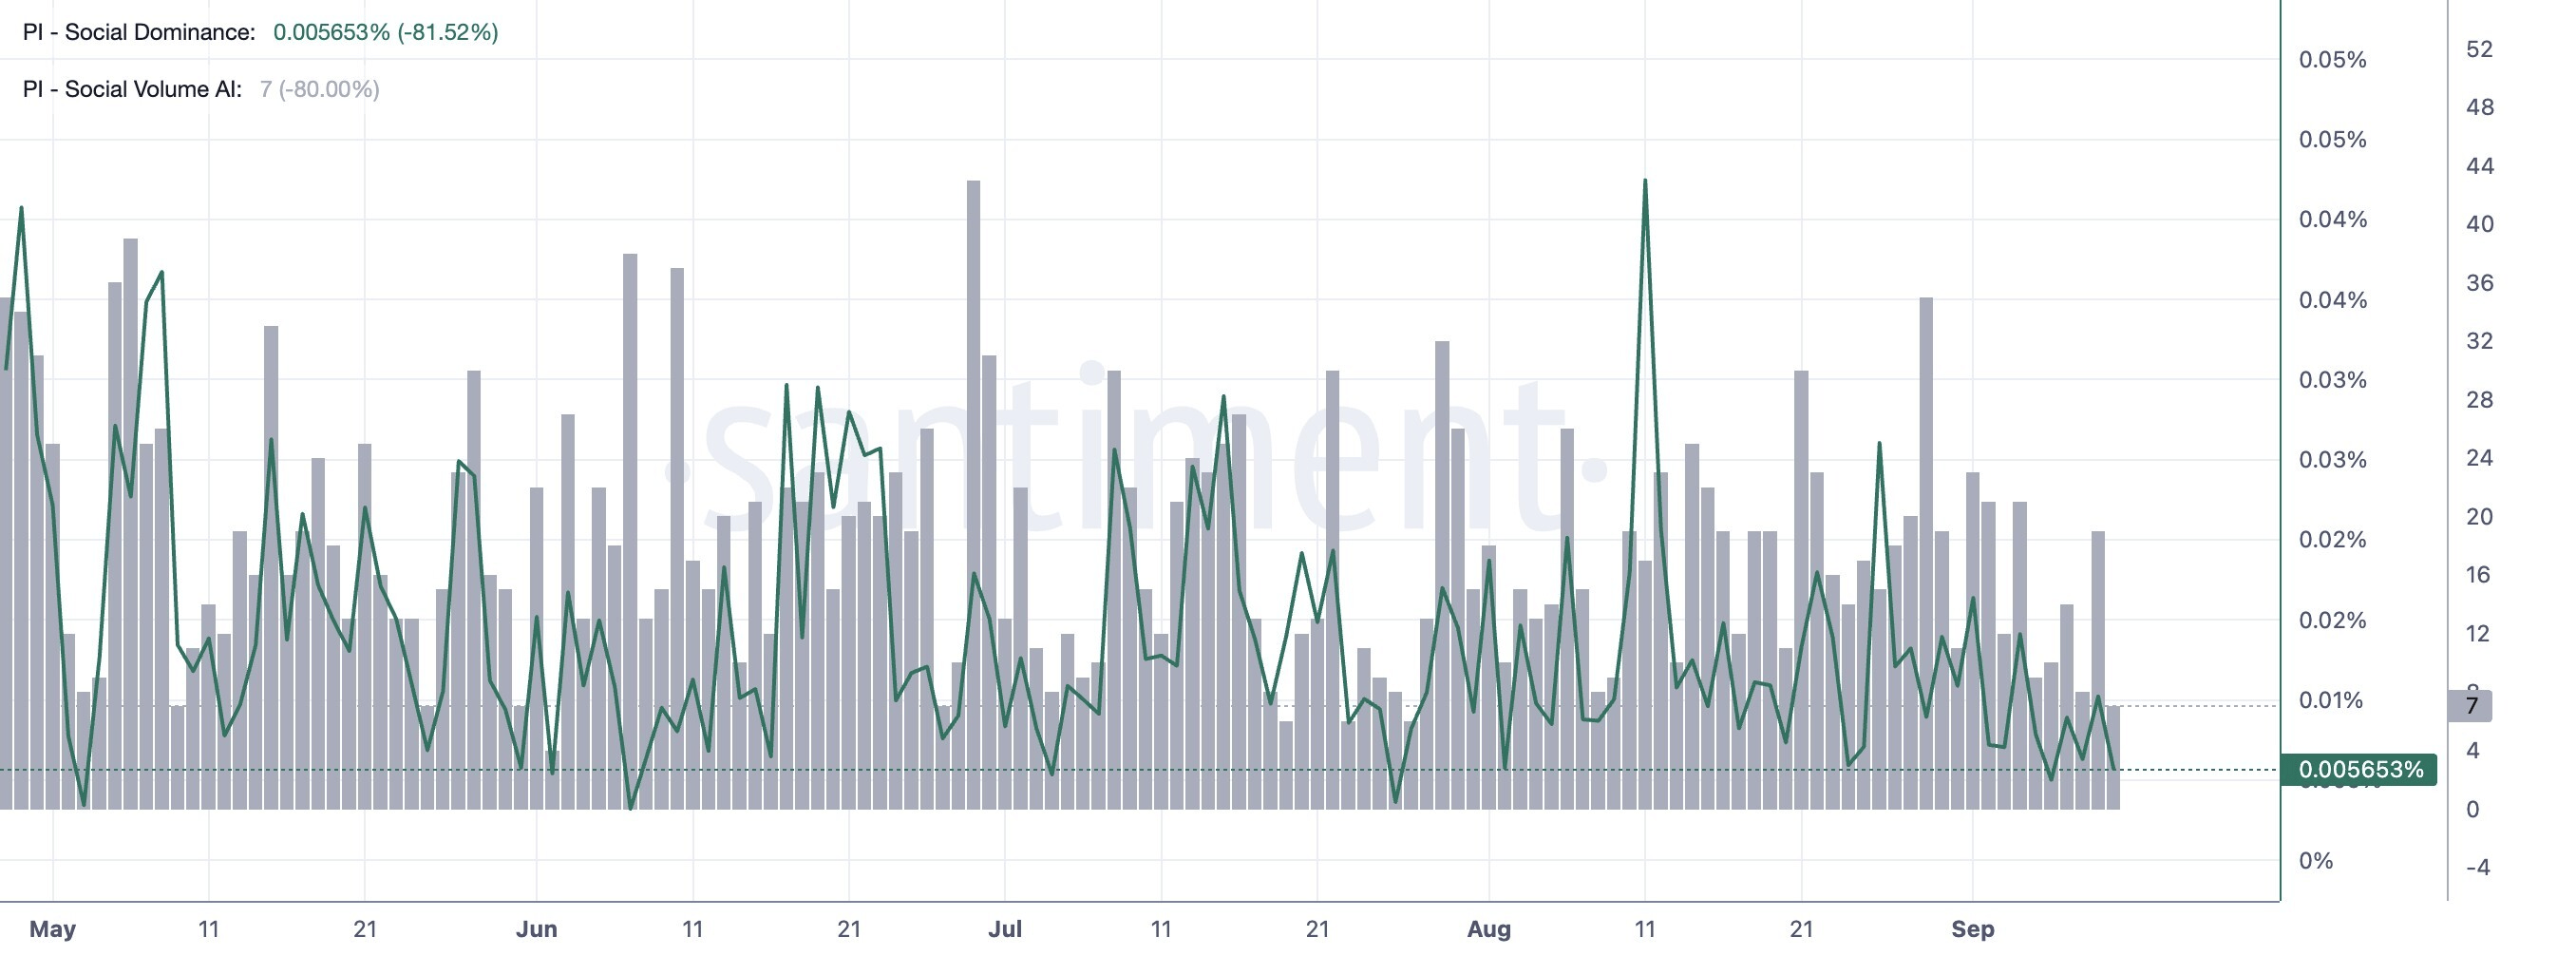
At the same time, the retail buzz surrounding Pi Network is muffled. Santiment data shows Pi Network’s Social Dominance and Volume 0.01% and 20 mention scores so far this week. The reduced broader market risk appetite and the declining share of Pi token in crypto-related discussions suggest that retail demand overlooks Pi Network.
Technical outlook: Is Pi Network ready for a bullish reversal?
Pi Network trades around $0.0963 at press time on Thursday, holding a neutral-to-slightly-bullish near-term tone. PI token sits above the 20-day and 50-day Exponential Moving Averages (EMAs) at $0.0934 and $0.0943, respectively.
Still, PI remains capped below the 50% retracement of the latest downswing from $0.1341 to $0.0703 at $0.0971, and the 100-day EMA at $0.1060, keeping the broader recovery in check. The Relative Strength Index (RSI) at around 57 on the daily chart maintains an upward slope, hinting at improving, though not yet aggressive, upside momentum.
A confirmed breakout above the $0.1000 level and the 100-day EMA at $0.1060 could open the path toward the 78.6% Fibonacci retracement level at $0.1168, followed by the $0.1341 swing high.
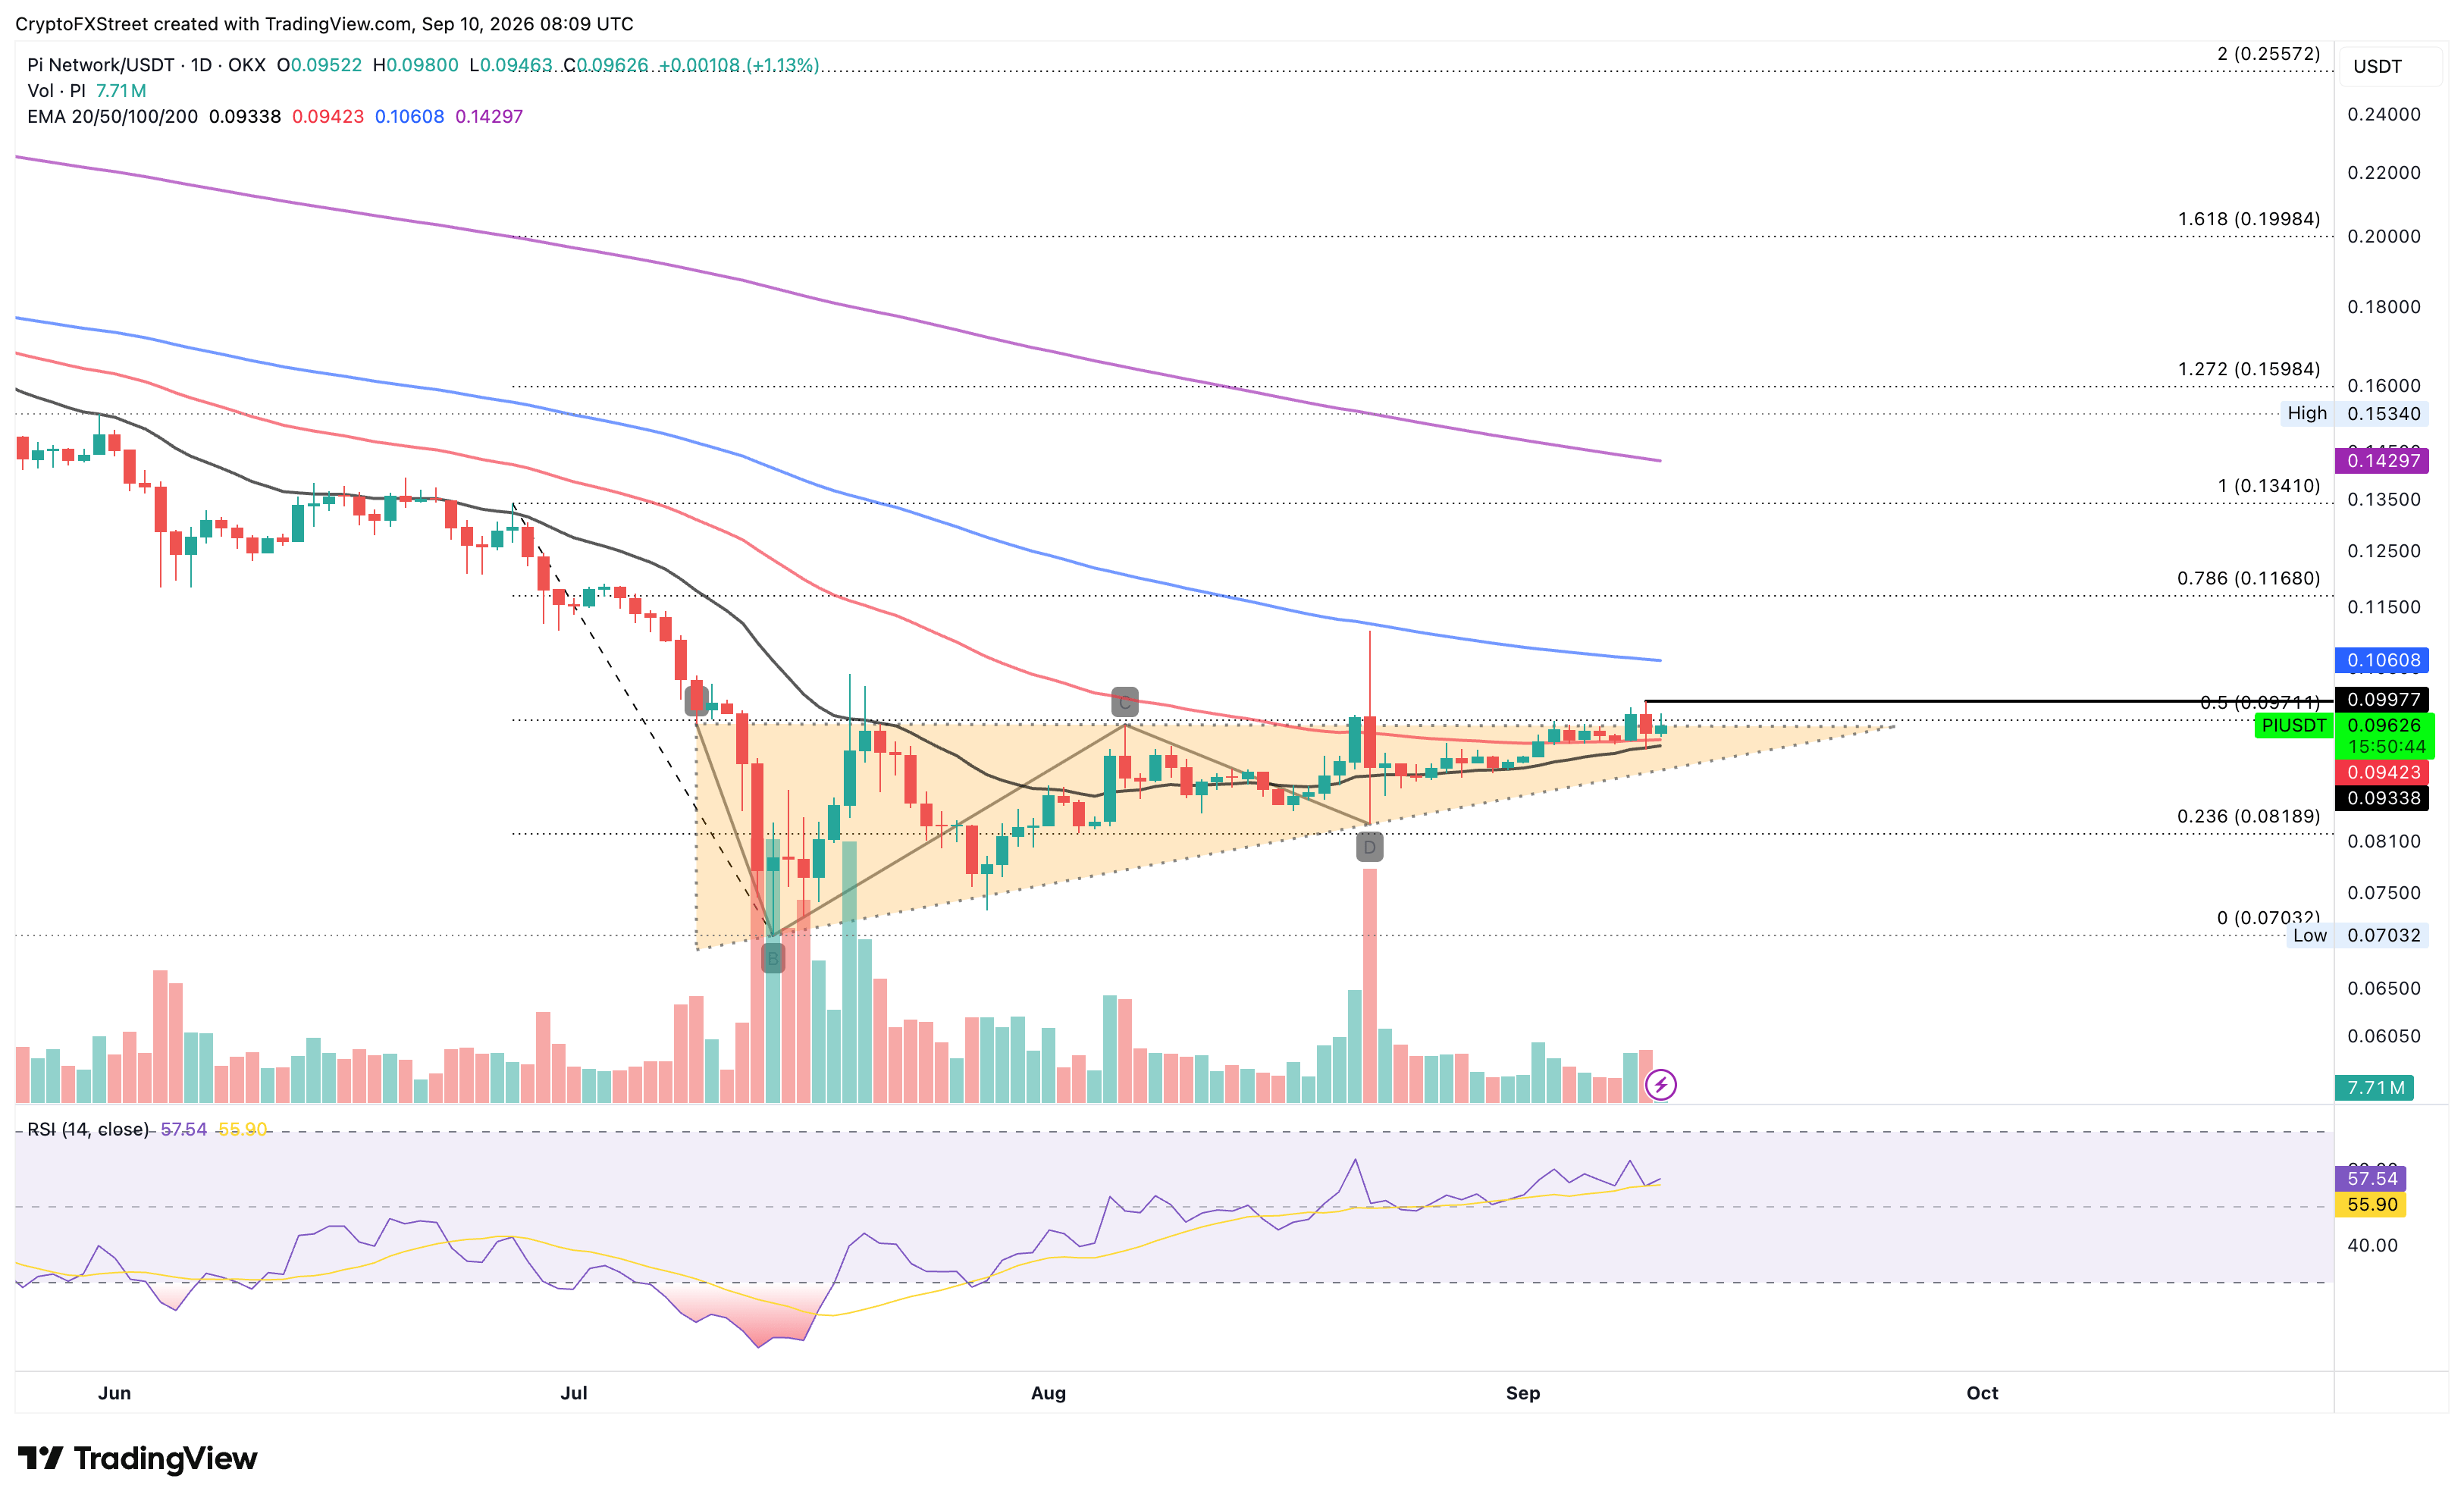
On the downside, initial support is clustered between the 50-day EMA at $0.0942 and the 20-day EMA at $0.0933, acting as the short-term floor. A break lower would expose deeper Fibonacci support at the 23.6% retracement near $0.0854 and the prior cycle low area around $0.0703.
(The technical analysis of this story was written with the help of an AI tool. Know more.)
Nothing in this material constitutes investment advice, personal recommendation, investment research, an offer, or a solicitation to buy or sell any financial instrument. The content has been prepared without consideration of your individual investment objectives, financial situation, or needs, and should not be treated as such.
Past performance is not a reliable indicator of future performance and/or results. Forward-looking scenarios or forecasts are not a guarantee of future performance. Actual results may differ materially from those anticipated.
Mitrade makes no representation or warranty as to the accuracy or completeness of the information provided and accepts no liability for any loss arising from reliance on such information.
Recommended Articles


