



Cardano Price Forecast: ADA bulls gain traction on Japan adoption deal
- Cardano rebounds, trading above $0.254 on Friday, holding strong above the 200-day EMA near $0.240.
- Cardano Foundation announced a strategic partnership with Pacific Meta on Thursday to accelerate enterprise blockchain adoption in Japan.
- Rising daily active addresses and positive funding rates support a bullish outlook.
Cardano (ADA) extends its rebound, trading above $0.254 on Friday after finding support around the key zone earlier this week. The bullish outlook strengthens as Cardano deepens its enterprise presence in Japan through a new partnership with Pacific Meta on Thursday. Meanwhile, rising network activity and positive funding rates also support ADA’s near-term outlook.
Cardano expands enterprise adoption in Japan
Cardano Foundation announced a strategic partnership with Pacific Meta on Thursday to accelerate enterprise blockchain adoption in Japan.
“We’re partnering with Pacific Meta to combine Cardano infrastructure with local market expertise and enterprise integration, helping Japanese companies bring real-world blockchain use cases to life,” Cardano Foundation said on its X post.
This partnership highlights that Cardano is deepening its enterprise presence in Japan, suggesting a potentially bullish long-term outlook as adoption expands and utility grows.
Rising network activity and positive funding rates support ADA
Santiment’s Daily Active Addresses metric, which tracks network activity over time, paints a bullish outlook for Cardano. A rise in the metric signals greater blockchain usage, while declining addresses point to lower demand for the network.
In ADA’s case, Daily Active Addresses rose to 27,548 on Thursday from 15,588 the previous week and steadied around 26,800 on Friday. This suggests demand for Cardano’s blockchain is increasing, which bodes well for Cardano’s price.
 [09-1790917149713.17.10, 02 Oct, 2026].png)
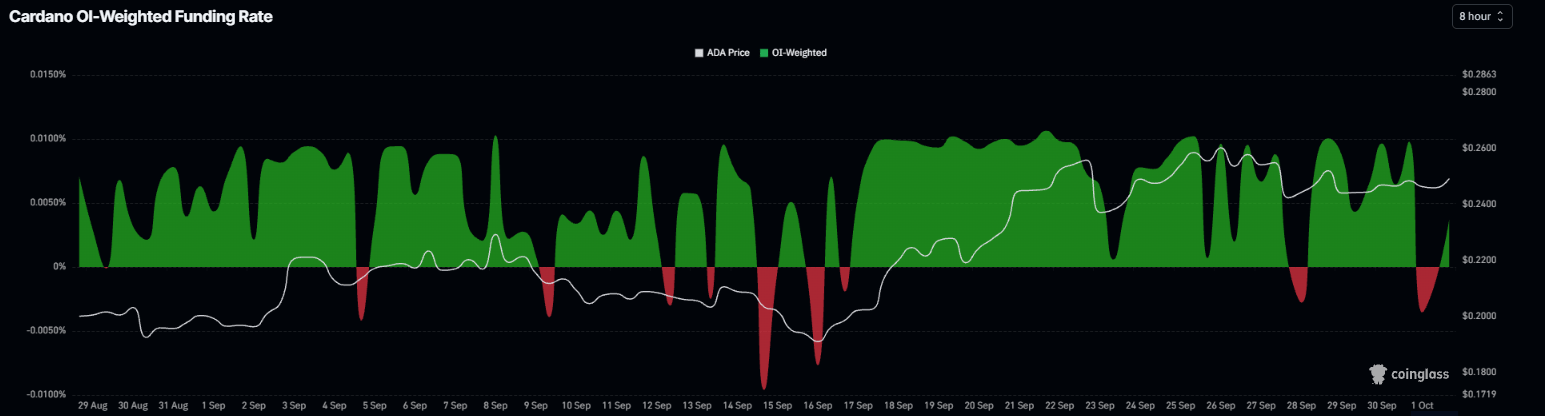
In addition, Cardano’s funding rate flipped positive on Thursday, reading 0.0037% on Friday. This indicates longs are paying shorts, reflecting a bullish outlook for Cardano.
Some signs of concern
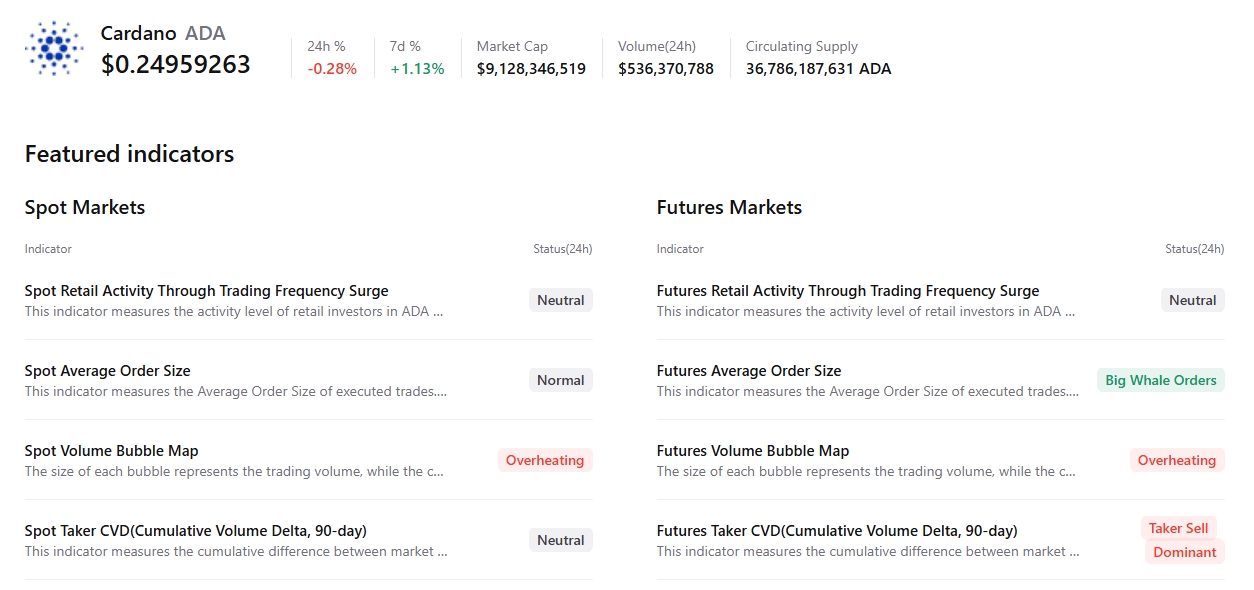
CryptoQuant’s summary data shows some signs of concern. ADA’s futures markets show large whale orders; however, they also show sell-side dominance and overheating conditions following its recent gains. In addition, spot markets show overheating conditions while other metrics remain neutral, highlighting a mildly bearish, cautious sentiment bias among Cardano traders.
Cardano technical outlook: ADA holds key support
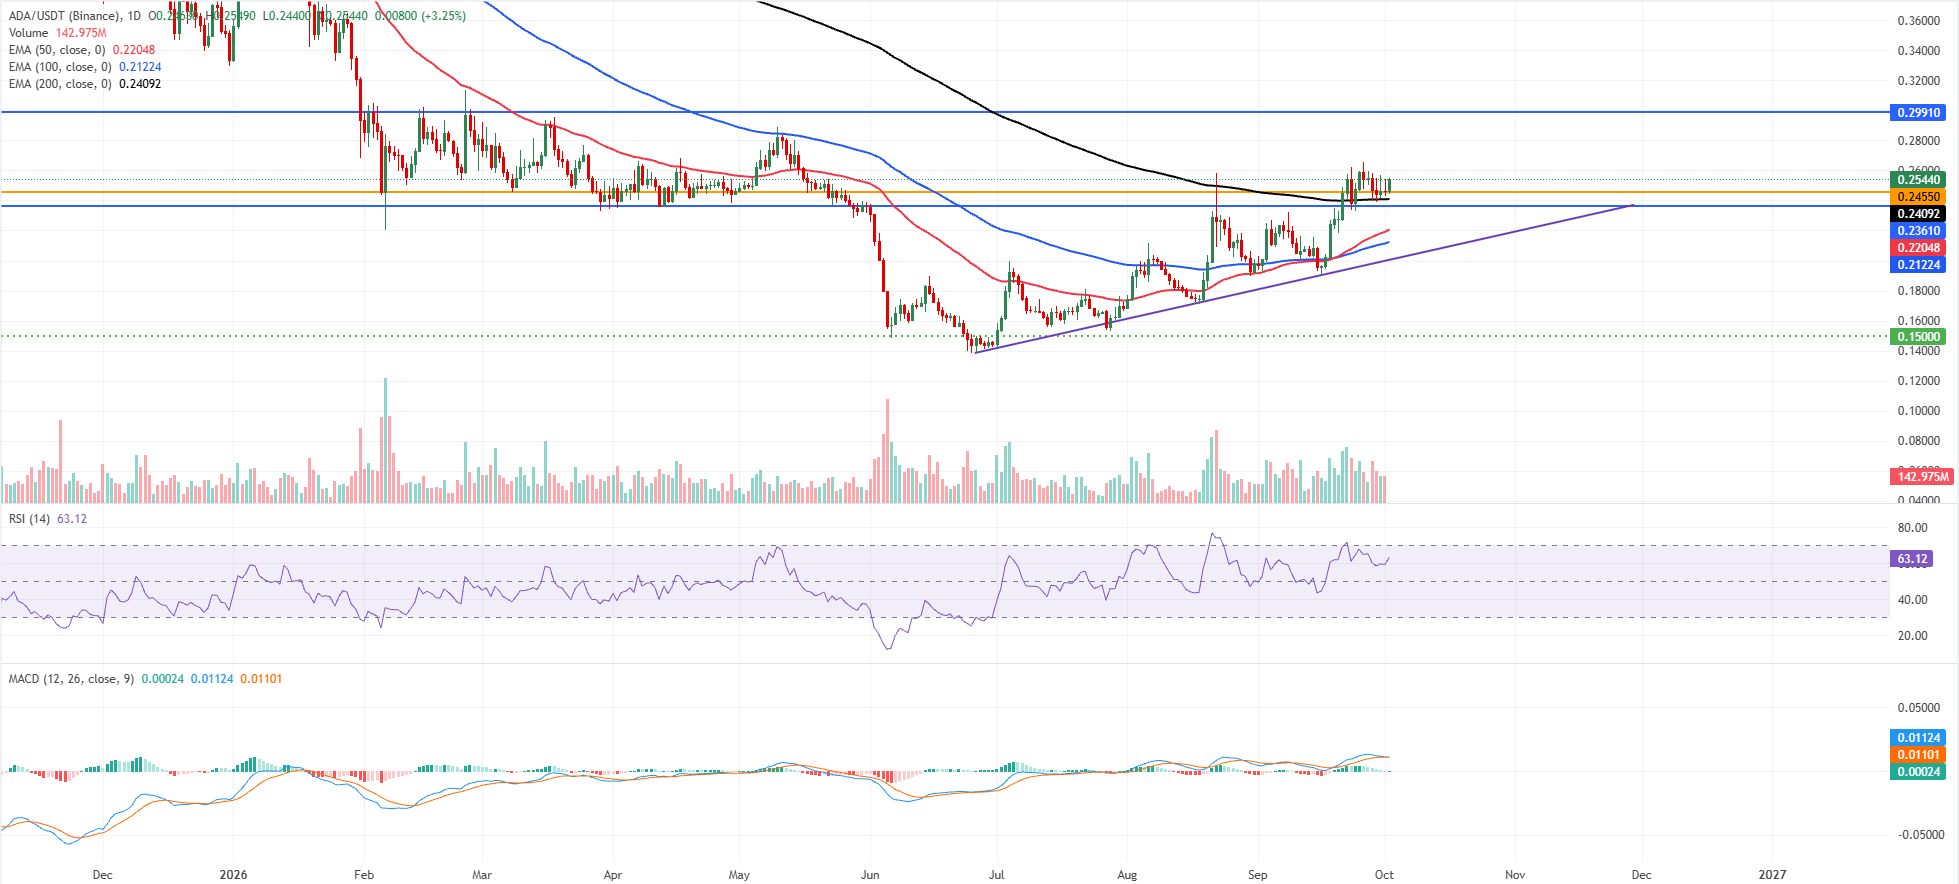
Cardano price trades at $0.254 on Friday, extending its advance above the key Exponential Moving Averages (EMAs). The 50-day EMA at $0.220, the 100-day EMA at $0.212 and the 200-day EMA at $0.240 all sit below the price, hinting at a constructive near-term bullish bias as the pair holds above the recent trendline break level at $0.200.
Momentum supports the upside, with the Relative Strength Index (RSI) hovering around 63, just outside neutral territory. At the same time, the Moving Average Convergence Divergence (MACD) remains slightly positive, suggesting that bullish pressure is still in play, albeit without aggressive follow-through.
On the downside, immediate support is seen at the horizontal floor at $0.245 and the 200-day EMA at $0.240. A deeper pullback would expose the next demand band at $0.236, ahead of dynamic support from the 50-day and 100-day EMAs at $0.220 and $0.212, with the former trendline break near $0.200 and the distant $0.150 level acting as a broader structural base.
On the topside, the next significant resistance is the horizontal barrier at $0.299, where bulls would need a decisive daily close to extend the current recovery phase.
(The technical analysis of this story was written with the help of an AI tool. Know more.)
Nothing in this material constitutes investment advice, personal recommendation, investment research, an offer, or a solicitation to buy or sell any financial instrument. The content has been prepared without consideration of your individual investment objectives, financial situation, or needs, and should not be treated as such.
Past performance is not a reliable indicator of future performance and/or results. Forward-looking scenarios or forecasts are not a guarantee of future performance. Actual results may differ materially from those anticipated.
Mitrade makes no representation or warranty as to the accuracy or completeness of the information provided and accepts no liability for any loss arising from reliance on such information.
Recommended Articles


