



Pi Network Price Forecast: PI risks another lower leg as the broader crypto market slips
- Pi Network edges lower on Thursday, retreating toward this month’s low around $0.0740.
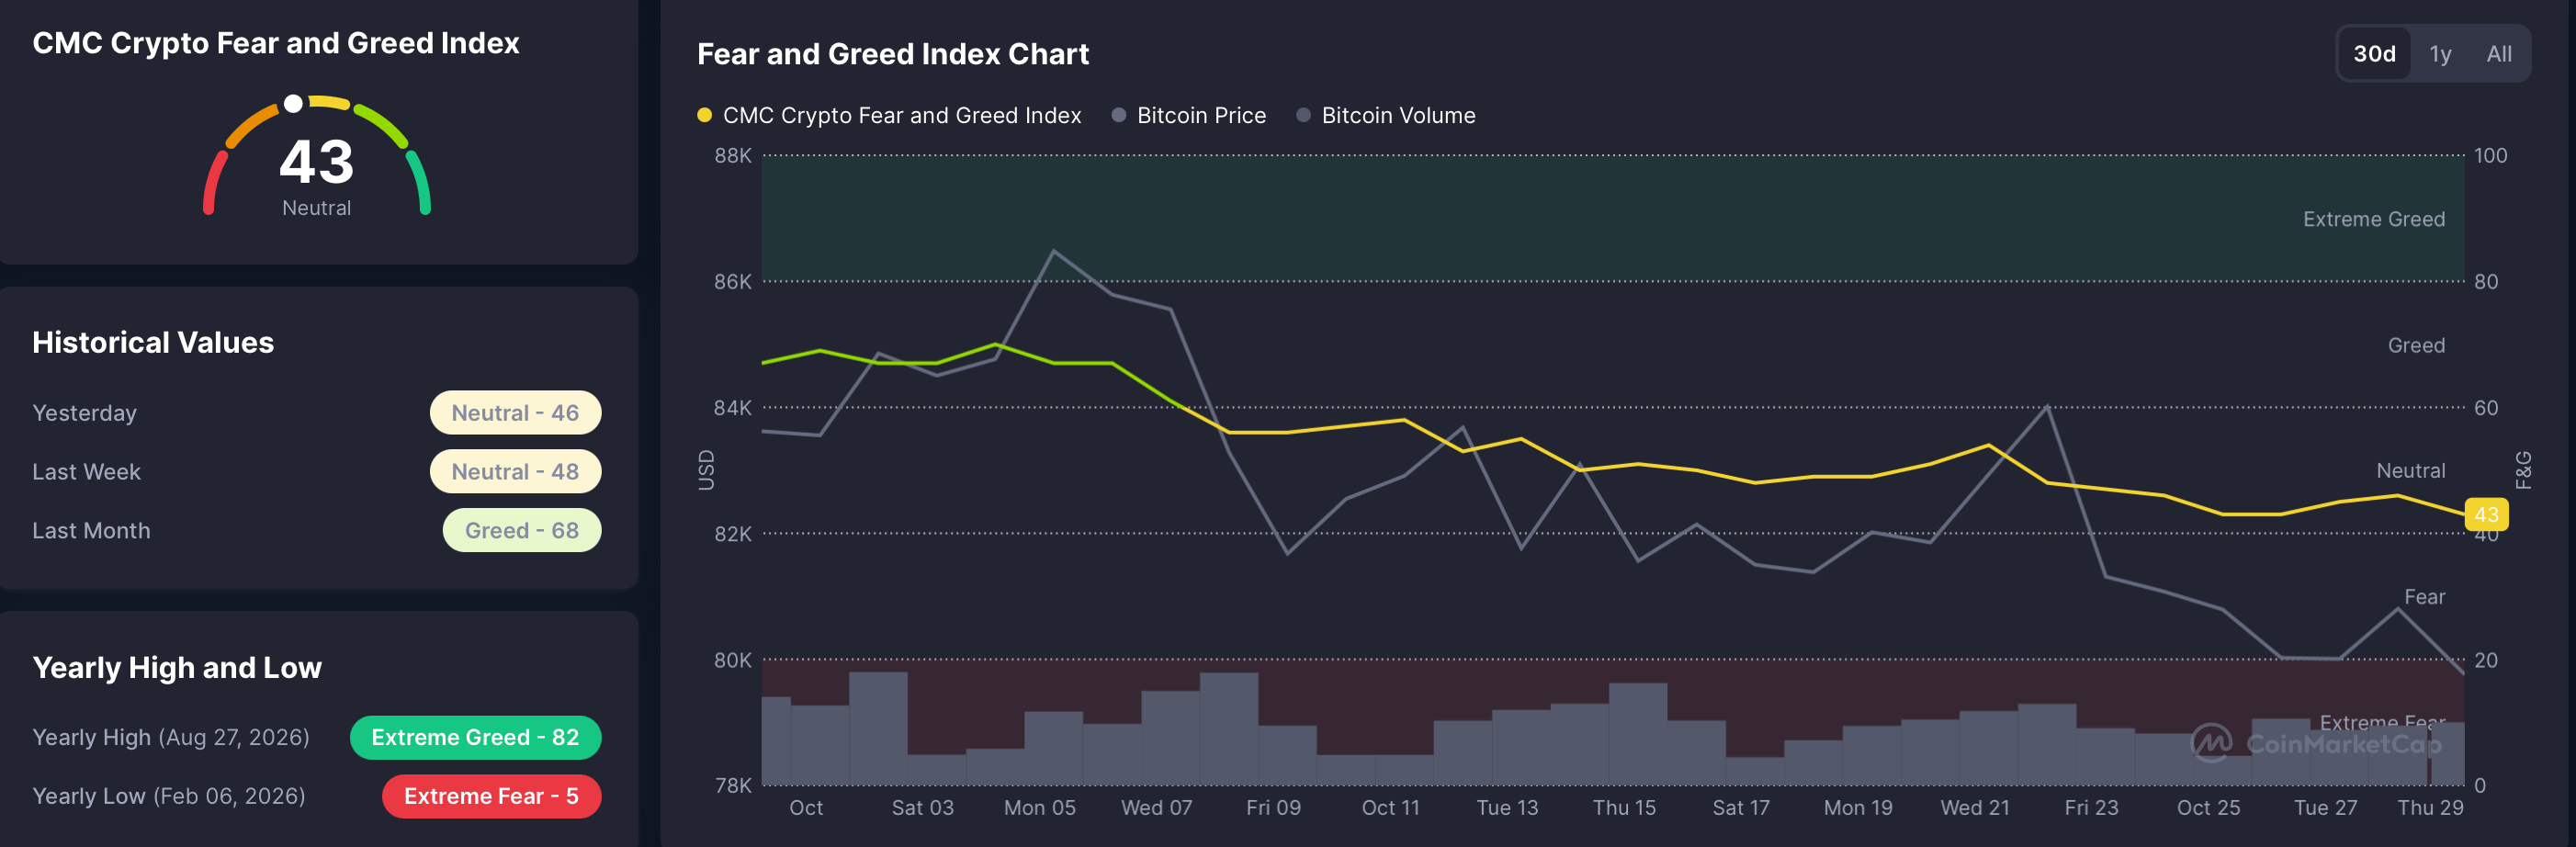
- The Fear and Greed Index declines to 43 on Thursday, suggesting a steady deterioration in investors' risk appetite.
- The technical outlook for PI indicates a further downward trend as selling pressure mounts.
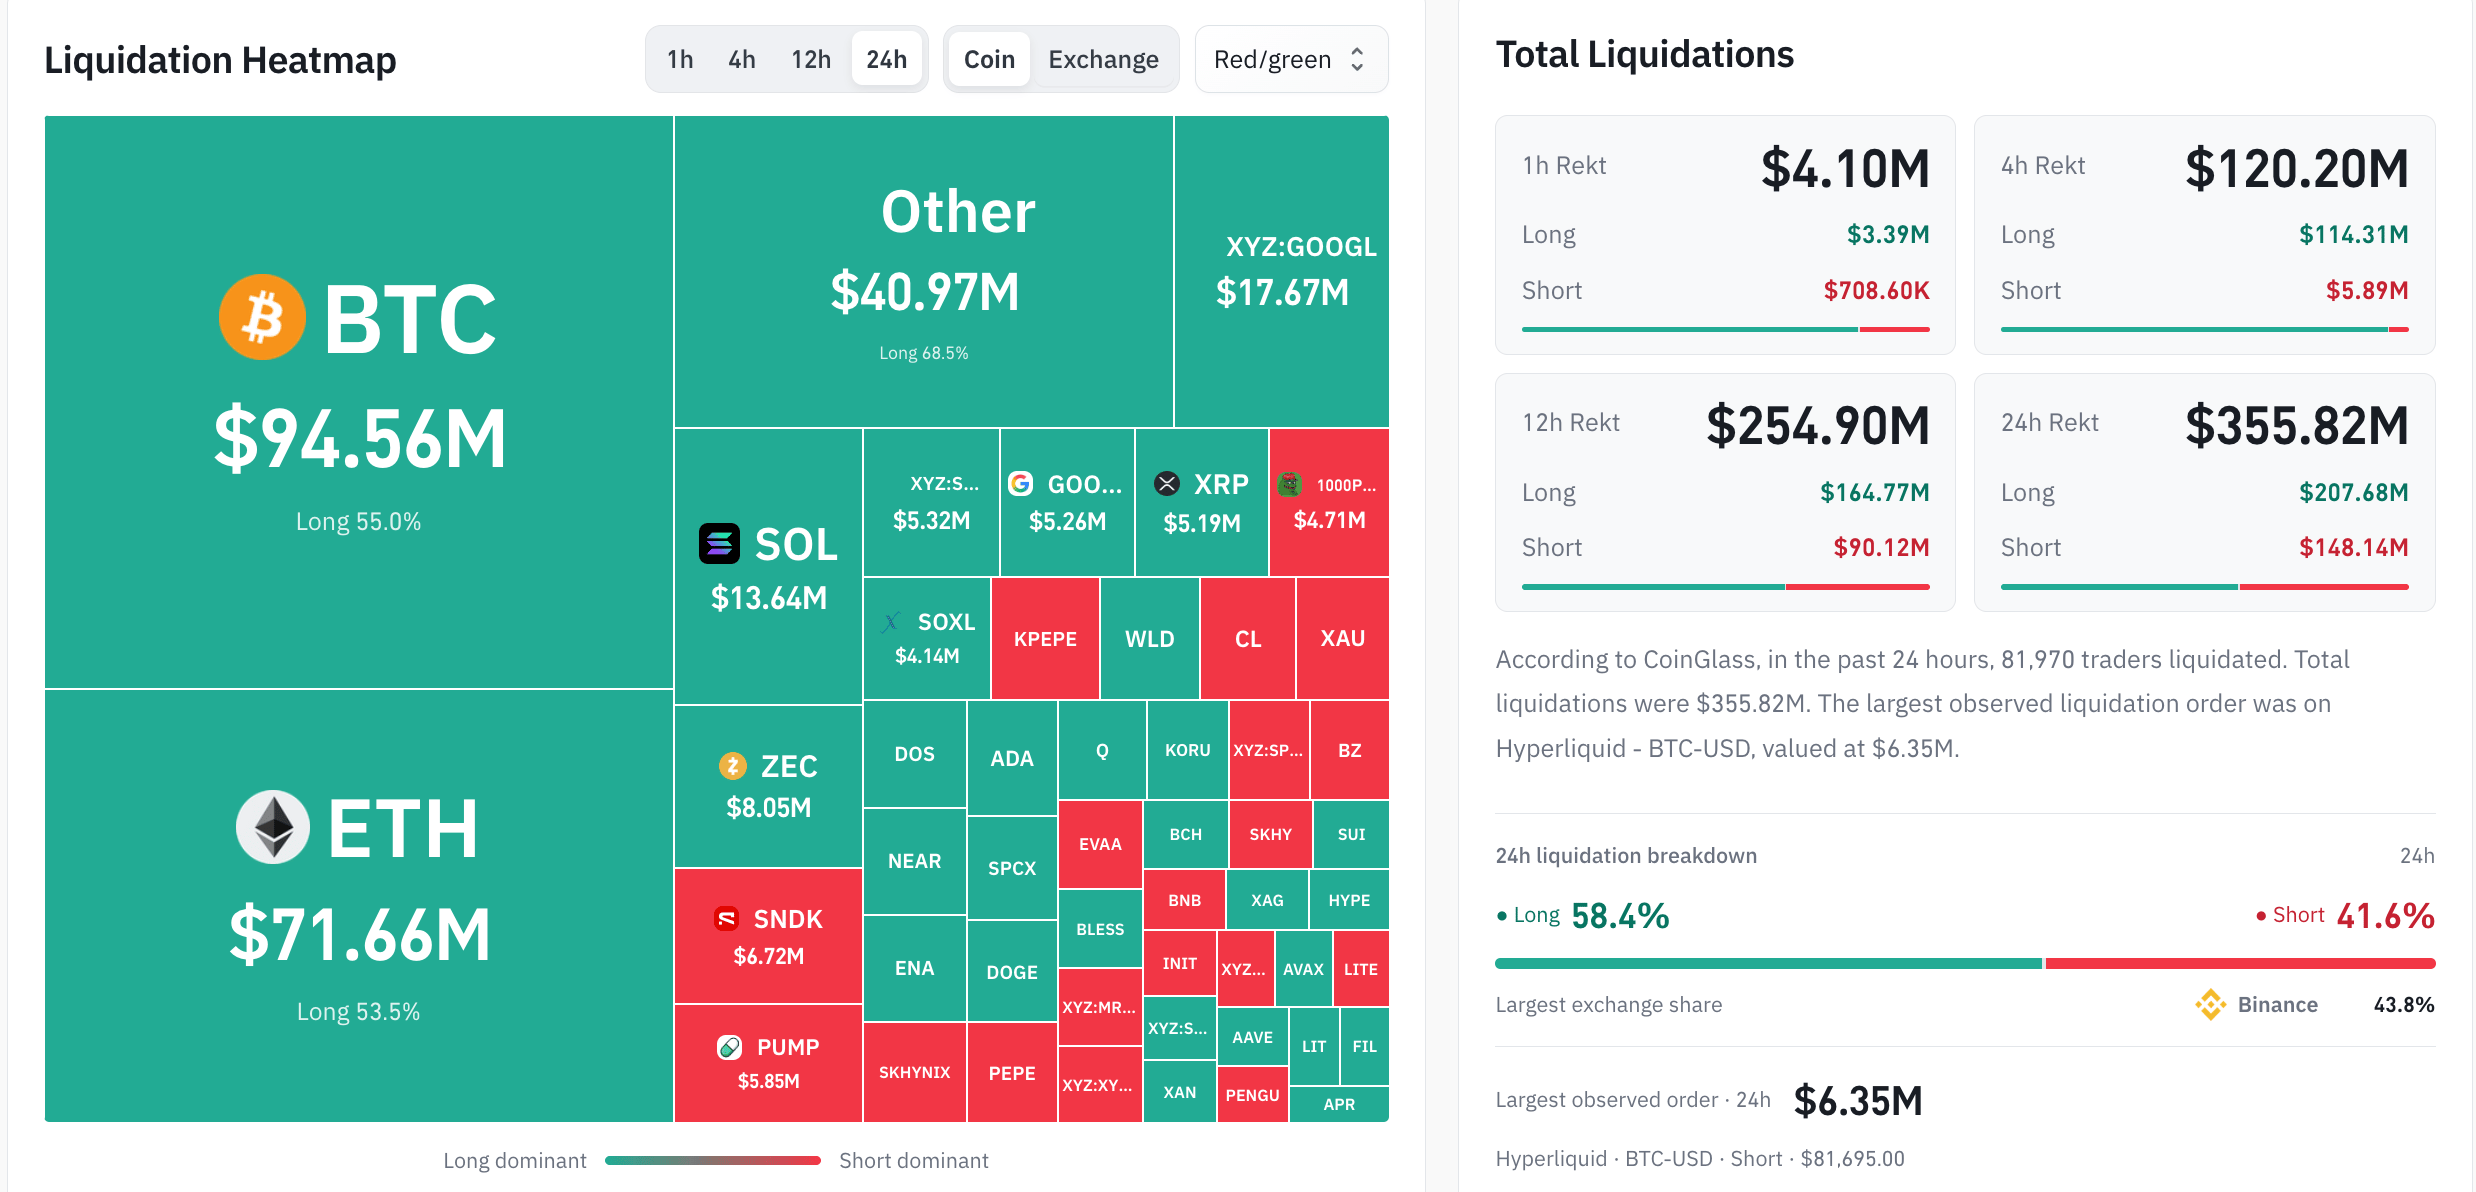
Pi Network (PI) is trading in the red on Thursday, retreating toward a near-term support around $0.0740. The Fear and Greed Index declines to 43 on Thursday, while total liquidations exceed $350 million over the last 24 hours, suggesting a deterioration in investors' risk appetite and a sell-side bias. The technical outlook for PI is bearish, with selling pressure building.
Broader market under stress
The broader cryptocurrency market saw increased selling pressure on Thursday, following the US Federal Reserve’s (Fed) decision to keep interest rates unchanged at 3.75%-4.00% the previous day. CoinGlass data shows $355 million in total liquidations over the last 24 hours, with $207 million in long liquidations, reaffirming a sell-side bias. Meanwhile, CoinMarketCap’s Fear and Greed Index drops to 43 on Thursday, from 48 last week, reflecting a steady decline in investors' sentiment.
Technical outlook: Pi Network extends decline as selling pressure mounts
Pi Network trades at $0.0754 at press time on Thursday, keeping a bearish near-term bias. The PI token is trading below both the 50-day Exponential Moving Average (EMA) at $0.0835 and the 200-day EMA at $0.1131, reaffirming the capped tone.
The price also remains below the descending trendline connecting the June 20 and August 22 highs, near $0.0799. To reinstate an upward trend, PI must surpass the overhead cluster of the declining trendline near $0.0799 and the 50-day EMA at $0.0835, which could open the path toward the 50% retracement level of the downswing from $0.1394 to $0.0704, at $0.1049.
Momentum remains weak, with the Relative Strength Index (RSI) around 34, suggesting lingering downside pressure without a decisive oversold capitulation, and the Moving Average Convergence Divergence (MACD) flattens near the zero line, hinting at weak but ongoing bearish momentum.
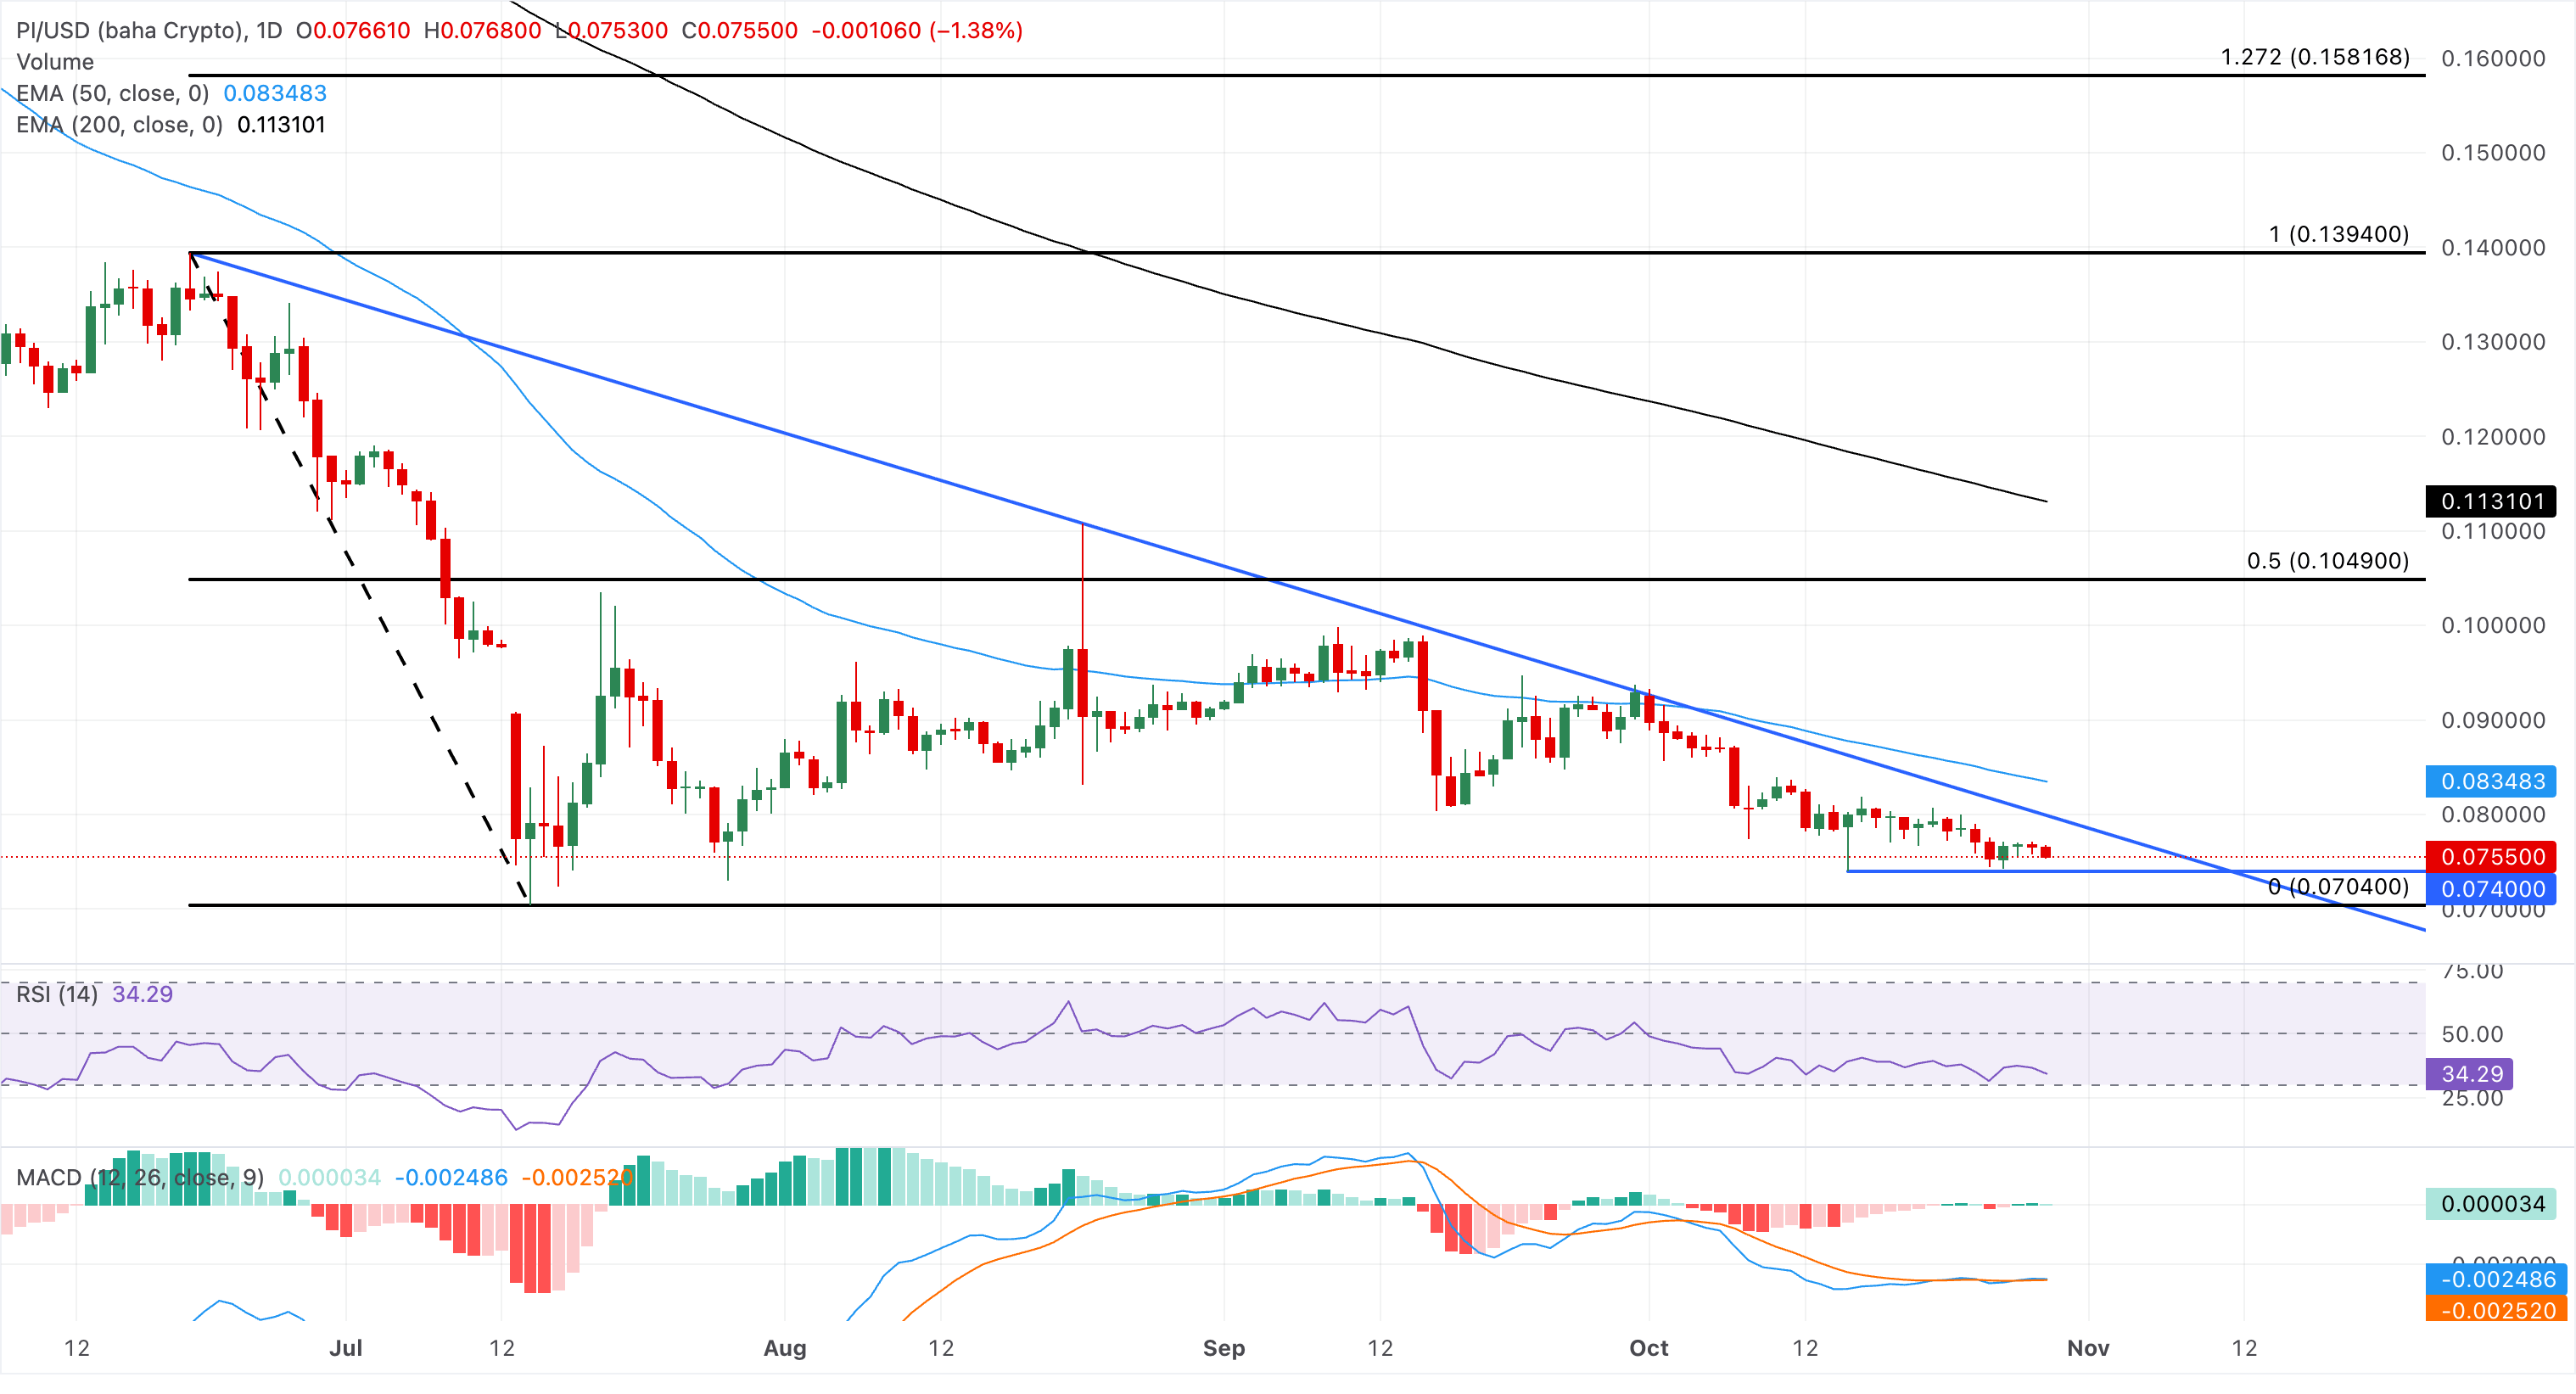
On the downside, the next notable support is the October 22 low at $0.0740, followed by the Fibonacci anchor at $0.0704, a break of which could open the door to a deeper extension of the current downtrend.
(The technical analysis of this story was written with the help of an AI tool. Know more.)
Nothing in this material constitutes investment advice, personal recommendation, investment research, an offer, or a solicitation to buy or sell any financial instrument. The content has been prepared without consideration of your individual investment objectives, financial situation, or needs, and should not be treated as such.
Past performance is not a reliable indicator of future performance and/or results. Forward-looking scenarios or forecasts are not a guarantee of future performance. Actual results may differ materially from those anticipated.
Mitrade makes no representation or warranty as to the accuracy or completeness of the information provided and accepts no liability for any loss arising from reliance on such information.
Recommended Articles


