



Dogecoin Price Forecast: DOGE risks further downside amid ETF outflows, long unwinding
- Dogecoin stalls around $0.075 on Friday after losing over 5% the previous day.
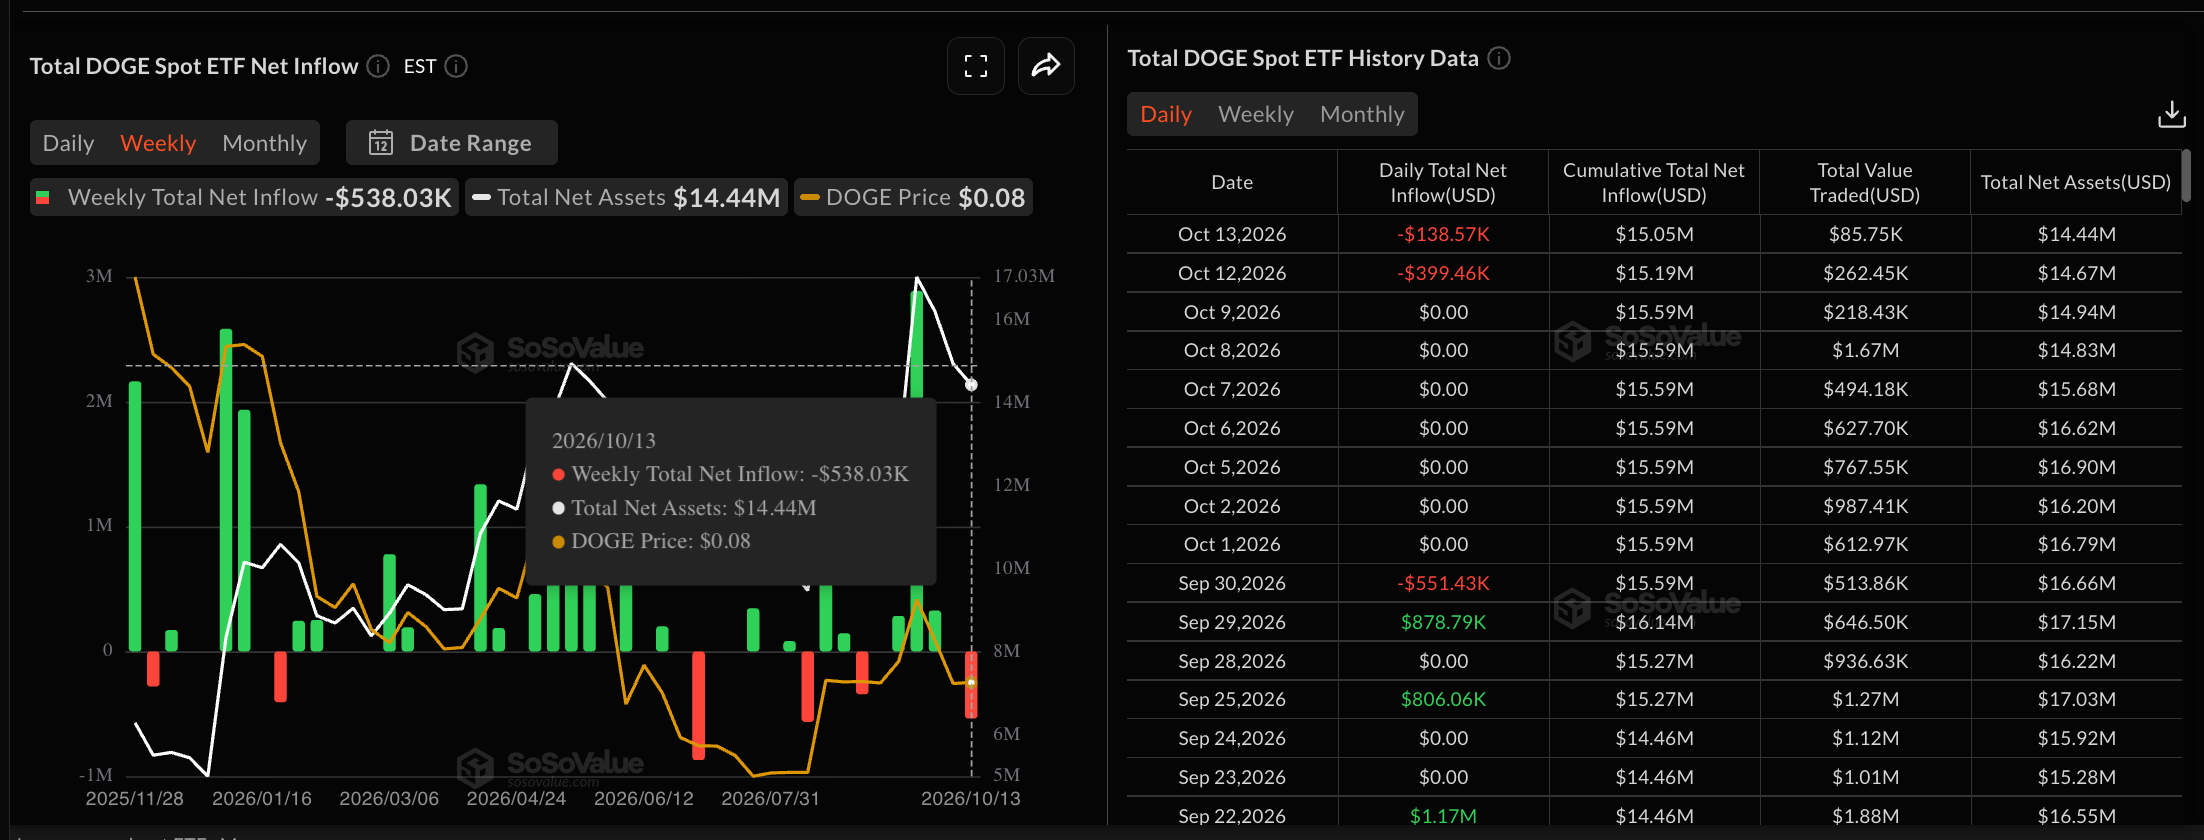
- DOGE-focused ETFs recorded their second consecutive daily outflows of $138,570 on Thursday, suggesting reduced demand from institutional investors.
- Derivatives data indicate a sell-side bias, with Open Interest down 5% over the past 24 hours amid heavy long liquidations.
Dogecoin (DOGE) price hovers around $0.0756 at press time on Friday, stalling further downside move after losing over 5% the previous day. The meme coin sees reduced demand at both institutional and retail levels, with Exchange Traded Funds (ETFs) outflows exceeding $500,000 this week and its futures Open Interest declining toward $1 billion. The technical outlook for DOGE indicates a bearish bias with a roughly 10% downside potential toward the annual low of $0.0676.
Dogecoin ETFs and futures face selling pressure
Dogecoin faces an uphill battle at both the retail and institutional levels. SoSoValue data shows DOGE ETFs recorded $138,570 in outflows on Thursday, following $399,460 the previous day, marking its second consecutive daily outflow and bringing the total outflow to $538,030 so far this week. Typically, such outflows indicate that institutional investors are redeeming ETF shares, implying either profit-taking or, in DOGE’s case, mounting pressure on holders to exit.
On the retail front, CoinGlass data shows that DOGE futures Open Interest (OI) is down over 5% in the last 24 hours to $1.05 billion, indicating a lower notional value of open positions as traders grow cautious amid broader market uncertainties. Typically, declining OI and spot price indicate a sell-side bias among traders, which could support the short- to medium-term corrections.
At the same time, total liquidations of $18.67 million, including long liquidations of $12.81 million in the same period, reaffirm the mounting bearish pressure on bullish positions, resulting in forced liquidations.

Technical outlook: Will DOGE price form another lower low?
Dogecoin stalls above $0.0750 at press time on Friday, recovering from a $0.0722 low earlier in the day. The meme coin maintains a bearish near-term tone below both the 50-day Exponential Moving Average (EMA) at $0.0833 and the 200-day EMA at $0.0922.
The Relative Strength Index (RSI) at 35 hovers near oversold territory on the daily chart, while the Moving Average Convergence Divergence (MACD) line remains below the signal line in the negative region, together hinting at downside momentum.
From a technical perspective, the meme coin has confirmed a bearish breakout of the $0.0776 horizontal support floor set by the June 6 low. This paves the way for the next meaningful support at the prior swing low around $0.0677, where a break would signal a deeper correction. Based on the Fibonacci retracement over the previous upswing from $0.0676 to $0.01058, the 127.2% and 161.8% extension levels at $0.0598 and $0.0513 could emerge as the next levels of support.
On the topside, initial resistance is clustered around the $0.0776 horizontal level, followed by the cluster formed by the 50-day EMA at $0.0833 and the 50% retracement level at $0.0846, which would need to be reclaimed to ease immediate selling pressure.
(The technical analysis of this story was written with the help of an AI tool. Know more.)
Nothing in this material constitutes investment advice, personal recommendation, investment research, an offer, or a solicitation to buy or sell any financial instrument. The content has been prepared without consideration of your individual investment objectives, financial situation, or needs, and should not be treated as such.
Past performance is not a reliable indicator of future performance and/or results. Forward-looking scenarios or forecasts are not a guarantee of future performance. Actual results may differ materially from those anticipated.
Mitrade makes no representation or warranty as to the accuracy or completeness of the information provided and accepts no liability for any loss arising from reliance on such information.
Recommended Articles


