


CFDs are complex instruments and come with a high risk of losing money rapidly due to leverage. 83% of retail investor accounts lose money when trading CFDs with this provider. You should consider whether you understand how CFDs work and whether you can afford to take the high risk of losing your money.

Pi Network Price Forecast: Post-US midterm elections market sell-off weighs on PI

Source Fxstreet
  • Pi Network hovers around $0.0750 on Friday, extending its prevailing downtrend capped by a long-term resistance trendline.
  • Total crypto market long liquidations exceeded $1 billion on Thursday as the post-election rally reversed amid a broader risk-off sell-off.
  • The technical outlook for PI remains bearish, with selling pressure persisting.

Pi Network (PI) continues to attract sellers, as the post-US midterm results triggered a sell-off in the US tech stock market and also wiped out over $1 billion from the crypto market. The declining trend in PI token risks forming a lower leg below its record low of $0.0704, with persistent selling pressure and faltering crypto market sentiment.

Post-US midterms weigh on the crypto market

The cryptocurrency market took a nosedive on Thursday, bleeding over $1 billion in long liquidations amid concerns that Democrats controlling the US Senate and House of Congress could lead to tighter crypto and AI regulations, as previously reported by FXStreet. In addition, CoinMarketCap’s Fear and Greed Index dropped to 31 on Friday, from 36 last week, suggesting persistent risk-off sentiment with a brief recovery on Tuesday, the day of midterm results. 

Typically, broader market uncertainty weighs down high-risk crypto assets, similar to PI. Investors looking for a relief rally might have to wait for political clarity in the US.
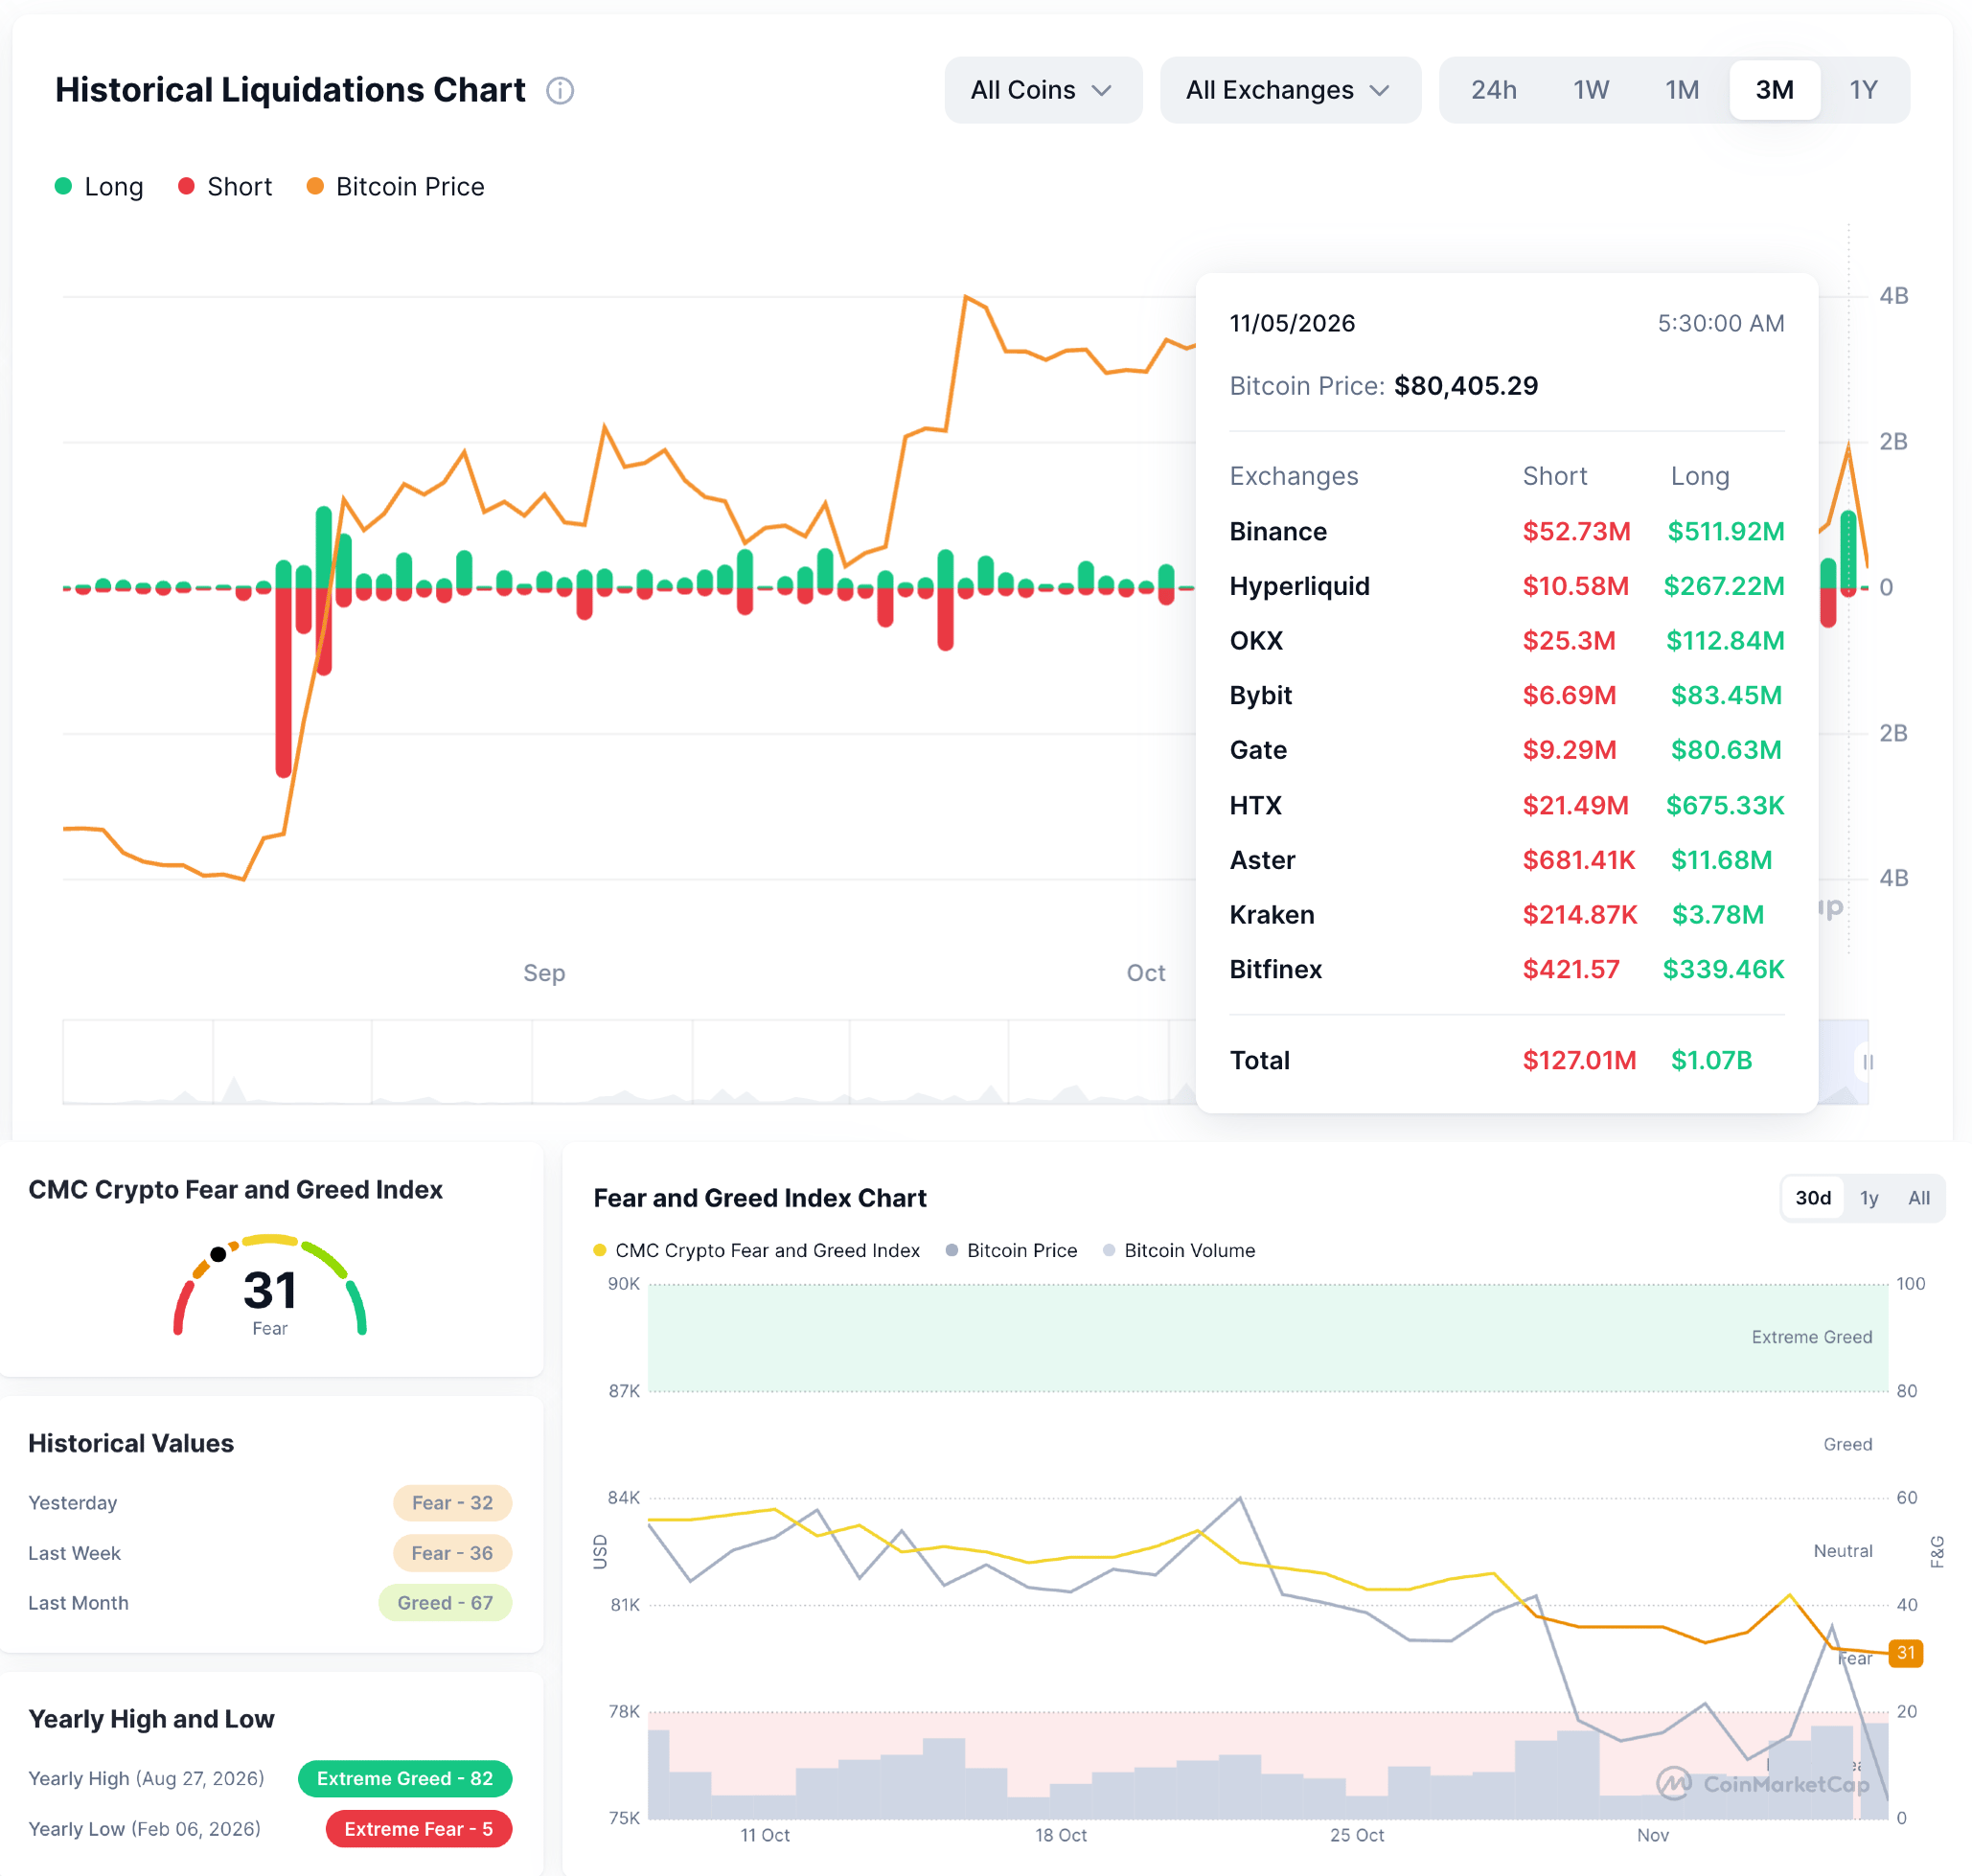
Liquidation chart and Fear and Greed Index. Source: CoinMarketCap

Technical outlook: Will PI defend its final support?

Pi Network trades around $0.0756 at press time on Friday, keeping a bearish near-term tone. PI sits well below the 50-day and 200-day Exponential Moving Averages (EMAs) at roughly $0.0817 and $0.1101, respectively.

The Moving Average Convergence Divergence (MACD) risks crossing below its signal line as the positive histogram wanes, while the Relative Strength Index (RSI) hovers near 37, hinting at fragile momentum and a move toward oversold levels.

Looking down, the only nearby structural support is the October 15 low at $0.0740, followed by the record low of $0.0704 set on July 14, where buyers may look to defend the current range if selling pressure resumes.

Chart Analysis PI/USD (baha Crypto)
PI/USD daily price chart.

On the topside, initial resistance appears near the trendline break area around $0.0770, followed by the 50-day EMA at $0.0817. Higher up, additional barriers are seen at the 50% retracement level around $0.1049, measured from $0.1394 to $0.0704, and the 200-day EMA at $0.1101.

(The technical analysis of this story was written with the help of an AI tool. Know more.)

Disclaimer: The content available on Mitrade Insights is provided for informational and marketing purposes only. It has not been prepared in accordance with legal requirements designed to promote the independence of investment research and is not subject to any prohibition on dealing ahead of the dissemination of investment research
Nothing in this material constitutes investment advice, personal recommendation, investment research, an offer, or a solicitation to buy or sell any financial instrument. The content has been prepared without consideration of your individual investment objectives, financial situation, or needs, and should not be treated as such.
Past performance is not a reliable indicator of future performance and/or results. Forward-looking scenarios or forecasts are not a guarantee of future performance. Actual results may differ materially from those anticipated.
Mitrade makes no representation or warranty as to the accuracy or completeness of the information provided and accepts no liability for any loss arising from reliance on such information.
placeholder
Crypto exchange Hashkey raises $206 million in Hong Kong IPO, source saysBy Kane Wu HONG KONG, Dec 15 (Reuters) - HashKey Holdings, Hong Kong's largest licensed crypto exchange, is set to raise about HK$1.6 billion ($206 million) after pricing its Hong Kong initial public offering at HK$6.68 a share, one source with direct knowledge said on Monday.HashKey launched...
Author  Reuters
Dec 15, 2025
By Kane Wu HONG KONG, Dec 15 (Reuters) - HashKey Holdings, Hong Kong's largest licensed crypto exchange, is set to raise about HK$1.6 billion ($206 million) after pricing its Hong Kong initial public offering at HK$6.68 a share, one source with direct knowledge said on Monday.HashKey launched...
placeholder
USD/CHF ticks up to near 0.7900 as US Dollar edges higherThe USD/CHF pair edges up to near 0.7900 during the late Asian trading session on Monday. The Swiss Franc pair trades mildly higher as the US Dollar (USD) ticks up, with the US Dollar Index (DXY) rising to near 98.15.
Author  FXStreet
Dec 29, 2025
The USD/CHF pair edges up to near 0.7900 during the late Asian trading session on Monday. The Swiss Franc pair trades mildly higher as the US Dollar (USD) ticks up, with the US Dollar Index (DXY) rising to near 98.15.
placeholder
Aave Price Forecast: AAVE eyes bullish breakout as on-chain and derivatives data turns supportiveAave (AAVE) price hovers around $172 on Wednesday, nearing the upper trendline of the falling parallel channel pattern. A break above this technical pattern favors the bulls.
Author  FXStreet
Jan 07, Wed
Aave (AAVE) price hovers around $172 on Wednesday, nearing the upper trendline of the falling parallel channel pattern. A break above this technical pattern favors the bulls.
placeholder
Silver Price Forecasts: XAG/USD rises beyond $87.00 after a two-day selloffSilver (XAG/USD) shows moderate gains on Tuesday, trading at $87.05 at the time of writing. The white metal found some footing after plummeting more than 30% in the previous two trading days, hitting one-month lows right below the $72.00 line.
Author  FXStreet
Feb 03, Tue
Silver (XAG/USD) shows moderate gains on Tuesday, trading at $87.05 at the time of writing. The white metal found some footing after plummeting more than 30% in the previous two trading days, hitting one-month lows right below the $72.00 line.
placeholder
Euro zone short-dated yields set for weekly rise on Hormuz concernsBy Stefano Rebaudo April 24 (Reuters) - Euro zone short-dated government bond yields were headed for their biggest weekly rise in over a month as tensions around the Strait of Hormuz stoked inflation fears and European Central Bank rate hike expectations.Borrowing costs tracked oil prices, which ...
Author  Reuters
Apr 24, Fri
By Stefano Rebaudo April 24 (Reuters) - Euro zone short-dated government bond yields were headed for their biggest weekly rise in over a month as tensions around the Strait of Hormuz stoked inflation fears and European Central Bank rate hike expectations.Borrowing costs tracked oil prices, which ...
goTop
quote