



PLTR Stock Price Forecast: Q3 Earnings Drive Eight-Day Slide, Shares Risk Falling Toward $130
TradingKey - On November 2, Palantir (PLTR)'s latest earnings report continued to maintain rapid growth, but the stock price weakened continuously after the earnings release. On November 5, PLTR tumbled 9.73% to close at $154.99, marking its eighth consecutive trading day of declines, touching an intraday low of $152.60 with volume of approximately 50.38 million shares. Compared to its all-time high of $212.94 in mid-October, the stock has pulled back about 27% cumulatively.
Why Is PLTR Stock Falling?
Based on its latest earnings report, Palantir's third-quarter revenue reached $2.31 billion, up 96% year-over-year and exceeding market expectations of approximately $2.18 billion; U.S. commercial revenue surged 148% year-over-year to $984 million, surpassing its U.S. government business for the first time. Meanwhile, the company raised its fourth-quarter revenue guidance to between $2.649 billion and $2.653 billion and lifted its full-year revenue forecast to between $8.530 billion and $8.534 billion. Therefore, in terms of revenue, profit, and guidance, the earnings report itself remained well ahead of prior market expectations.
Notably, third-quarter U.S. commercial total contract value (TCV) grew by only 11% year-over-year, slowing significantly from 153% in the second quarter; overall TCV growth also decelerated from 49% in the prior quarter to about 6%. The company explained that certain sovereign AI projects were large in scale but had shorter contract durations, which weighed on TCV metrics; however, as a key indicator of future revenue, the slowdown in contract growth still raised investor concern.
On the other hand, high growth expectations had already been priced into PLTR ahead of the earnings release. Even after the recent pullback, the company's latest price-to-earnings ratio remained above 100 times, making the market sensitive to changes in revenue growth, bookings, and margins. With actual business performance continuing to expand rapidly, the share price decline reflects investors' heightened demands regarding the sustainability of future growth, rather than an abrupt deterioration in the company's current operating fundamentals.
Meanwhile, the broader market environment also amplified volatility. On November 5, the Nasdaq Composite Index fell more than 5% as the market reassessed Big Tech's AI capital expenditures and return on investment, putting broad pressure on high-valuation AI-related stocks. As an AI software stock that had surged significantly over the past year, Palantir experienced even more pronounced volatility during this round of tech stock corrections.
PLTR Stock Price Technical Analysis
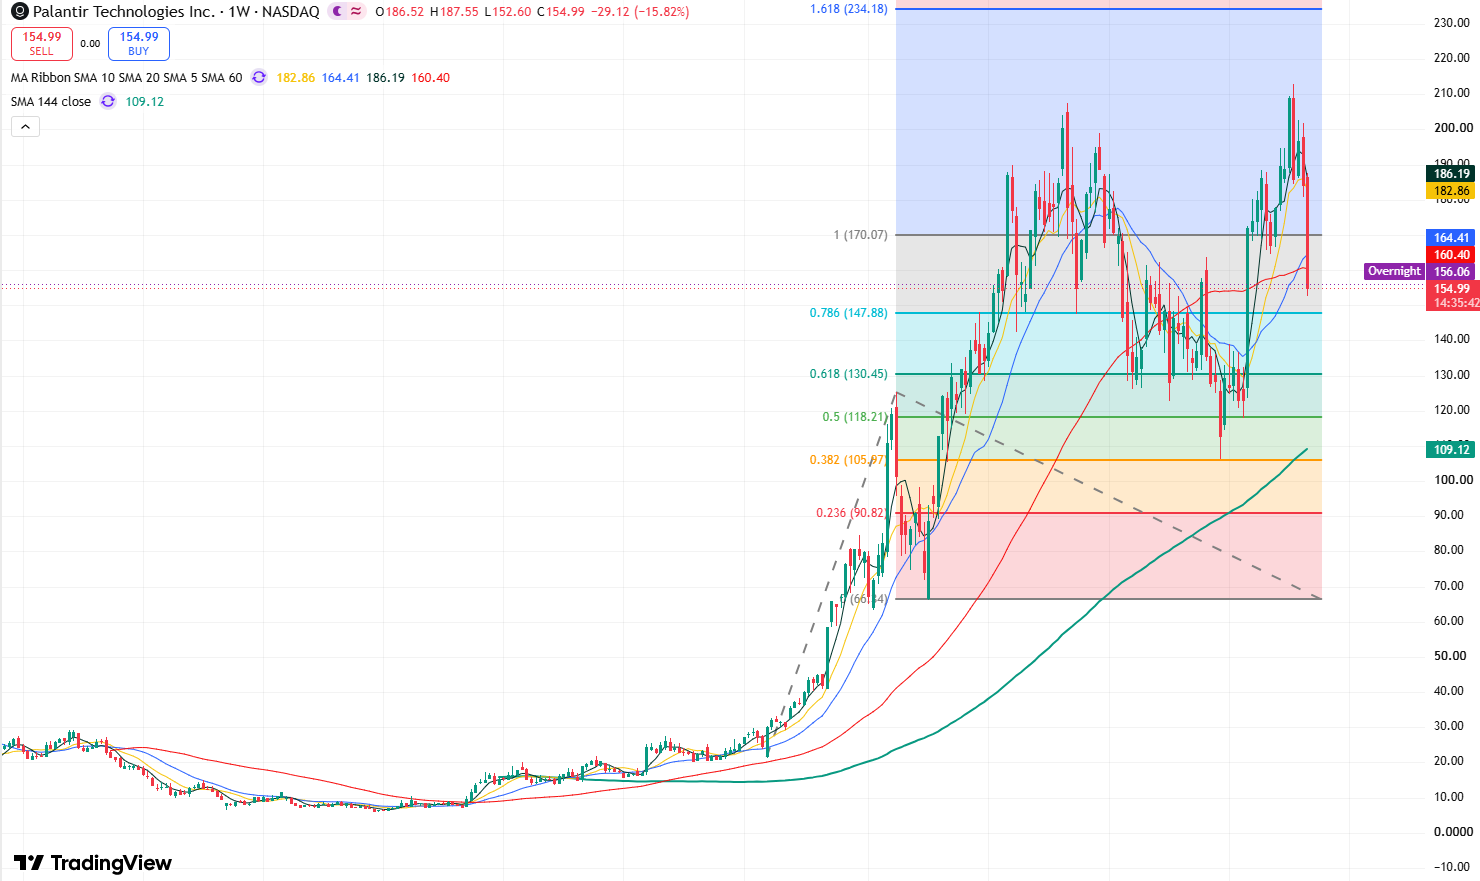
PLTR weekly stock chart, Source: TradingView
Looking at the weekly chart of PLTR, weighed down by broader market sentiment this week, intensified selling pressure is causing the stock to log a decline of over 15%. A long weekly bearish candlestick saw the price retreat sharply from above $180 and break below multiple key moving averages in succession, signaling that the medium-term uptrend structure has clearly entered a corrective phase.
In terms of moving averages, the 5-week moving average is currently around $186.19, the 10-week moving average is around $182.86, the 20-week moving average is around $164.41, and the 60-week moving average is around $160.40. The latest price has fallen below these key short- to medium-term moving averages. In particular, after key support at $165 was broken, this prior support has now turned into overhead resistance against short-term rebounds.
From a Fibonacci structure perspective, PLTR previously rallied from around $66.34 to $170.07 before entering a higher price range. It has now fallen back below the critical $170.07 level and is nearing the 0.786 retracement level at $147.88. Therefore, the $147–$150 zone serves as the primary support area to watch at present.
If $147.88 holds, the stock may initially consolidate around $150 and attempt to recover from this week's sharp decline. If the weekly chart confirms a break below $147, the next major support will shift downward to $130.45, corresponding to the 0.618 Fibonacci level; further below, attention turns to the 0.5 retracement level at $118.21. Over the long term, the 144-week moving average is currently located near $109.12, aligning with the $105.97–$109 range to form a deeper tier of support.
On the upside, overhead resistance first focuses on $165, where the 60-week moving average (around $160.40) and the 20-week moving average (around $164.41) represent the initial area the stock must reclaim during a rebound. If it can establish a firm footing above $165, the next overhead hurdle lies within the $170–$178 resistance zone.
Nothing in this material constitutes investment advice, personal recommendation, investment research, an offer, or a solicitation to buy or sell any financial instrument. The content has been prepared without consideration of your individual investment objectives, financial situation, or needs, and should not be treated as such.
Past performance is not a reliable indicator of future performance and/or results. Forward-looking scenarios or forecasts are not a guarantee of future performance. Actual results may differ materially from those anticipated.
Mitrade makes no representation or warranty as to the accuracy or completeness of the information provided and accepts no liability for any loss arising from reliance on such information.
Recommended Articles


