



Applied Materials Guides 30% Equipment Boom — But AMAT Rejected at $554.94 Before Earnings
TradingKey - Applied Materials (AMAT) remains within a significant range at $547.25 as the company approaches its 2026 third quarter earnings set to release after markets close on August 13 (in Asia time on August 14). Applied materials briefly traded above $560 before sellers stepped in. This reinforced $554.94 as the main resistance area buyers need to clear in order to continue the upside potential. The stock trading above both moving averages ($539.35 100 EMA, $534.73 50 EMA) and with RSI at 56 indicates positive upward pressure while the overall trend and momentum are sideways.
The fundamental outlook is also very positive with strong results for the second quarter reporting $7.91B of revenue at 50 percent gross margins, and $3.51 of GAAP EPS. For traders, $554.94 is a key level, and a break above this would target $582.85 and $613.67. For investors, they should wait to see if the 30 percent plus growth alloted for fiscal 2026 and the expectations for advanced packaging for fiscal 2027 are both met, as these are the main growth drivers for the company.
The Semiconductor Equipment Cycle Is Exceptionally Broad This Time
Applied Materials has a unique place in the AI-driven market compared to some of its peers such as NVIDIA and AMD. Instead of manufacturing AI processors, Applied Materials sells equipment used in manufacturing layers and offering material and engineering services for etching, inspecting, and assembling the advanced packaging for different types of logic, data, and high bandwidth memory devices.
This stock is an excellent ‘picks and shovels’ way to invest in AI infrastructure. Applied Materials will benefit from any of the major players in the advanced processing unit (APU) space growing market share. With the advent of more complicated manufacturing processes, increased AI infrastructure will motivate TSMC, Samsung, and SK Hynix to build out their advanced logic and packaging capabilities.
Q2 Was Record, Fiscal 2026 Guidance Remains 30%+ Growth
Applied Materials delivered very strong results for fiscal Q2. Revenue came in at $7.91 billion for the quarter, representing an 11% year-over-year increase. GAAP gross margin was 49.9%, resulting in operating income of $2.52 billion (31.9%). GAAP EPS was $3.51, and adjusted EPS was $2.86, beating expectations.
Post-Q2 results, management upgraded their expected growth of semiconductor equipment for fiscal 2026 from 'only' 30% to more than 30%, and they also upgraded their expected growth of advanced packaging from 'only' more than 50%. For this evening's earnings call, this may be the most significant number. If management preserves or upgrades these numbers, it may indicate that spending on semiconductor equipment related to AI is going to be a longer-term commitment, rather than a short-term peak in demand.
HBM and Advanced Packaging Are Driving Secular Growth
High bandwidth memory (HBM) continues to drive momentum. Highly sophisticated AI chips require far more bandwidth than typical application-specific integrated circuit. More bandwidth can be achieved by vertically stacking DRAM chips, which requires advanced packaging and through silicon vias (TSV). In the 2026-2027 fiscal years, HBM should be a substantial source of revenue for Applied.
Package Level Integration (PLI) is also crucial. Many of today’s AI chips dynamically integrate a combination of GPUs, CPUs, memory, and other functions in sophisticated, multi-chip packaging solutions. For Applied, 2026 PLI revenues should outpace the average 30%+ equipment industry growth by more than 50%.
Q3 Expectations: Revenue $9.04B, Adjusted EPS $3.36-$3.42
For Q3, consensus is that revenue will be $9.04B (approximately 25% higher than what was reported for the same period last year), with adjusted EPS falling in the range of $3.36-$3.42. Applied has provided a margin of $8.95B +/-$ 500M for revenue with an adjusted EPS of $3.36 +/- $0.20. Hitting these numbers would give continued evidence that these years will show continued growth from Q2 and would not show Q2 as a one-quarter spike.
China Remains the Biggest External Risk
U.S. restrictions on the export of specific advanced technologies make it challenging for Applied to sell equipment to Chinese customers. In addition, Chinese fabs are absorbing installed capacity and have significantly reduced purchases. Further restrictions could dramatically shrink the available market or even further delay licenses required for sales. For this call, confirming that the revenue mix outside of China is healthy and covering any potential shortfalls is critical.
Technical Setup: Rejected at $554.94, $534-539 EMA Support Holding
AMAT is still in consolidation after another rejection at the resistance zone at $554.94 on the 2-hour chart. The stock has already reached above the selling zone at $560, before the sell-offs. AMAT’s overall structure is bullish. Currently trading between the mid and lower level moving averages at $539.35 (100 EMA) and $534.73 (50 EMA) respectively, and as the moving averages are forming a bullish pattern, AMAT could find support at $547.25 after the break of the contextual price level.
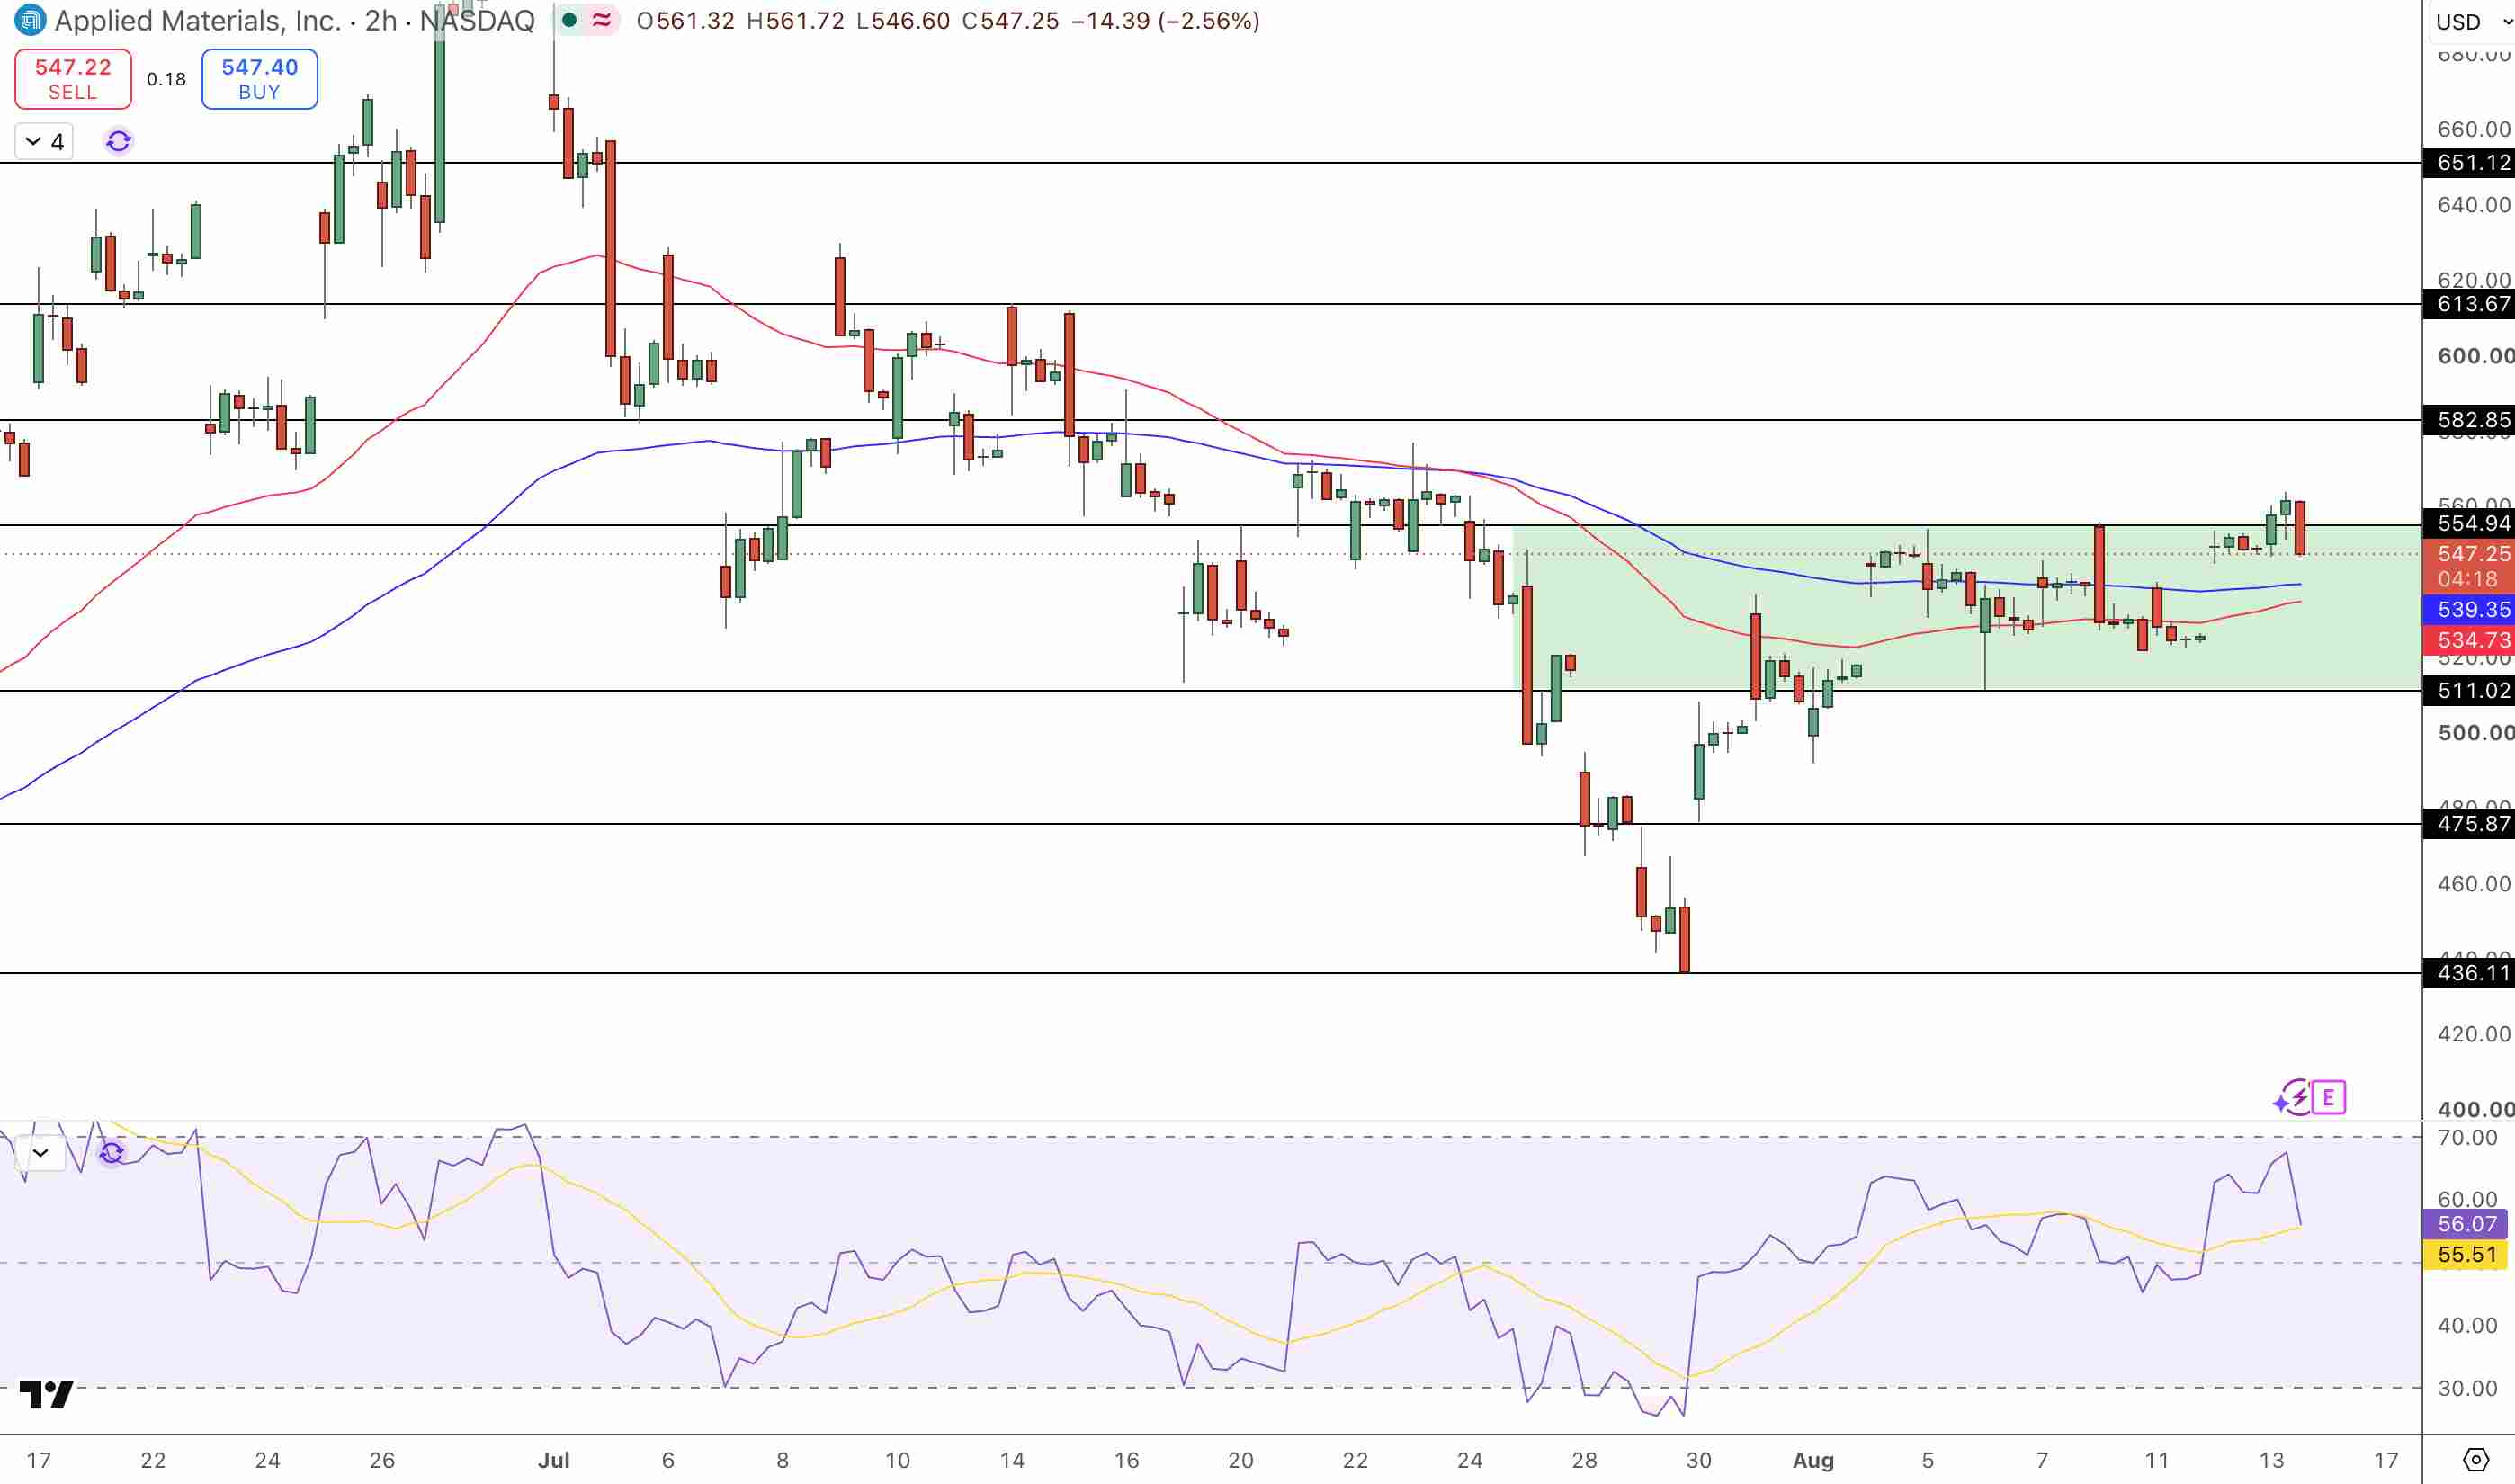
Applied Materials Price Chart - Source: Tradingview
Though the overall structure is bullish, and momentum has cooled, the RSI is currently at 56 with the signal line just beneath it. This indicates some bullish pressure after the recent rejection. Considering the break above the resistance zone at $554.94 and the subsequent rejection at $556, a bullish flag has been formed. Rejection at $560 would provide validity to the flag and possible bullish continuation towards the targets of $582.85 and even as high as $613.67 and $651.12.
On the downside, initial support is at the $534–$539 EMA zone. If that support zone breaks down, then the critical support zone would be at $511.02. A break of the support zone at $511 would negate the current bullish structure.
Key Levels (Aug 14 Asian, Before US Earnings)
- Immediate resistance: $554.94 (critical breakout level)
- Extended targets: $560, $582.85, $613.67, $651.12 (if breakout holds)
- 100-period EMA support: $539.35 (dynamic support)
- 50-period EMA support: $534.73 (dynamic support)
- Critical floor: $511.02
- Deeper support: $475.87
- Current price: $547.25 (consolidating below resistance)
- RSI: 56 (neutral, cooled from overbought)
What to Watch in Tonight's Earnings (After US Close, Aug 13)
Things to Watch Out For:
- Did revenue come in at $9.04B or above this mark?
- Did the company reach the range of $3.36 - $3.42?
- Margin expansion from a gross margin perspective.
- How did the segmentation impact the Semiconductor System segment?
- Will management sustain their forecast of ≥30% growth of the SE segment and ≥50% growth for ‘AP’ for the fiscal years 2026 and 2027?
- Will the Q4 outlook show a sustained acceleration?
- What are the customer’s views regarding the trends for HBM, AI, and complex chips?
Outlook:
- AMAT could break above the $554.94 resistance, and then the stock could start moving towards the upper range of $582 to $613.
- If the outlook and customer views stray from positive, and guidance isn’t what was expected, we can expect consolidation and price action within the range of $534 to $539.
Bottom Line
Applied Materials is at a strong fundamental position. The company maintains a guide of ≥30% YoY growth in the semiconductor equipment segment and ≥50% growth in advanced packaging for CY 2026. Q2 delivered record revenue of $7.91B, with gross margins at 50% and GAAP EPS of $3.51. The advanced packaging and HBM are secular growth drivers beyond just the AI chip accelerator volumes.
AMAT was rejected at $554.94, however, the stock is currently trading above $534 - $539 EMA support. RSI at 56 is neutral. The stock needs a confirmed closing price above $554.94 to continue the next leg bullish move toward $582 to $613. Support of $534 - $539 must hold otherwise a breakdown of $511 will weaken the stock structure.
For tactical traders: check results and guidance tonight. Earnings that beat expectations with unchanged guidance could drive the stock above $554.94 post-earnings. For investors: these earnings will help define whether the multi year cycle in the equipment sector will extend to 30%+ or if normalization begins. Buy zones above $554.94, take profits around $582-613. This is analysis and NOT investment advice.
Nothing in this material constitutes investment advice, personal recommendation, investment research, an offer, or a solicitation to buy or sell any financial instrument. The content has been prepared without consideration of your individual investment objectives, financial situation, or needs, and should not be treated as such.
Past performance is not a reliable indicator of future performance and/or results. Forward-looking scenarios or forecasts are not a guarantee of future performance. Actual results may differ materially from those anticipated.
Mitrade makes no representation or warranty as to the accuracy or completeness of the information provided and accepts no liability for any loss arising from reliance on such information.
Recommended Articles


