



Broadcom Stock Forecast: Down Over 30% Since June, Can the Stock Rebound From Here?
TradingKey - Broadcom (AVGO) hit a recent intraday low of $335.80 on September 16, down 32% from its all-time high of $494.20 and virtually erasing its year-to-date gains.
Yet just a few months ago, Broadcom was hailed by the market as the most certain winner in AI computing power, but it has now become a "cautionary tale of missed expectations."
It all traces back to the Q2 FY2026 financial report released on June 3. AI semiconductor revenue hit $10.8 billion, up 143% year-over-year, while Q3 guidance projected year-over-year growth of over 200%. However, management merely reiterated its goal of "exceeding $100 billion in AI chip revenue by FY2027" as "unchanged" and refused to raise it. Market expectations, priced at a P/E ratio of around 90x, lost the fuel to keep expanding, sending the stock price steadily lower ever since.
As the stock price fell, its valuation also underwent a clearing. Could this now mark a turning point for the stock?
Q2 FY26 Earnings: AI Revenue Rose 143%, Why It Turned Out to Be a Turning Point
Judging solely by financial performance, this is an impeccable report card. Revenue is surging, guidance is being raised, and cash flow and profit margins are equally impressive. From any traditional perspective, this is a rock-solid earnings report.
During the period, AI semiconductor revenue reached $10.8 billion, up 143% year-over-year and significantly beating market expectations. There were two growth engines: custom AI accelerators and AI networking equipment, with demand for both continuing to rise. CEO Hock Tan's statement was equally near-perfect: "This growth momentum is continuing, and we expect third-quarter AI semiconductor revenue to grow by more than 200% year-over-year to $16 billion."
The turning point occurred with another number. In March 2026, Hock Tan put forward a long-term goal of "fiscal year 2027 AI chip revenue exceeding $100 billion," which immediately became the core narrative driving the stock price higher. By June, the market's most anticipated move was only one: taking advantage of such explosive performance to raise the target and expand the narrative even further.
Hock Tan chose instead to reiterate that the target remained "unchanged." He added that demand visibility had "extended into 2028," that the company will ship over 10 gigawatts (GW) of AI chips in 2027, that computing power delivered in 2028 will be "substantially higher," and that it will exceed the $100 billion expectation "very easily."
The exact same number was interpreted as completely opposite signals within three months. When the $100 billion target was first presented in March, the market voted with real money, driving the stock straight to an all-time high; when the same target reappeared in June, the market reversed course. The target hadn't changed; what had changed was that the market had already "marked up" this number too many times—it was no longer waiting for delivery, but for a higher bid.
What Analysts Say: Pace Hasn't Slowed, Just Wasn't Raised
The assessments of two veteran observers almost sum up the entire debate.
Ben Bajarin, CEO of tech consulting firm Creative Strategies, hit the nail on the head: "The previously projected pace hasn't slowed down; they just didn't raise it." Meanwhile, Bernstein analyst Stacy Rasgon pointed out directly that what dragged down the stock price was the AI guidance for the third fiscal quarter.
Putting their assessments together makes things clear: the company fully delivered on its previously projected pace, with the only thing missing being an "upward revision." When a stock is already priced for a perfect future, "remaining unchanged" is inherently a negative signal.
Therefore, the nature of this sell-off can be stated in one sentence: it is not that the company's performance has faltered, but that market expectations were overly high. While results are still growing at 143%, expectations had already run far ahead of the targets. Broadcom's management chose not to chase them, allowing valuation to find its own balance. A significant portion of the current 30% drop reflects the company actively cooling market expectations to prevent bubbles from further piling up.
Valuation Reset: Broadcom P/E Ratio From 90x to 45x
The most direct impact of cooling expectations was on valuation multiples. In the three-plus months since the earnings report, Broadcom's trailing P/E ratio compressed from around 90x in early June to about 45x in mid-September, significantly deflating the valuation bubble. What does 45x mean? In early June, the average P/E ratio for semiconductor peers was around 69x, when Broadcom led far ahead at 90x; today, Broadcom at 45x is over 30% lower than the peer average at that time.
This round of pullback can be broken down into two parts. The first is cooling expectations: refusing to raise the 100-billion target cut away the narrative-driven premium in the valuation. The second is valuation mean-reversion: since delivering financial results takes time, the market chose to let multiples decline first.
Notably, fundamentals did not deteriorate during this period. Q2 beat expectations, Q3 guidance pointed to doubled growth, and the 100-billion target shifted from a "grand narrative" to a "baseline commitment." Almost all of the decline came from the compression of valuation multiples, rather than downward revisions to earnings expectations.
Long-Term Logic: The Inflection Point for Custom Chips Overtaking GPUs
After a 32% drop, the real question emerges: Has Broadcom's long-term investment thesis changed?
JPMorgan's autumn 2026 semiconductor industry update report outlines a clear structural curve: the AI accelerator market is transitioning from "GPU dominance" to the parallel expansion of GPUs and custom chips (ASIC/XPU).
In this rapidly penetrating sector, Broadcom holds a near-monopolistic positioning. In the custom AI ASIC market, projected at $60 billion to $70 billion in 2026, Broadcom and Marvell together account for about 90%, with Broadcom alone holding 80% to 85%. Such concentration is rare across the entire semiconductor industry.
Consider the point most frequently questioned by the market: order quality. Due to opaque supply chain information for projects such as Google's TPU, the market habitually doubts the quality of Broadcom's AI revenue. In response, JPMorgan stated directly in the report: low transparency does not mean weak demand.
The evidence is a contract. Broadcom's five-year TPU supply agreement signed with Google spans 2026 to 2031, covering 3nm, 2nm, and advanced packaging processes, and includes year-over-year increasing TPU revenue arrangements. The value of this agreement lies not in the numbers themselves, but in turning the "narrative" into a "contract": for the first time, AI revenue over the next five years has black-and-white visibility.
This is also the underlying logic for buying Broadcom: regardless of which cloud vendor wins the model race, custom chip orders cannot bypass Broadcom. As the "picks-and-shovels provider" for custom silicon, it stands on the most certain incremental side of AI infrastructure expansion.
Broadcom Technical Analysis
Broadcom's stock price rebounded from near the $335.83 low, reclaiming its 5-day and 10-day moving averages, but remains below its 20-day, 80-day, and 160-day moving averages and has yet to reclaim the 0.236 Fibonacci retracement level ($373.36). The current movement represents a technical rebound from low levels rather than a medium-term trend reversal.
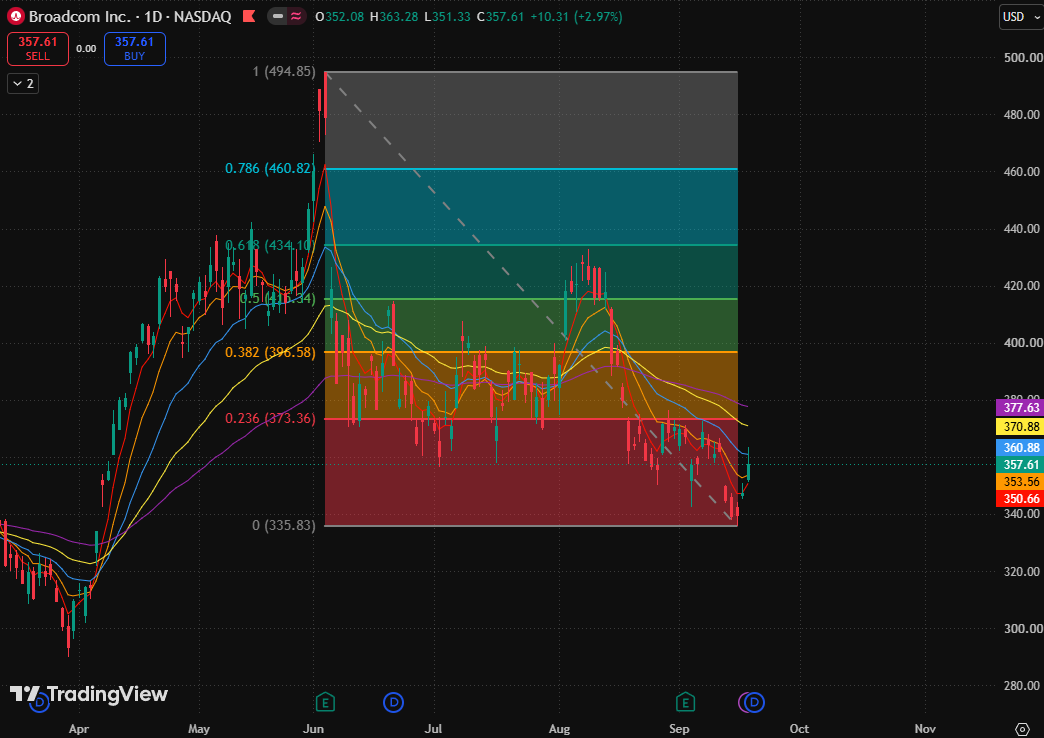
The stock price is currently testing short-term resistance near its 20-day moving average ($360.88). Although consecutive rebounds have improved short-term momentum, overhead moving averages continue to exert pressure, and the price remains some distance from the 0.236 Fibonacci retracement level ($373.36), indicating that the rebound has not yet completed its structural repair.
Regarding upside potential, primary support lies in the short-term support zone formed by the 5-day moving average ($350.66) and the 10-day moving average ($353.56). If the price holds above this region, the rebound structure can continue, with potential to further target the 20-day moving average ($360.88) and push toward the 0.236 Fibonacci retracement level ($373.36).
If the stock price falls back below the 10-day moving average ($353.56), it would indicate weakening rebound momentum, and the stock price could decline toward the period low of $335.83 and search for a new stage low further down.
Nothing in this material constitutes investment advice, personal recommendation, investment research, an offer, or a solicitation to buy or sell any financial instrument. The content has been prepared without consideration of your individual investment objectives, financial situation, or needs, and should not be treated as such.
Past performance is not a reliable indicator of future performance and/or results. Forward-looking scenarios or forecasts are not a guarantee of future performance. Actual results may differ materially from those anticipated.
Mitrade makes no representation or warranty as to the accuracy or completeness of the information provided and accepts no liability for any loss arising from reliance on such information.
Recommended Articles


