



CarMax Stock Forecast: Used-Car Demand Faces Major Q2 Earnings Test
TradingKey - Carmax (KMX) is scheduled to release its second quarter 2027 results on September 29, and according to current records, the latest completed close available for review was $57.46 on September 23. Prior to the release, the company appears to have a positive outlook. In the first quarter, Carmax reported an increase in revenue as a result of higher volume in wholesale units, and a decrease in costs. However, the company reported a decrease in comparable-store retail used unit sales and gross profit per unit. For the second quarter, it is expected that Carmax reports an improvement in retail used unit sales while maintaining a reasonable margin of profit.
Retail Demand Is the Most Important Q2 Test
In the first quarter of fiscal 2027, Carmax reported an increase in revenue to $8.01 billion, representing a 6.2% increase from the previous year. However, diluted earnings per share fell from the previous year to $1.31. A comparison of Carmax’s first quarter 2027 results, to that of the first quarter 2026, demonstrates little cause for optimism. In the first quarter 2027, Carmax reported retail used unit sales of 230,293, a marginal increase from the first quarter 2026. However, comparable store retail unit sales for the first quarter 2027, fell by 0.8%. For the first quarter of 2027, Carmax achieved an average selling price of $27,288, an increase of approximately $1,168, or 4.5%, from the previous year. A true recovery in consumer demand would likely result in a positive comparable store unit sales of retail used vehicles.
Wholesale Volume Is Improving Faster Than Retail
Better results from wholesale operations. CarMax, the largest used vehicle wholesaler in the U.S., reported that in Q1 they sold 162,064 vehicles through wholesale operations (up 8.4% from the year ago period) and generated 14% growth in wholesale revenue. Combined retail and wholesale used vehicle sales increased by 3.3% from the year-ago period.
While the results suggest that the company is efficiently moving vehicle inventory through its operations, the more important question is the health of consumer demand for retail used vehicles.
The company should expect improving consumer demand for retail used vehicles and should not depend on the strength of the wholesale business to drive results.
Profit Per Retail Vehicle Is the Core Margin Trade-Off
The company is reporting that it is seeking to improve used vehicle inventory turns and has lowered prices on some used vehicles. Due to the higher vehicle sale volumes, in Q1 used vehicle gross profits declined to $2,177 per vehicle from $2,407 per vehicle in Q1 of last year.
Overall gross profits declined by 4.4% from last year. Wholesale gross profits improved to $1,046 per vehicle from $1,047 per vehicle, essentially flat in Q1 of last year. In used vehicle retailing, a crucial balance is needed between the number of vehicles sold and the profit earned from each sale.
A year ago, in fiscal Q2, comparable-store retail used unit sales declined by 6.3% and the average gross profit per used vehicle sold was $2,216. A year ago, comparable-store retail unit sales and average gross profit per used vehicle sold were both stronger than CarMax’s latest Q1 trend in some respects, suggesting a improvements this quarter would be constructive.
CarMax Auto Finance Could Shape the Earnings Result
CarMax Auto Finance (CAF) recorded income of $140.2 million in Q1 2027, representing a 1% decrease from the prior year period. The decline was mainly attributable to a decline in auto loans outstanding following CarMax’s non-prime securitization. In Q1 2027, CAF recorded a loan-loss provision of $95.6 million, as compared to $101.7 million in Q1 2026. High vehicle and financing costs may constrain consumer purchasing power. The company’s Q2 report will provide further insight on the retail business, and if the financing business will be able to offset constraints in the retail business.
Cost Cuts Are Supporting the Turnaround
For Q1 2027, selling, general and administrative costs declined by 3.7% to $635.2 million. The company has set a goal to achieve $200 million in exit-rate cost savings by the end of FY 2027. In addition, the company recently announced the elimination of 145 corporate jobs. While cost-cutting efforts help improve the bottom line, other business improvements, especially in the retail business, are needed to provide a more stable and longer-term growth of the company.
Wall Street Expects Year-Over-Year Improvement
According to current projections, the company is expected to report earnings per share of approximately $0.72 for the quarter ending August 31. Revenues are projected to be approximately $6.97 billion. These are expectations of analysts. The company provides no forward looking information. Last year, the company reported earnings per share of $0.64 and revenues of $6.59 billion. Because of the seasonality of the business, there is a sequential decline in the quarterly results. Therefore, while analysts expect positive year over year results, there is a decline from the first quarter of fiscal 2027.
As a result, I am looking for positive year over year results for each of the relevant lines of business for the quarter. I am also looking for positive results from the company’s retail gross profits and the business’s captive finance subsidiary for the quarter.
The September 29 Report Needs Better Quality of Growth
My base case is neutral, but I am open to revising my case to be more constructive, if supported by the data. CarMax has made visible progress regarding wholesale volume and cost structure, but continues to face soft retail demand. Considering CarMax's last reported metrics, I would be constructive if of if comparable-store retail units turned positive and retail gross profit per vehicle averaged current levels. I would be cautious if retail units did not improve and gross profit per vehicle declined again.
The main challenge for CarMax is determining if the company is improving its demand by offering lower prices and/or by improving its overall business processes, or if the company is simply lowering its prices to clear its inventory.
CarMax Technical Analysis: KMX Stays Bearish Below $58.11 as $56.44 Support Faces Pressure
The last confirmed close of CarMax, available for review, was at $57.46. The 2-hour chart has shown successive lower highs beneath the descending trendline. Following bearish price action, I am looking for $56.44 to provide support. With the retracement to $58.11, that level has failed to be reclaimed and remains resistance in the near term.
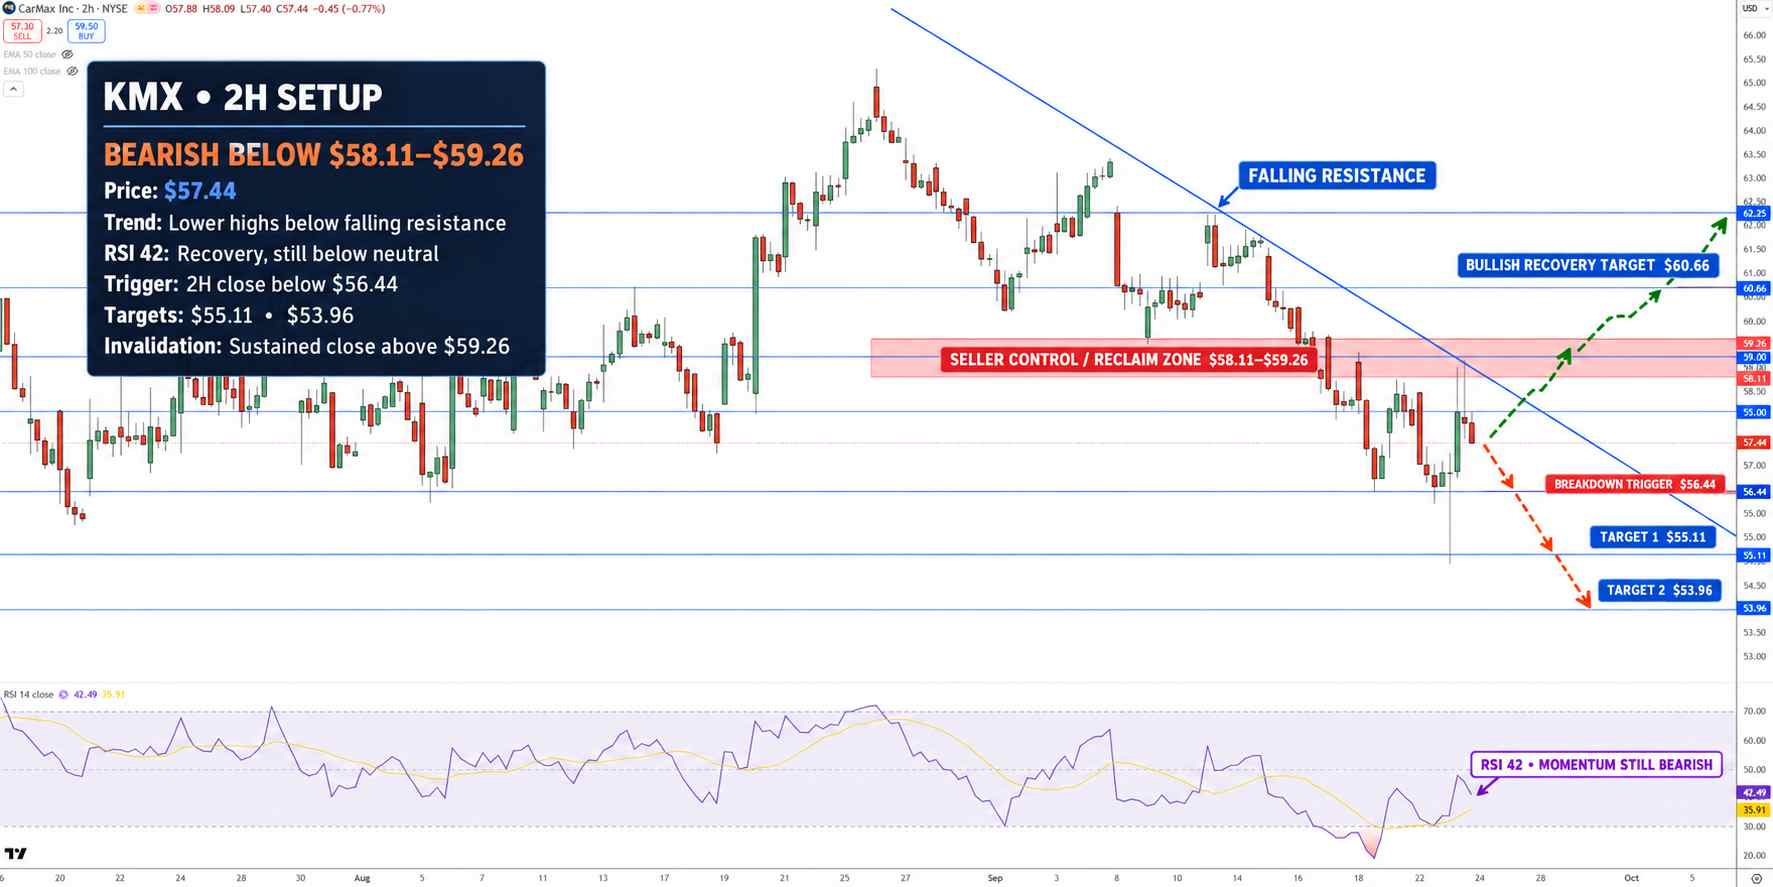
CarMax Stock Price Chart - Source: Tradingview
RSI is at 42 and above the signal line at 36 after recovering from oversold territory. Selling pressure has eased, but momentum remains below the neutral 50 level. Bear in mind, a strong move below $56.44, in the 2-hour time frame, would confirm a bearish bias and open $55.11 and $53.96.
Resistance is located at $58.11. A bearish bias would prevail below this level.
A bullish bias would be confirmed above a bearish trendline and $59.26. If this were to occur, we would expect $60.66 and $62.25 to the upside.
Until then, I will maintain a bearish bias, below $59.26.
Key Levels
• Latest confirmed close: $57.46
• Major Support: $56.44, $55.11, $53.96
• Major Resistance: $58.11, $59.26, $60.66
• RSI: 42 (Bearish/Neutral)
• Bearish Target: $55.11 (confirmed break of $56.44)
Why is CarMax stock in focus now?
CarMax will release its earnings report for its second fiscal quarter on September 29. Leading up to the report, traders will pay close attention to the retail units, gross profit per vehicle, CarMax Auto Finance, and if there has been an improvement in the effectiveness of its operations.
What level confirms a stronger KMX recovery?
A clear move above the trendline resistance and the $59.26 level would more concretely indicate a recovery. If $56.44 support is broken, then $55.11 is next.
Bottom Line
CarMax has the potential for an upside breakout. Improved cost and inventory control should result in improved results. Results in September should show increased volume. Retail used vehicle demand should be evident. If gross profit per unit remains at the current level, results should show an increasing trend.
Trendline resistance is currently at $59.26. A break below $56.44 would increase the likelihood of a move toward $55.11 and then $53.96. A sustained break above $59.26 would improve the technical outlook and put $60.66 and then $62.25 in focus.
Nothing in this material constitutes investment advice, personal recommendation, investment research, an offer, or a solicitation to buy or sell any financial instrument. The content has been prepared without consideration of your individual investment objectives, financial situation, or needs, and should not be treated as such.
Past performance is not a reliable indicator of future performance and/or results. Forward-looking scenarios or forecasts are not a guarantee of future performance. Actual results may differ materially from those anticipated.
Mitrade makes no representation or warranty as to the accuracy or completeness of the information provided and accepts no liability for any loss arising from reliance on such information.
Recommended Articles


