



Netflix Stock Forecast: 1,000 Job Cuts Put Q3 Margins in Focus
TradingKey - Netflix (NASDAQ: NFLX) closed at $70.57 on October 14, up 0.16% from the day prior. It traded between $69.37 and $71.26. The company’s biggest round of layoffs since 2022 occurred this month as management continues to invest heavily into live sports and advertising.
I expect more of the same from Netflix in the near term. The company will report earnings on October 20. Results will likely show that the new pricing structures, advertising, and sports tiers do little to offer sustainable profitability, even though sales are still growing.
Netflix Cuts Around 1,000 Jobs Before Earnings
In a report by Reuters on October 14, Netflix announced it would cut approximately 1,000 jobs, or 6% of its workforce, mainly from product and tech, legal and HR. Co-CEOs, Ted Sarandos and Greg Peters, told staff that the business was strong, and that it would continue to achieve its annual business targets.
What’s interesting about the announcement is the timing. Because the company is profitable, the cuts look more like a reallocation of resources than a cash flow liquidity event. The cuts were also made after the end of Q3, and therefore the margin impacts will be primarily forward-looking. We will likely find out more in the company’s October 20th earnings call.
2030 World Cup Rights Broaden the Sports Strategy
On October 13, Netflix agreed to a multi-year deal to broadcast the 2030 FIFA World Cup matches in Spain and Andorra. The terms of the deal were not disclosed. The deal covers Spain and Andorra, not worldwide broadcast rights. Current NFL, WWE and Boxing programming provides a wider range of live events for the streaming service.
It is expected that live programming will account for about 5% of the content budget in 2026, and about 1% of the total viewing hours. However, live events have accounted for six of the ten biggest new member sign-up days over the last five years.
Q3 Guidance Sets a Measurable Earnings Hurdle
Netflix expects revenue of $12.86 billion for Q3, a 11.7% increase from the same quarter last year, and an operating income of $4.27 billion. Management expects a 33.2% margin, an increase from the 28.2% margin from the prior year. Earnings per share are expected to be $0.82.
Management’s July guidance of $12.86 billion revenue and $0.82 EPS was below Wall Street expectations of approximately $13 billion and $0.84 EPS for the quarter. A beat of expectations for Q3 may not be sufficient to propel shares, particularly if guidance for Q4 is weak. Additionally, charges from restructuring may be larger than expected.
Advertising Could Approach $3 Billion in 2026
Netflix projects roughly $3 billion in full year 2026 advertising revenues, up roughly 100% from estimated 2025 revenues. They are expanding the availability of programmatic ad buying, increasing their use of AI, and creating new ad inventory surrounding their live programming.
Advertising will remain a small percentage of revenues versus their subscription business, but monetizing viewers provides upside potential. The main issue, however, is whether they can generate growth from advertising to offset their slower user engagement and not be forced to spend disproportionate revenues on technology and sports and entertainment content.
Engagement Growth Remains Modest
Netflix reports their users viewed over 97 billion hours of content through the first half of 2026, representing a 2% increase versus the year prior and 1.5% increase reported in 2025. Starting in 2027, they will report their what we watched report once a year.
According to management, viewing hours don’t represent the quality of the content, but rather whether users retain and/or acquire the content. While that may be true, their user engagement growth remains slow relative to their competitors.
Q2 Profitability and Buybacks Provide Support
Netflix reported 13% revenue growth in Q2 to $12.56 billion. Operating income and net income also grew approximately 11% and 9%, respectively. Free cash flow for the quarter declined to $1.53 billion from $2.27 billion in the year prior.
For 2026, management expects 31.5% operating margin and roughly $12.5 billion in free cash flow. They also reported strong results from their Q2 buyback of $4.7 billion, reducing their total authorization to $27.1 billion. Management is under no obligation to repurchase shares and can use the authorization discretely.
October 20 Will Test Growth Against Efficiency
Netflix will release earnings around 1:01 PM Pacific on October 20. Their management team will be conducting an interview at 1:45 PM Pacific. I will listen to see if they give further insight on Q4, advertising, pricing, margins, and cost-cutting restructuring efforts.
I believe there will be upward revisions to revenue numbers given strong advertising and pricing efforts. Strong outperformance and expansion of live sports would also be positive, though costly.
However, if margins and engagement slow, and they give forward-looking statements to expand live sports offerings, then I will be less confident in their restructuring efforts.
Netflix Technical Analysis: $66.98 Is the Bearish Trigger
NetFlix (NFLX) closed October 14 at $70.57, after trading between $69.37 and $71.26. The provided daily chart shows the stock forming lower highs and trading under the descending trendline dating back to April. The stock is also trading under the 50-day and 100-day moving averages, keeping the trend in the broader picture, bearish, despite the most recent bounce.
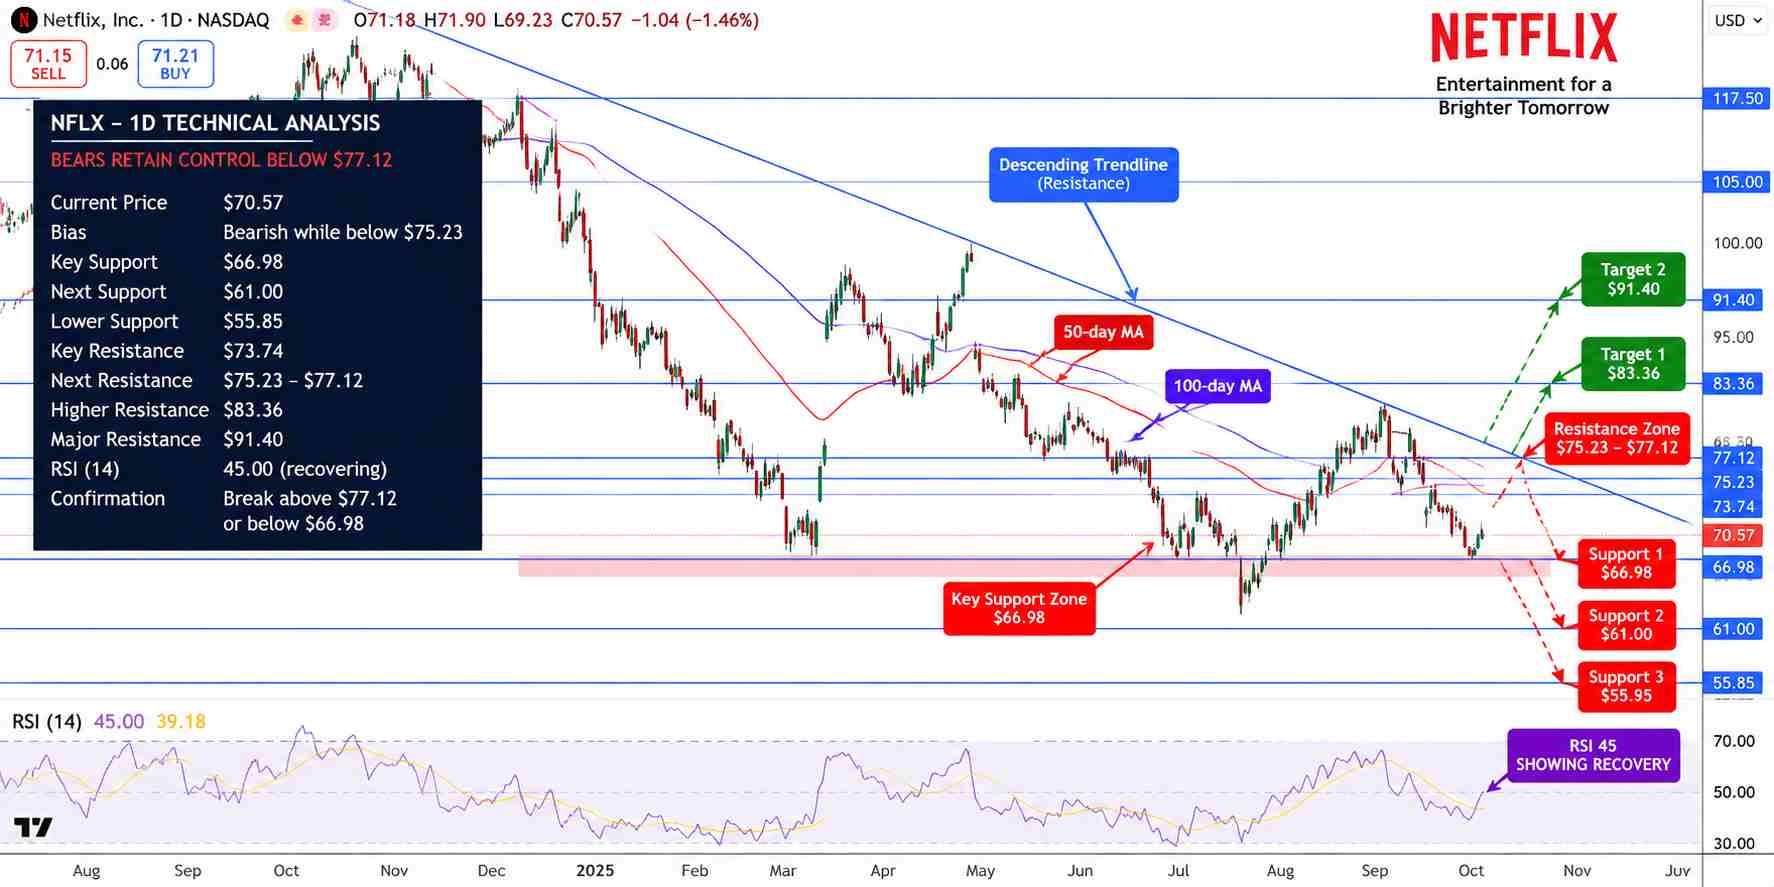
Netflix Price Chart - Source: Tradingview
The RSI, near 45, and above a signal line at 39, shows selling pressure is easing, but the buyers have not been able to retake control above the 50 neutral mark. The indicators, trendlines, and moving averages, are simply shown for illustrative purpose and haven’t been validated.
I’m biased to the bearish side below the 75.23-77.12 resistance cluster, shown on the chart. Initial resistance is at $73.74. Taking out $77.12 would expose $83.36, then $91.40. The key support is $66.98. A breakdown and close under $66.98 would expose $61.00, and potentially $55.85. Considering the October 20 earnings release, a price gap is possible and could bypass nearby levels, although a closing price would still help confirm the breakdown.
Key Levels
- Latest Close: $70.57, October 14, up 0.16%
- Support: $66.98, then $61.00 and $55.85
- Resistance: $73.74, then $75.23-77.12 and $83.36
- RSI: approx. 45 on supplied chart; not verified
- Breakout: over $77.12
- Breakdown: below $66.98
FAQ: Why Is Netflix Cutting 1,000 Jobs?
Management claims it is realigning resources towards priorities while still achieving its financial goals for the year. October results should help answer what the margin impact of this will be.
FAQ: What Is NFLX's Main Breakdown Level?
The supplied chart has $66.98 marked as a key level. A close below this level would likely bring $61 into play.
Bottom Line
Netflix is still a profitable company, however concern is growing around a slowing growth model because of weaker user engagement and the new sports costs. Until I see evidence to the contrary, the bear case is valid below $77.12.
Nothing in this material constitutes investment advice, personal recommendation, investment research, an offer, or a solicitation to buy or sell any financial instrument. The content has been prepared without consideration of your individual investment objectives, financial situation, or needs, and should not be treated as such.
Past performance is not a reliable indicator of future performance and/or results. Forward-looking scenarios or forecasts are not a guarantee of future performance. Actual results may differ materially from those anticipated.
Mitrade makes no representation or warranty as to the accuracy or completeness of the information provided and accepts no liability for any loss arising from reliance on such information.
Recommended Articles


