



FMC Stock Forecast: $650 Million Channel Reset Sends Shares Down 30% Toward $4.90 Support
TradingKey - FMC Corporation (NYSE: FMC) fell 30.53% to $5.62 on Thursday, October 15, after hitting a new 52-week low of $4.85. The decline was the result of a warning issued by the company that predicted a significant drop in revenue for the third quarter, to between $65 million and $125 million. The reason for the drop was attributed to price cuts for distributors, as well as changes being made to U.S. selling.
I believe this is a structural pricing reset, not a demand dip. The biggest unknowns in the interim are the balance sheet and the earnings call. The next catalyst for the company is the release of Q3 earnings on October 29, with a call scheduled for the following day, October 30, to discuss 2027 and 2028 guidance.
What FMC Actually Announced
FMC expects its commercial actions will reduce revenue and adjusted EBITDA by approximately $625 million to $675 million. Because of this, the company expects Q3 adjusted EBITDA will be in the range of negative $510 million to negative $565 million.
The difference is large. In July, FMC had guided to third quarter revenue between $840 million to $900 million, with adjusted EBITDA between $120 million to $140 million. Most of the revenue has already been given back through price reductions to the channel.
Why the Channel Problem Became Urgent
In the company’s release, CEO Pierre Brondeau mentioned that third quarter demand was weaker than expected. He attributed the weakness to elevated distributor inventory of more of FMC's higher priced products, which is causing less product movement and lower replenishment orders.
I am looking at the geographical location. FMC is lowering prices for channel inventories in Brazil, Argentina, the U.S. and Canada. If the problem occurs for two of FMC's larger markets, I believe the problem is more than just a timing issue, or a one-off due to weather. The problem is likely more competitive and price-related as there are likely cheap generics competing for the same customer base.
The U.S. Pricing Model Overhaul
The U.S. pricing model overhaul is the second of two important changes to the business. FMC is abandoning its historical high list price, high rebate structure in the U.S., and is working to narrow its gross and net pricing spread.
From an overall picture perspective, this will enhance transparency and discipline in the channel. However, reported prices will reset lower, and healthier channel margins will need to be recouped to keep investors at ease.
Covenant Talks Are the Real Risk
FMC expects to meet its loan covenants at September 30. However, it expects to begin discussions with its bank group to amend covenants to provide more flexibility.
I think the most important part of the release states FMC expects to meet its covenants but will begin discussions to amend covenants to provide more flexibility. Covenants limit the level of debt a company can hold relative to its earnings, and that FMC needs to begin discussions to amend its covenants after a quarter of negative EBITDA signals that leverage is tight.
There is some cushion. In July, FMC concluded its strategic review and strengthened its liquidity through a series of transactions that resulted in approximately $1 billion of proceeds to reduce debt, including the $252 million sale of its India business and a $200 million Corteva crop protection business license. There is also a $400 million equity investment, pending regulatory approval.
Impairment Risk Adds Accounting Noise
FMC disclosed it is required to assess its intangible assets for impairment as a result of the recent changes. It is unable to estimate the potential impact, but acknowledges the impact could be significant. The adjustment may occur in Q3, and as noted above, could result in a significant non-cash charge.
The Pre-Cut Picture Was Already Weak
Q2 revenue dropped 17% to $867 million, with a GAAP loss of $1.49 per share, and adjusted EPS dropping 62% to $0.26. Adjusted EBITDA dropped 26% to $153 million. Operating cash flow of $363 million was positively impacted by the one-off Corteva payment.
Analysts were already backing away. On Oct 13th, RBC lowered its target from $11 to $9, but kept its rating at Sector Perform. FMC will update its full-year guidance on Oct 29th.
FMC Technical Analysis: FMC Crashes Toward $4.90 Support as RSI Hits Extreme Oversold
FMC Corp (FMC) closed at $5.62, a 30.53% decline from its previous close near $8.09. On Thursday, FMC opened at $5.12 and dropped to a low of $4.85 before closing at $5.62. The $4.85 low pierced the $4.90 support before some buyers stepped in to lift price off the low. On the daily chart, the gap extends a downtrend which has been sloping lower since December and intersects a falling trendline. The moving averages are located at $9.90 (red) and $11.03 (blue). Price closed well below the red average and in the air pocket.
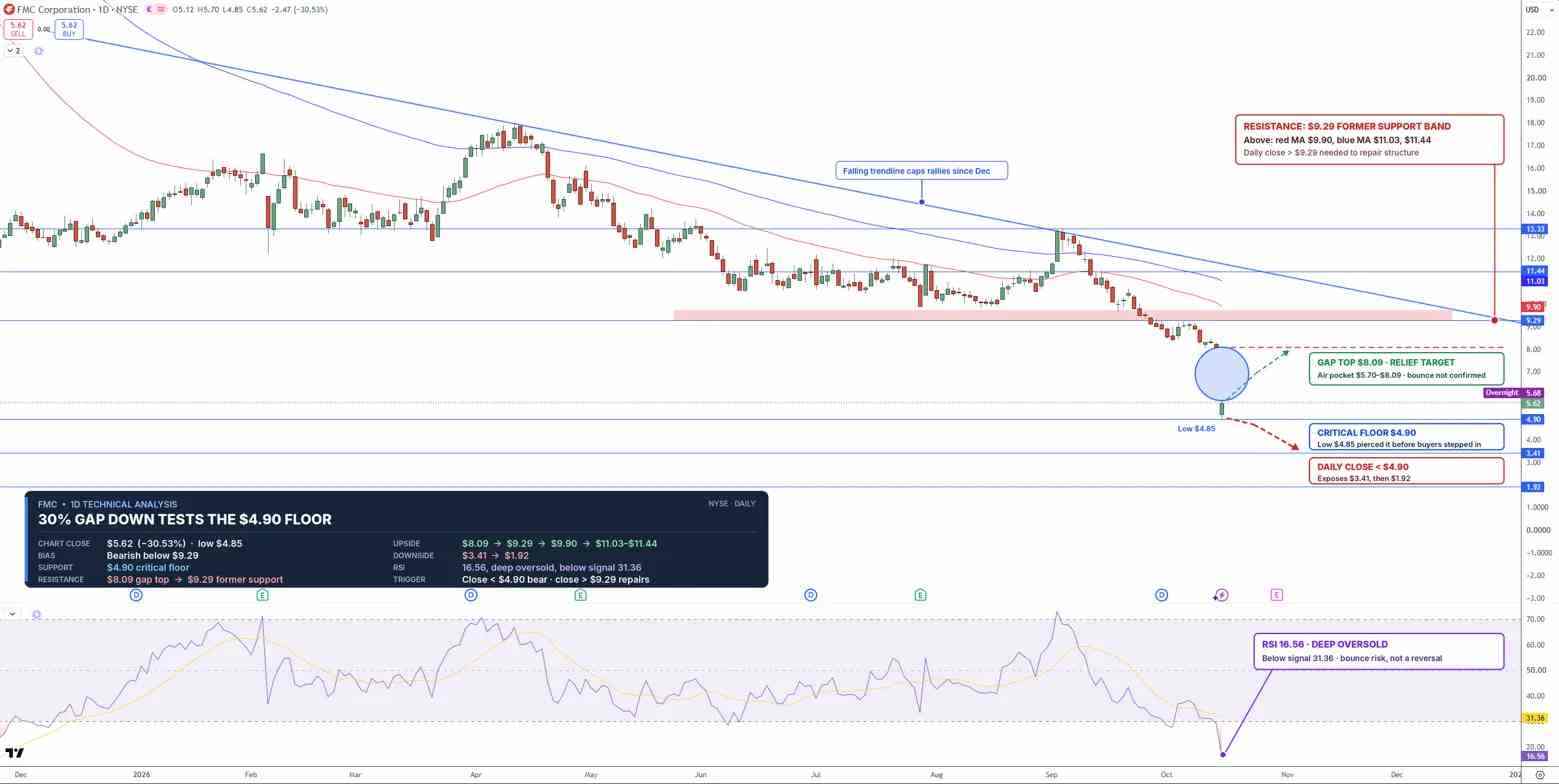
FMC Stock Price Chart - Source: Tradingview
The RSI has moved below 31.36 and reached a new low of 16.56. This has frequently been a signal for a relief rally. Selling has been heavy and rapid, so oversold conditions can persist, which is the case here.
A rebound has a wall of resistance in the $8.09 to $9.29 area, which is bolstered by a falling trendline just below the red moving average. This is followed by $9.90 (red average) and then $11.03 to $11.44. A daily close below $4.90 would expose the $3.41 and $1.92 levels. I am bearish as long as FMC trades below $9.29, but a bounce toward $8.09 is possible. A close above $9.29 would negate the bearish view.
Key Levels
Last Trade: $5.62, -30.53% October 15
Support: $4.90, $3.41, $1.92
Resistance: $8.09, $9.29, $9.90, $11.03 to $11.44
RSI: 16.56, below its 31.36 signal line
Bullish Trigger: Close above $9.29
Bearish Trigger: Close below $4.90
FAQs
Why did FMC stock crash on October 15?
FMC expects Q3 revenue to be in the range of $65 million to $125 million as a result of price cuts to distributors, with adjusted EBITDA expected to be negative.
What is the FMC stock forecast after the crash?
The bias will remain bearish while below $9.29. The oversold reading could lead to a bounce to $8.09, and a close below $4.90 could lead to a further move to $3.41.
Bottom Line
FMC is paying a steep price to clean up its channel. The opportunity is an oversold bounce if October 30 delivers a credible 2027 recovery plan. Restrictive covenant terms, significant asset impairments, and depressed volumes could all be in store. A close above $9.29 would improve my opinion, and a close below $4.90 would suggest further downside.
Nothing in this material constitutes investment advice, personal recommendation, investment research, an offer, or a solicitation to buy or sell any financial instrument. The content has been prepared without consideration of your individual investment objectives, financial situation, or needs, and should not be treated as such.
Past performance is not a reliable indicator of future performance and/or results. Forward-looking scenarios or forecasts are not a guarantee of future performance. Actual results may differ materially from those anticipated.
Mitrade makes no representation or warranty as to the accuracy or completeness of the information provided and accepts no liability for any loss arising from reliance on such information.
Recommended Articles


