



SanDisk Stock Price Forecast: SNDK Plunges 15% in Five Days, Risks Further Drop Toward $1,000 Mark
TradingKey - SanDisk's stock price has plunged 15% in the last 5 days and could fall further, potentially testing the key $1,000 round-number mark again under extreme scenarios.
On October 16 Eastern Time, SanDisk (SNDK) continued its relentless decline, falling more than 2% in pre-market trading to temporarily report at $1,359.48. Over the past five trading days, SanDisk's stock has dropped a cumulative 15%, hitting a low of $1,276.
At the end of September, SanDisk's stock price touched $1,900, attracting a large concentration of leveraged long positions chasing highs in the derivatives market. Lacking further positive catalysts, investors began taking profits or unwinding positions, triggering a pullback in the stock price once it broke below key technical support at $1,600.
In early October, market rumors surfaced that China's ChangXin Memory Technologies (CXMT) had made progress in next-generation memory architecture. Although this does not impact SNDK's Enterprise SSD monopoly in the short term, Wall Street has begun scrutinizing long-term pressures on the 2027 global NAND/DRAM supply-demand balance and average selling prices (ASPs), causing SK Hynix (SKHY) to plunge over 3%, while Micron (MU) and Western Digital (WDC) dropped alongside SanDisk.
In mid-October, the U.S. reported September CPI rising to 3.7% year-over-year, while monthly PPI surged to +1.3% (6.3% year-over-year). Elevated inflation data pushed up U.S. Treasury yields, effectively ruling out any room for short-term back-to-back rate cuts by the Federal Reserve (Fed) and boosting rate-hike expectations. Against the backdrop of high interest rates weighing on high-P/E assets, high-beta memory and semiconductor stocks were the first to face concentrated institutional deleveraging sell-offs, pushing SanDisk's stock price lower.
Currently, SanDisk's 200-day simple moving average (200-day SMA) sits near $1,199. The previous session's intraday low of $1,276 successfully triggered the first wave of dip-buying. As long as the broader U.S. market does not suffer a systemic collapse, strong support will exist above $1,200.
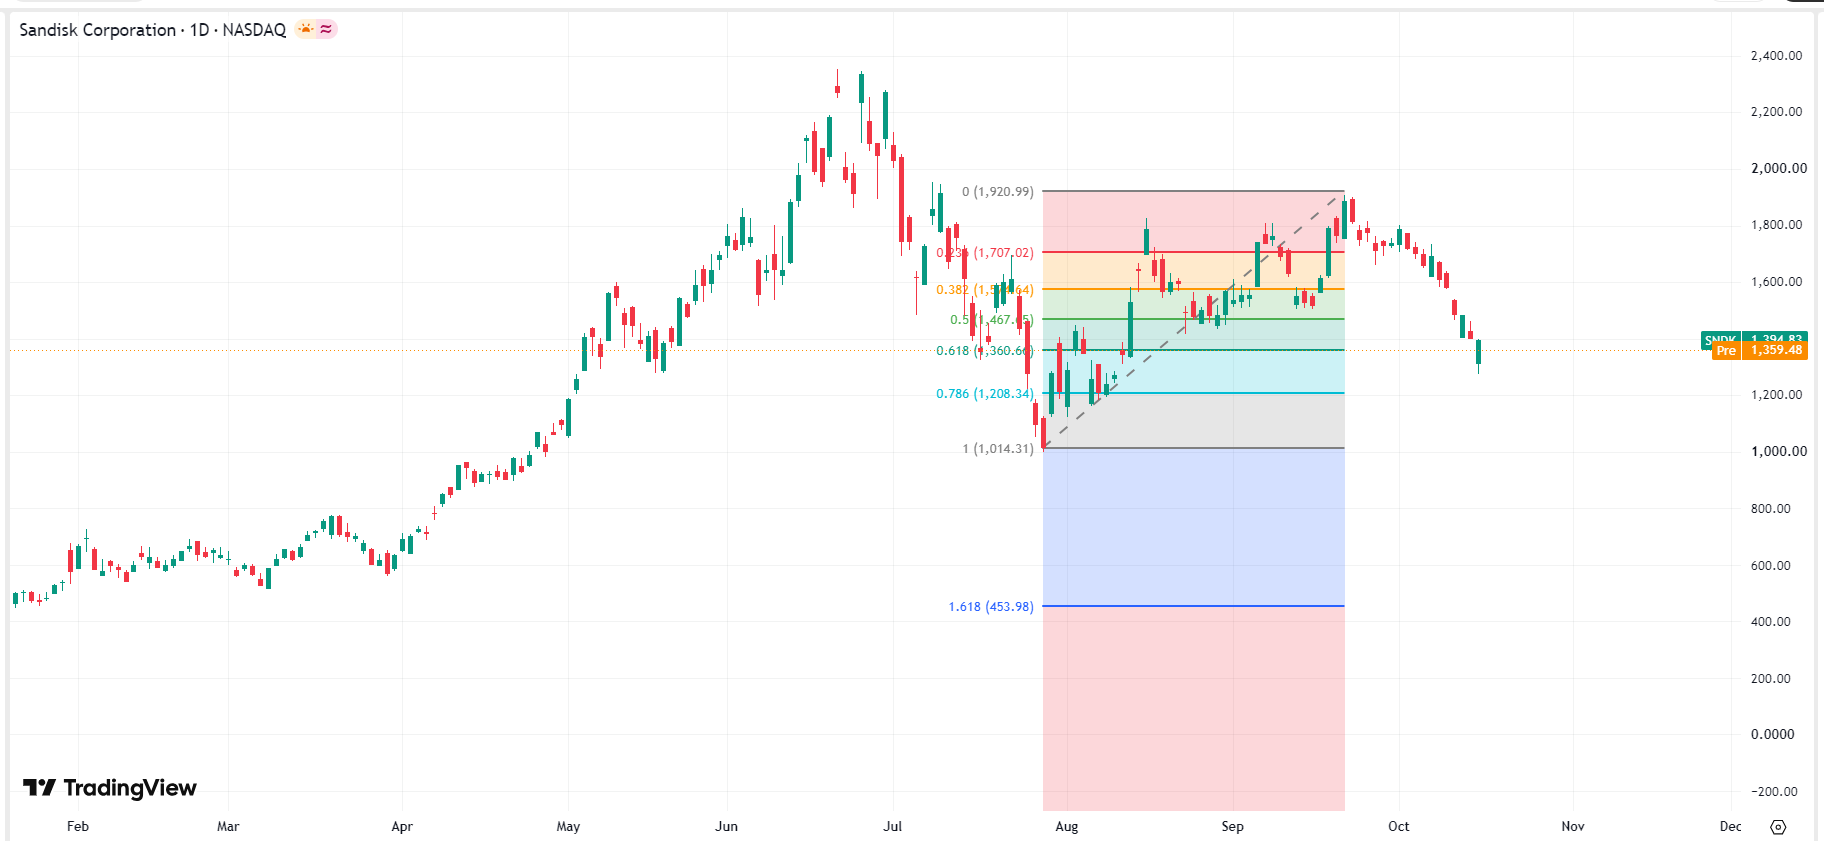 SanDisk stock price chart, Source: TradingView
In the event of an unexpected development—such as a major downside surprise in Q3 earnings guidance on October 29 or a macroeconomic liquidity crisis—SanDisk's stock price could break below $1,200. In that scenario, strict risk control must be executed to guard against a major pullback testing the $1,000 level, which served as the structural launchpad for SNDK's major range breakout in April this year.
Nothing in this material constitutes investment advice, personal recommendation, investment research, an offer, or a solicitation to buy or sell any financial instrument. The content has been prepared without consideration of your individual investment objectives, financial situation, or needs, and should not be treated as such.
Past performance is not a reliable indicator of future performance and/or results. Forward-looking scenarios or forecasts are not a guarantee of future performance. Actual results may differ materially from those anticipated.
Mitrade makes no representation or warranty as to the accuracy or completeness of the information provided and accepts no liability for any loss arising from reliance on such information.
Recommended Articles


