



Amazon Stock Price Forecast: Weak Earnings Trigger 12% Stock Plunge, Next Support Seen at $200 Mark
TradingKey - Amazon's results miss expectations, sending stock plummeting 12%; technicals face test of $200 level.
On October 29 Eastern Time, after tech giant Alphabet (GOOG) plummeted over 10% due to expanding CapEx, Amazon's (AMZN) newly released Q3 FY2026 earnings report followed suit, causing its stock price to tumble 12% in after-hours trading and face heavy ongoing downside pressure.
Although Amazon's AWS cloud revenue maintained high growth, multiple areas fell short of expectations, including a surge in capital expenditures (CapEx), free cash flow (FCF) turning negative, and a conservative Q4 outlook, as detailed below:
Financial Metrics | Reported Q3 2026 Data | Market Expectations | Wall Street Concerns & Core Crux |
|---|---|---|---|
AWS Cloud Revenue | $46 billion | $45.4 billion | YoY growth expanded to 39%, but failed to resolve the earnings impact |
Capital Expenditures | Annual plan raised to $220 billion | Higher than expected $195–200 billion | AI data centers and GPU procurement erode free cash flow |
Free Cash Flow | Turned negative (-$42.4 billion) | Maintained net inflows | Massive CapEx led to significant deterioration in FCF margin |
Q4 Holiday Season Outlook | Midpoint of guidance range missed expectations | High expectations for the shopping season | Rising retail e-commerce logistics costs put pressure on peak-season profit margins |
Hit by the disappointing earnings, Amazon's stock price not only surrendered the 200-day moving average and the short-term consolidation zone of $243–$245, but also broke through the strong support level of $224–$226 from June this year, pushing its technical pattern into a breakdown and bottom-seeking phase.
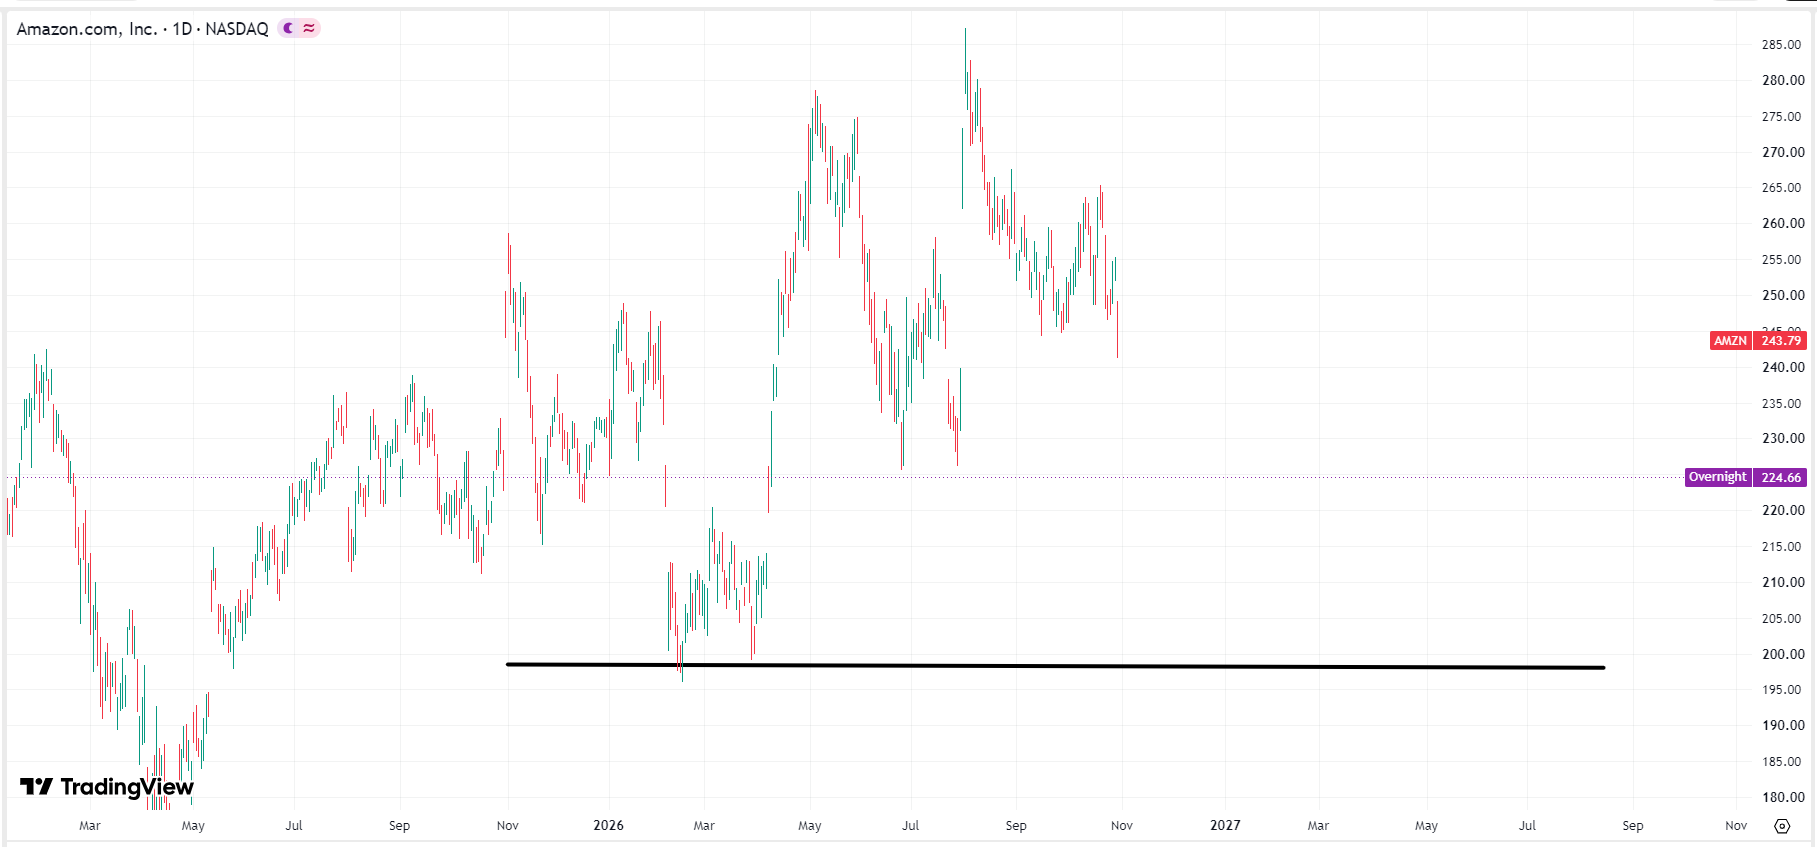 Amazon stock price chart, Source: TradingView
If collective selling pressure on major U.S. tech stocks fails to subside in the short term, AMZN's stock price will face retesting pressure toward the $200 round-number mark. This level is not only a key psychological threshold, but also represents the significant cost basis of major Wall Street sovereign wealth funds and long-term value funds established in early 2026, offering strong defensive attributes.
Furthermore, if the stock price approaches the $200 mark, Amazon's EV/EBITDA multiple will fall back to an extreme low for the past three years of around 12.5x–13.0x. Compared to AWS's rapid YoY growth rate of 39%, its valuation will appear exceptionally attractive, which is expected to trigger strong left-side buying defense from value investors and sovereign wealth funds, providing powerful spot support here.
Nothing in this material constitutes investment advice, personal recommendation, investment research, an offer, or a solicitation to buy or sell any financial instrument. The content has been prepared without consideration of your individual investment objectives, financial situation, or needs, and should not be treated as such.
Past performance is not a reliable indicator of future performance and/or results. Forward-looking scenarios or forecasts are not a guarantee of future performance. Actual results may differ materially from those anticipated.
Mitrade makes no representation or warranty as to the accuracy or completeness of the information provided and accepts no liability for any loss arising from reliance on such information.
Recommended Articles


