



Intel Stock Price Forecast: Q3 Results Beat Expectations, but Shares Plunge Over 23% After-Hours and Could Fall to $55
TradingKey - At the close on October 29 Eastern Time, Intel (INTC) stock fell 3.62% to close at $92.07. Shortly thereafter, after Intel released its third-quarter 2026 earnings report, its stock plunged 23.03% in after-hours trading. The report showed that although third-quarter revenue and adjusted earnings per share both exceeded market expectations, fourth-quarter guidance fell significantly short of Wall Street forecasts, which, coupled with PC market weakness, manufacturing supply constraints, and cash flow pressure, caused the stock to tumble post-market.
Why Is Intel Stock Falling? Q3 Results Beat Expectations, But Q4 Guidance Is Significantly Below Market Forecasts
Intel's third-quarter revenue reached $16.51 billion, up 21% year-over-year, slightly beating market expectations of approximately $16.48 billion; non-GAAP earnings per share came in at $0.52, also significantly above the market forecast of $0.40. Non-GAAP gross margin rose to 44.1%, up 4.1 percentage points from the same period last year. The company generated $5.1 billion in operating cash flow during the third quarter.
By business segment, the Data Center and AI segment served as the primary driver of growth this quarter. Data Center and AI revenue reached $7.3 billion, up 78% year-over-year, while Intel Foundry revenue hit $6.7 billion, up 58% year-over-year. In contrast, CCPG revenue was $8.1 billion, down 5% year-over-year, reflecting that while server and AI demand remained strong, the PC business continued to face pressure.
What truly triggered the sharp drop in the stock price after hours was the fourth-quarter guidance. Intel expects fourth-quarter revenue to range between $15.0 billion and $16.0 billion, well below market expectations of about $17.07 billion; adjusted EPS is projected at $0.25, also trailing market forecasts of around $0.44. The company expects its fourth-quarter non-GAAP gross margin to fall to 38%, marking a noticeable pull-back from 44.1% in the third quarter.
Management stated that weakness in the PC market is expected to persist at least through the first half of 2027. Meanwhile, a prior incident at Intel's facility in Kiryat Gat, Israel, impacted production and is expected to reduce revenue by about $600 million across two quarters, with the fourth-quarter revenue impact estimated at approximately $300 million, lowering fourth-quarter gross margin by about 2 percentage points.
In addition, capital expenditures and cash flow remain key focuses for the market. Intel expects manufacturing capital investments of around $20 billion in 2026 and plans to further increase investments in 2027, while expecting that positive free cash flow will remain unachievable this year. Although demand for data center CPUs remains strong, short-term supply constraints mean Intel cannot fully unleash that demand, making it difficult for server growth to fully offset PC market weakness and manufacturing pressures for now.
Intel Stock Price Technical Analysis
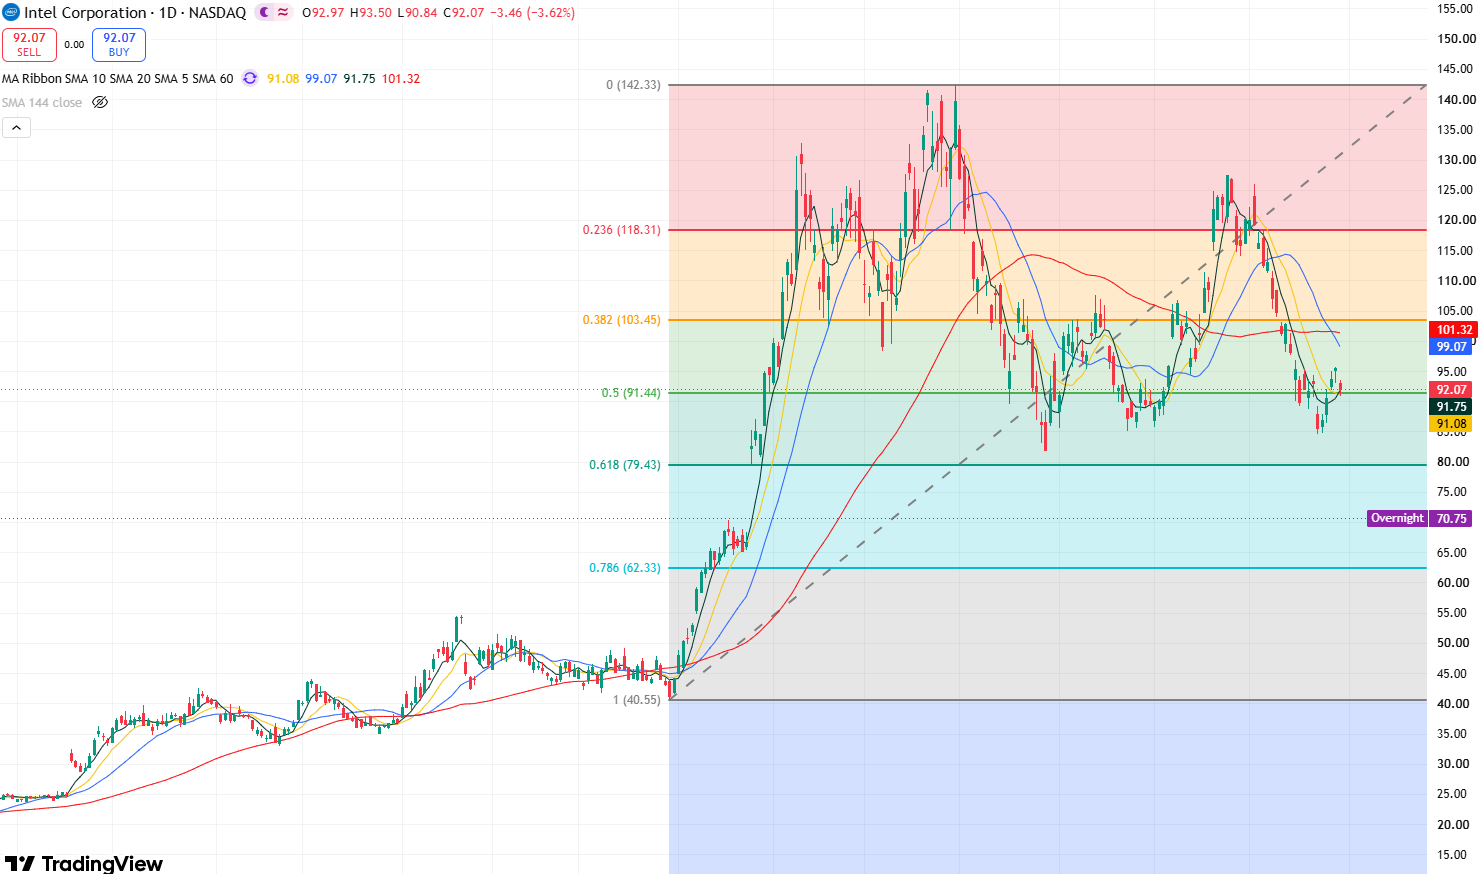
Intel stock daily chart, Source: TradingView
Judging from Intel's daily price chart, the stock experienced a clear consolidation prior to the earnings report. After briefly finding support at $85, the short-term bullish structure improved, indicating potential for a continued upward rebound. However, triggered by negative earnings news, the stock plunged past the $85 support level and the July 29 low of $81.79 in after-hours trading, breaking out of its high-level range-bound phase and opening up further downside room.
Currently, if the stock continues yesterday's after-hours momentum after today's open and falls below $81.79, it means the price will first test $70 to the downside. If this level fails to hold, the stock will open up downside potential toward the key support level of $55.
Conversely, if the stock can hold $70 today, a short-term technical recovery rebound may commence, with the potential to test resistance around $80-$82. If the stock can further climb above $82, it will likely continue upward to test resistance around $85.
Nothing in this material constitutes investment advice, personal recommendation, investment research, an offer, or a solicitation to buy or sell any financial instrument. The content has been prepared without consideration of your individual investment objectives, financial situation, or needs, and should not be treated as such.
Past performance is not a reliable indicator of future performance and/or results. Forward-looking scenarios or forecasts are not a guarantee of future performance. Actual results may differ materially from those anticipated.
Mitrade makes no representation or warranty as to the accuracy or completeness of the information provided and accepts no liability for any loss arising from reliance on such information.
Recommended Articles


