



Micron Stock Price Forecast: Nvidia's Planned Rubin Ultra HBM Layer Cut and Declining Per-Unit Memory Usage May Drag on Revenue Growth
TradingKey - Nvidia's (NVDA) reduction of the HBM4 bandwidth specifications for its Rubin GPU introduces a new variable to the growth prospects of Micron Technology (MU). Nvidia's current product page lists a single-GPU bandwidth of 19.2 TB/s, down approximately 12.7% from the previous 22 TB/s, while memory capacity remains at 288GB.
The bandwidth reduction does not decrease the GPU's memory capacity, but it may alter competition among suppliers. Meanwhile, news that the Rubin Ultra may adopt 8-layer HBM affects per-system memory capacity.
For Micron Technology, the two adjustments affect product premium and sales volume respectively, requiring an evaluation of the profitability impact along different paths.
Nvidia Lowers HBM4 Bandwidth Requirements as Micron Faces Improved Supply and Premium Pressure
Micron announced in March this year that its 36GB, 12-high HBM4 designed for Vera Rubin began volume shipments in the first quarter. Therefore, the significance of this adjustment for Micron primarily lies in whether existing products can meet customer requirements more efficiently.
Lower bandwidth requirements are expected to give suppliers more room to balance operating speed, power consumption, and manufacturing yields. If more products meet delivery standards, Micron could increase effective output and spread manufacturing costs.
However, competitors may benefit as well. As more compliant products become available, Nvidia will have greater flexibility in vendor selection and procurement negotiations, which could make it more difficult for Micron to command a premium for high-performance products.
This means that the impact of reduced bandwidth on profits depends on how selling prices and costs evolve. Improved delivery efficiency can support profitability, while intensifying competition could weigh on product premiums.
Rubin Ultra Shift to 8-Layer HBM May Weigh on Revenue Growth as Per-Unit Usage Drops
Compared with bandwidth adjustments, changes in stacking layer counts have a more direct impact on memory demand. According to ZDNet, Nvidia is considering an 8-layer hybrid configuration of HBM4 and HBM4E for Rubin Ultra to alleviate thermal and yield pressures from higher-layer stacking.
If single-layer capacity and the number of stacks remain unchanged, reducing from 12 layers to 8 layers cuts the required number of DRAM dies and memory capacity per GPU by one-third. For Micron, even if GPU sales grow, its corresponding HBM sales capacity could still fall below projections based on a 12-layer configuration.
Based on this assumption, GPU shipments would need to increase by 50% to offset the impact of lower per-unit memory usage. This makes Micron's revenue growth more dependent on customers expanding purchase volumes rather than per-unit capacity upgrades.
On the other hand, reducing stacked layers is also expected to lower manufacturing costs, improve yields, and allow limited memory output to support more GPU deliveries. If easing supply bottlenecks drives complete-system shipments, the new demand could offset part of the per-unit usage decline.
Therefore, the pressure facing Micron falls mainly on high-end product premiums and per-unit sales capacity, while it may also see improvements in costs and delivery efficiency.
Micron Technical Analysis
From a technical perspective, Micron's current structure represents a pullback and retest following a rebound. As price has not broken below the 0.236 Fibonacci retracement level ($910.48), the rebound trend still has the potential to continue.
In terms of price path, after halting its decline near $849.25 in late October, the stock rebounded continuously, reclaiming several short- and medium-term moving averages and briefly approaching previous highs. However, this rebound failed to break above the previous high area around $1,108.72, followed by a long red candlestick that opened higher and closed lower, indicating that overhead selling pressure remains obvious and the rebound has not yet converted into a new structure of higher highs.
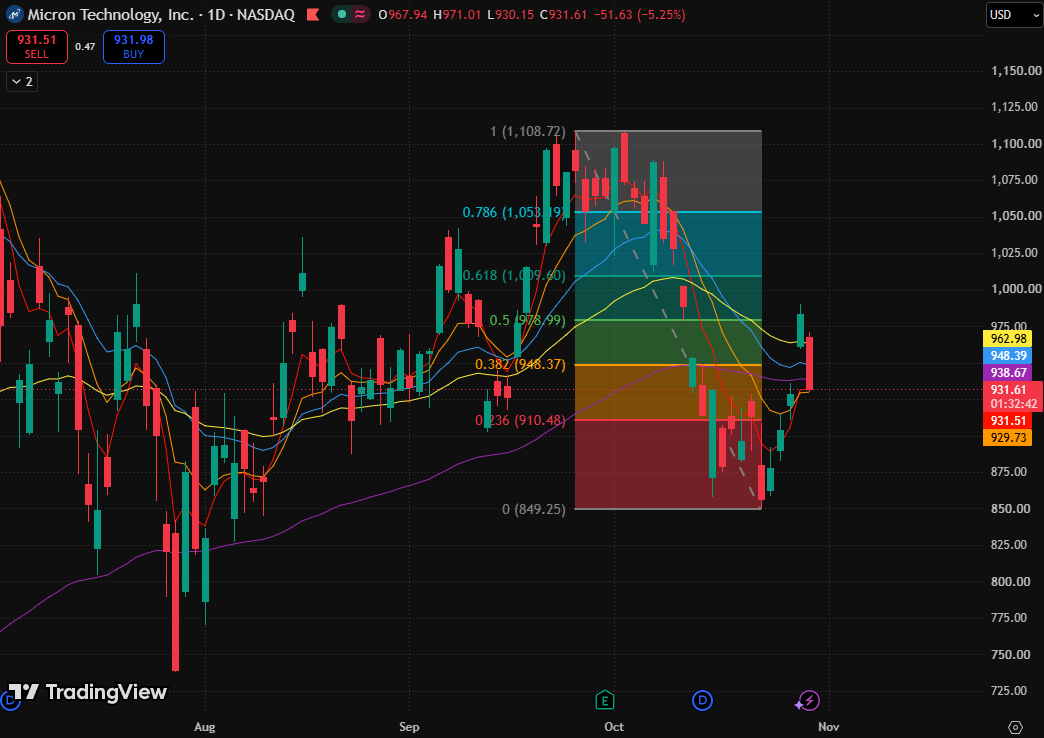
Micron daily chart, Source: TradingView
Regarding moving averages, the current price has broken below the 5-day, 10-day, 20-day, and 80-day exponential moving averages; the 160-day exponential moving average is around $929.60, currently remaining below the stock price. Such an alignment shows that short- and medium-term pressure has regained dominance, with the 160-day exponential moving average being the only long-term moving average currently providing support, though this does not constitute a complete bullish or bearish alignment.
On the upside, initial resistance lies in the moving average confluence zone of $931.27–$962.94. If the stock price reclaims the range midpoint of $948.37 and recovers the short- and medium-term moving averages, the pullback can be viewed as a normal adjustment, with prospects to test the 0.5 Fibonacci retracement level ($978.99).
If it effectively breaks below $929.60 and further loses $910.48, the view of a failed rebound will be significantly reinforced, potentially dropping to near the 0.236 Fibonacci retracement level ($910) to find support.
Nothing in this material constitutes investment advice, personal recommendation, investment research, an offer, or a solicitation to buy or sell any financial instrument. The content has been prepared without consideration of your individual investment objectives, financial situation, or needs, and should not be treated as such.
Past performance is not a reliable indicator of future performance and/or results. Forward-looking scenarios or forecasts are not a guarantee of future performance. Actual results may differ materially from those anticipated.
Mitrade makes no representation or warranty as to the accuracy or completeness of the information provided and accepts no liability for any loss arising from reliance on such information.
Recommended Articles


