



ServiceNow Inc Stock (NOW) Moved Down by 26.98% on Oct 29: A Full Analysis
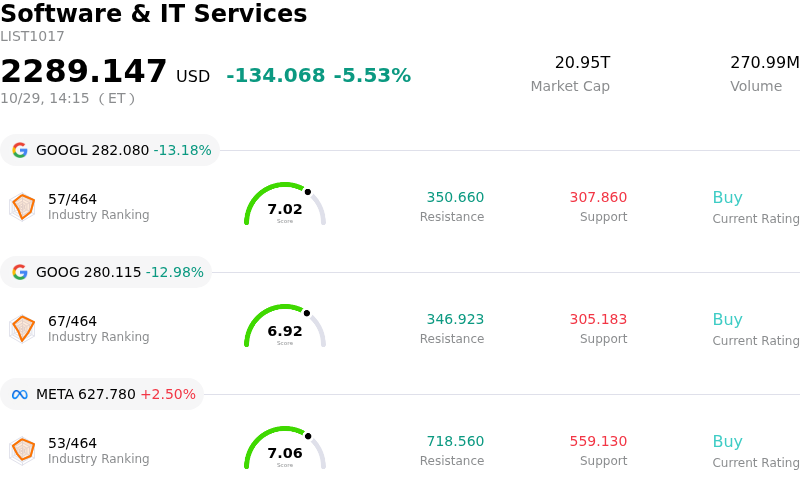
ServiceNow Inc (NOW) moved down by 26.98%. The Software & IT Services sector is down by 5.53%. The company underperformed the industry. Top 3 stocks by turnover in the sector: Alphabet Inc Class A (GOOGL) down 13.16%; Alphabet Inc Class C (GOOG) down 12.95%; Meta Platforms Inc (META) up 2.43%.
What is driving ServiceNow Inc (NOW)’s stock price down today?
ServiceNow experienced a severe sell-off following the release of its third-quarter financial results. Although top-line total revenue and subscription sales exceeded Wall Street estimates, adjusted earnings per share fell slightly short of consensus projections, snapping a multi-quarter streak of outperformance. More critically, investor disappointment focused on management's forward guidance. The company projected a deceleration in fourth-quarter current remaining performance obligations, a vital leading indicator of contracted revenue expected over the next twelve months, which trailed analyst estimates and sparked concerns over near-term enterprise demand.
Underlying profitability figures also weighed heavily on investor sentiment. A widening gap between adjusted operating margins and GAAP profitability highlighted escalating costs related to stock-based compensation and amortization from recent acquisitions. Furthermore, the debt taken on to finance strategic purchases raised annual interest expenses and shifted the company's balance sheet away from its historical net-cash posture. While management emphasized a capital-efficient operational model and raised its annual contract value target for artificial intelligence solutions, the combination of margin pressure and increased leverage diluted market enthusiasm despite modest upward revisions to full-year subscription guidance.
The sharp downturn reflects broader market sensitivity surrounding enterprise software-as-a-service business models and high-valuation growth equities. Concerns regarding potential artificial intelligence disruption and software seat cannibalization continue to overhang enterprise software providers, prompting investors to demand flawless execution. Even as the enterprise software provider expanded its strategic AI alliances and raised its free cash flow margin target, the market prioritized near-term contract growth metrics over long-term strategic narratives. Wall Street analysts remain divided between long-term confidence in enterprise AI adoption and near-term caution regarding valuation multiple adjustments.
Technical Analysis of ServiceNow Inc (NOW)
Technically, ServiceNow Inc (NOW) shows a MACD (12,26,9) value of -4.540, indicating a neutral signal. The RSI at 28.518 suggests sell condition and the Williams %R at 99.789 suggests oversold condition. Please monitor closely.
Media Coverage of ServiceNow Inc (NOW)
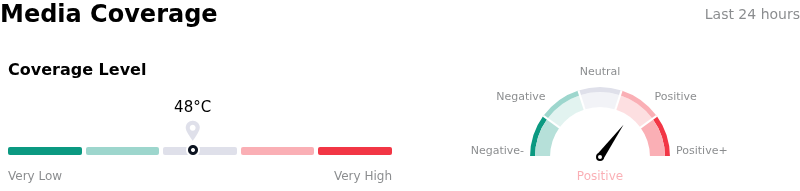
In terms of media coverage, ServiceNow Inc (NOW) shows a coverage score of 48, indicating a moderate level of media attention. The overall market sentiment index is currently in bullish zone.
Fundamental Analysis of ServiceNow Inc (NOW)
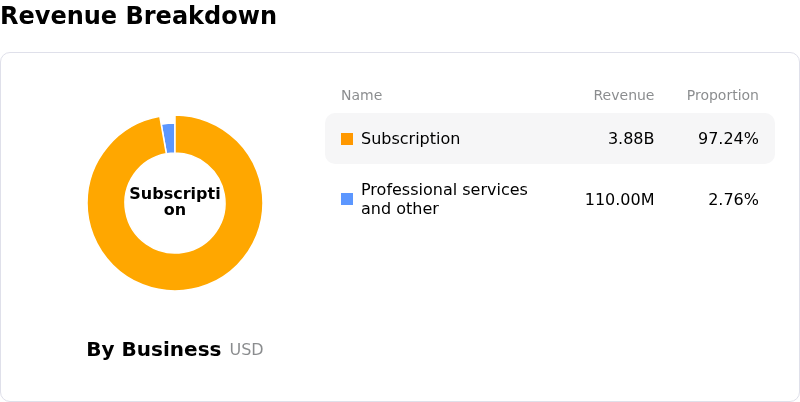
ServiceNow Inc (NOW) is in the Software & IT Services industry. Its latest annual revenue is $13.28B, ranking 28 in the industry. The net profit is $1.75B, ranking 30 in the industry. Company Profile
Over the past month, multiple analysts have rated the company as Buy, with an average price target of $0.00, a high of $0.00, and a low of $0.00.
More details about ServiceNow Inc (NOW)
Company Specific Risks:
- Slowing Forward cRPO Growth Guidance: Management projected fourth-quarter current remaining performance obligations (cRPO) growth of 18.5%, decelerating from 21% in Q3 and missing consensus expectations of 19.8%, triggering institutional concerns over enterprise software spending momentum and AI-driven market disruption.
- Q3 Earnings Miss and Acquisition Cost Drag: Adjusted earnings per share of $1.00 missed Wall Street consensus estimates of $1.02, impacted by higher interest expenses tied to debt financing for the $7.75 billion Armis acquisition as well as elevated AI infrastructure costs.
- Demand Pull-Forward and Contract Timing Shifts: Management disclosed that Q3 contracted backlog was artificially boosted by early customer renewals and a shift toward upfront on-premises deals in the public sector, which cannibalized expected Q4 contract momentum and created revenue timing noise.
- Multiple Contraction on Elevated Valuation: Entering earnings at premium forward valuation multiples, the combination of lower forward contract guidance and earnings compression sparked an immediate de-risking selloff, leaving the stock vulnerable to further valuation multiple contraction.
Nothing in this material constitutes investment advice, personal recommendation, investment research, an offer, or a solicitation to buy or sell any financial instrument. The content has been prepared without consideration of your individual investment objectives, financial situation, or needs, and should not be treated as such.
Past performance is not a reliable indicator of future performance and/or results. Forward-looking scenarios or forecasts are not a guarantee of future performance. Actual results may differ materially from those anticipated.
Mitrade makes no representation or warranty as to the accuracy or completeness of the information provided and accepts no liability for any loss arising from reliance on such information.
Recommended Articles


