



Agnico Eagle Mines Ltd Stock (AEM) Moved Down by 5.01% on Oct 29: Drivers Behind the Movement
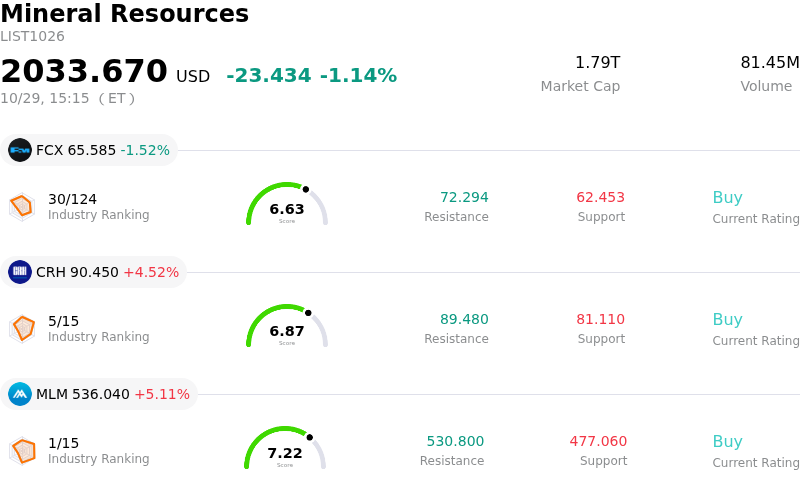
Agnico Eagle Mines Ltd (AEM) moved down by 5.01%. The Mineral Resources sector is down by 1.14%. The company underperformed the industry. Top 3 stocks by turnover in the sector: Freeport-McMoRan Inc (FCX) down 1.52%; CRH PLC (CRH) up 4.52%; Martin Marietta Materials Inc (MLM) up 5.11%.
What is driving Agnico Eagle Mines Ltd (AEM)’s stock price down today?
Macroeconomic headwinds in the precious metals sector served as a primary catalyst for the downward trajectory. Spot gold prices retreated as stronger-than-expected third-quarter U.S. economic growth and persistent inflation data bolstered market expectations for a more hawkish Federal Reserve interest rate outlook. Rising bond yields and shifting monetary policy expectations dampened short-term sentiment across precious metal producers, leading to sector-wide selling pressure.
Company-specific operational updates also weighed heavily on investor sentiment following the release of third-quarter financial results. Although the producer surpassed consensus estimates for quarterly revenue and adjusted earnings per share—driven by high realized gold prices and cash flow generation—market focus quickly pivoted to full-year guidance. Management confirmed that full-year gold output is expected to arrive near the lower end of its targeted guidance range, while cash costs and all-in sustaining costs are anticipated near the upper boundary of forecasts.
The narrowed operational outlook stems primarily from operational disruptions at the Canadian Malartic complex, where pit adjustments following earlier rock movement have constrained production and extended output reductions into future years. Compounded by persistent cost inflation for input consumables and heavy ongoing capital expenditure across expansion projects, the combination of lower volume targets and elevated cost expectations prompted institutional rebalancing, overshadowing quarterly profit beats.
Technical Analysis of Agnico Eagle Mines Ltd (AEM)
Technically, Agnico Eagle Mines Ltd (AEM) shows a MACD (12,26,9) value of -1.101, indicating a sell signal. The RSI at 40.458 suggests neutral condition and the Williams %R at 82.320 suggests oversold condition. Please monitor closely.
Fundamental Analysis of Agnico Eagle Mines Ltd (AEM)
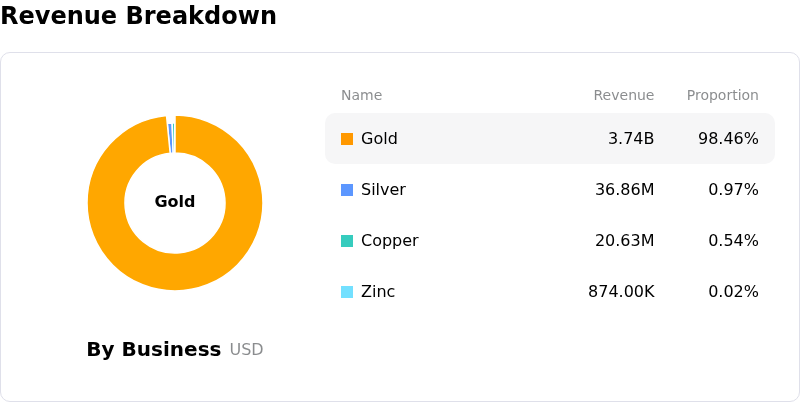
Agnico Eagle Mines Ltd (AEM) is in the Mineral Resources industry. Its latest annual revenue is $11.91B, ranking 19 in the industry. The net profit is $4.46B, ranking 5 in the industry. Company Profile
Over the past month, multiple analysts have rated the company as Buy, with an average price target of $221.54, a high of $355.00, and a low of $94.56.
More details about Agnico Eagle Mines Ltd (AEM)
Company Specific Risks:
- Canadian Malartic Mine Disruption: Operational adjustments stemming from a rock mass movement at the Barnat open pit at Canadian Malartic have constrained output, tracking total 2026 gold production toward the lower end of the guided 3.3 million to 3.5 million ounce range.
- Escalating AISC and Input Cost Pressures: Driven by diesel price spikes, labor cost inflation, and higher royalties, Q3 all-in sustaining costs (AISC) surged to $1,648 per ounce, driving full-year cost metrics toward the top of company guidance.
- Capital Intensive Expansion Execution Risks: Managing multiple long-term growth assets simultaneously—including the Odyssey underground development, Hope Bay, and Detour Lake—exposes the firm to potential cost overruns and operational delays as 2026 capex reaches up to $2.8 billion.
- Valuation Premium Sensitivity: Trading at EV/EBITDA and price-to-book multiples significantly above senior peer averages, the stock remains highly susceptible to analyst price target cuts and intraday multiple compression if gold spot prices pull back.
Nothing in this material constitutes investment advice, personal recommendation, investment research, an offer, or a solicitation to buy or sell any financial instrument. The content has been prepared without consideration of your individual investment objectives, financial situation, or needs, and should not be treated as such.
Past performance is not a reliable indicator of future performance and/or results. Forward-looking scenarios or forecasts are not a guarantee of future performance. Actual results may differ materially from those anticipated.
Mitrade makes no representation or warranty as to the accuracy or completeness of the information provided and accepts no liability for any loss arising from reliance on such information.
Recommended Articles


