



Indian Rupee outperforms US Dollar as hot US CPI data fails to lift hawkish Fed bets
- The Indian Rupee trades sharply higher against the US Dollar after the US CPI data release.
- Hotter-than-projected US CPI data fails to lift hawkish Fed expectations.
- India’s retail and wholesale Inflation remain stronger in September.
The Indian Rupee (INR) opens on a strong note against the US Dollar (USD) on Thursday. The USD/INR pair slides to near 94.95 as the US Dollar underperforms and United States (US) Treasury Yields face intense selling pressure in the aftermath of the US Consumer Price Index (CPI) data for September released on Thursday.
US Dollar Price Today
The table below shows the percentage change of US Dollar (USD) against listed major currencies today. US Dollar was the weakest against the Swiss Franc.
| USD | EUR | GBP | JPY | CAD | AUD | INR | CHF | |
|---|---|---|---|---|---|---|---|---|
| USD | -0.54% | -0.40% | -0.25% | -0.19% | 0.25% | -0.09% | -0.60% | |
| EUR | 0.54% | 0.13% | 0.25% | 0.32% | 0.82% | 0.33% | -0.07% | |
| GBP | 0.40% | -0.13% | 0.13% | 0.19% | 0.66% | 0.30% | -0.21% | |
| JPY | 0.25% | -0.25% | -0.13% | 0.05% | 0.53% | 0.06% | -0.35% | |
| CAD | 0.19% | -0.32% | -0.19% | -0.05% | 0.45% | 0.00% | -0.41% | |
| AUD | -0.25% | -0.82% | -0.66% | -0.53% | -0.45% | -0.46% | -0.87% | |
| INR | 0.09% | -0.33% | -0.30% | -0.06% | 0.00% | 0.46% | -0.40% | |
| CHF | 0.60% | 0.07% | 0.21% | 0.35% | 0.41% | 0.87% | 0.40% |
The heat map shows percentage changes of major currencies against each other. The base currency is picked from the left column, while the quote currency is picked from the top row. For example, if you pick the US Dollar from the left column and move along the horizontal line to the Japanese Yen, the percentage change displayed in the box will represent USD (base)/JPY (quote).
As of writing, the US Dollar Index (DXY), which gauges the Greenback’s value against six major currencies, trades 0.6% lower to near 101.90 after retreating from its 18-month high of 102.95 posted on Wednesday. The 10-year US Treasury Yields have fallen to near 5.10%.
The initial reaction from the US Dollar and US bond yields was strongly positive; however, they retreated swiftly as the hot US CPI report failed to lift hawkish Federal Reserve (Fed) expectations.
How was the US CPI data?
The US CPI report showed that the headline inflation accelerated to 3.7% Year-on-Year (YoY) in September from 3.4% in August, while it was expected to come in at 3.6%. The core CPI – which excludes volatile food and energy items – arrived at 2.6% YoY, higher than 2.5% estimates and the previous reading of 2.4%.
On a monthly basis, the headline CPI grew 0.6%, as expected, faster than the prior release of 0.4%. The core figure rose steadily by 0.3%, beating 0.2% estimates.
The CME FedWatch tool shows that the influence of hotter-than-projected US CPI report remains limited on Fed’s interest rate prospects. The odds of the Fed hiking interest rates in the policy meeting later this month have increased marginally to 27% from 22% seen before the data release. However, traders remain confident that the Fed will deliver an interest rate hike in the December meeting.
Indian Rupee was already outperforming on RBI’s fresh measures
The Indian currency was already outperforming this week, following forceful measures by the Reserve Bank of India (RBI) to curb the US Dollar’s demand.
Analysts at Commerzbank said in a note that the RBI has rolled out several targeted steps, including "a special USD facility for state-run oil marketing companies and a reduction in the threshold for INR derivatives without an underlying asset to USD5mn from USD100mn."
The bank adds that the RBI has also "introduced a new Foreign Exchange Risk Reserve (FERR), requiring 20% of the notional value of each FX derivative transaction above USD2mn to be held with the central bank."
Surging India’s inflation supports more RBI interest rate hikes
This week, India’s CPI data for September on both retail and the wholesale levels has come in stronger, building a case for another interest rate hike by the RBI this year. Last week, the RBI hiked its key Repo Rate by 25 basis points (bps) to 5.50% and shifted its stance from “neutral” to “calibrated tightening”.
On Monday, India’s retail CPI data arrived at 5.54%, higher than 5.4% expectations and the August reading of 4.82%, but remains within the RBI’s tolerance band of 2%-6%. The WPI Inflation data on Wednesday came in at 11.39%, significantly higher than the prior release of 9.92%.
USD/INR Technical Analysis
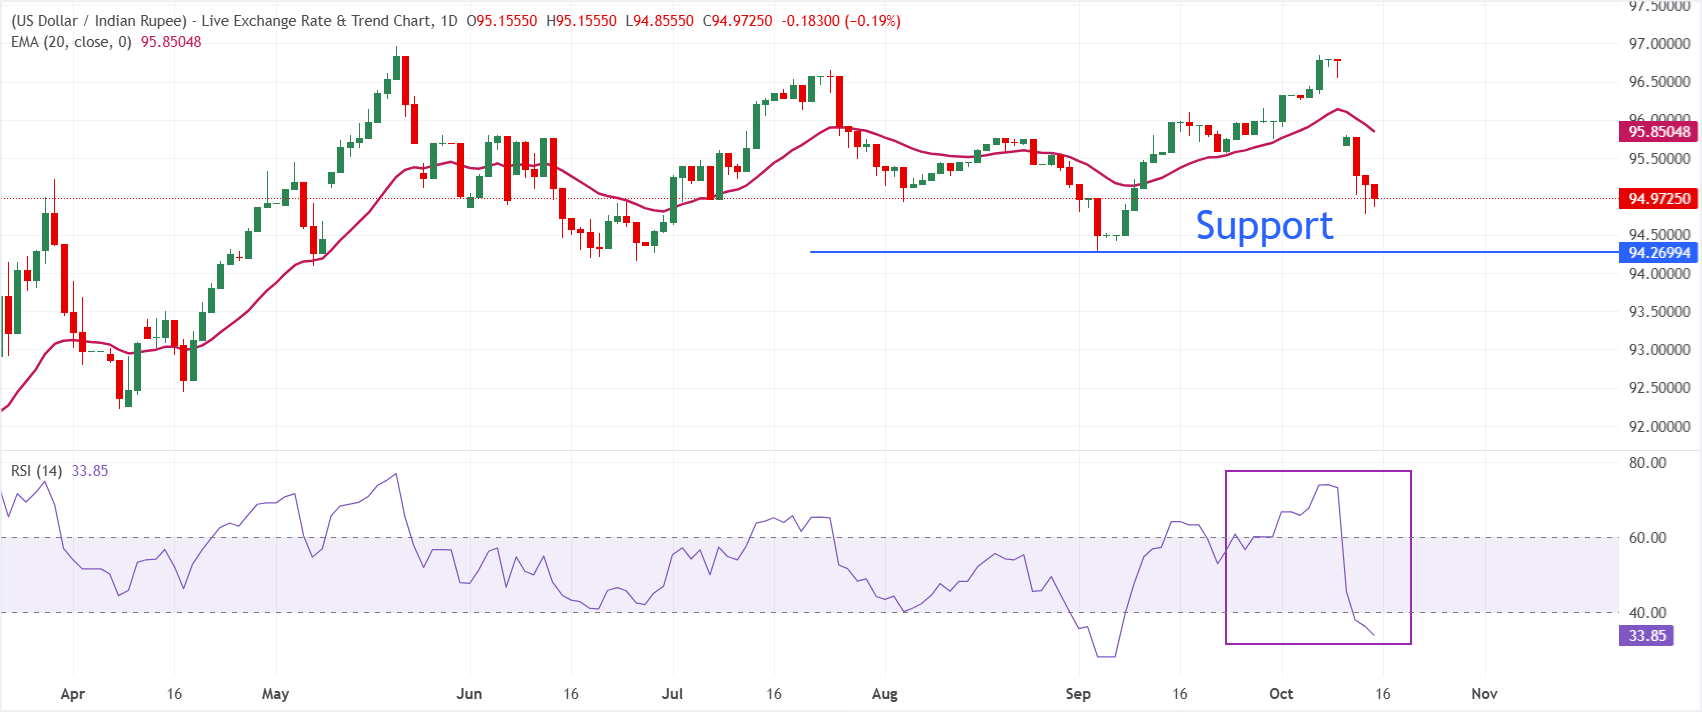
In the daily chart, USD/INR trades at 94.97, keeping a bearish near-term bias as spot holds below the 20-period exponential moving average (EMA) at 95.85. The EMA overhead suggests rallies remain vulnerable, while the Relative Strength Index (RSI) at 33.9 hovers just above oversold territory, hinting that downside momentum is still dominant but starting to lose some intensity.
On the topside, initial resistance is clearly defined by the 20-period EMA at 95.85, and a sustained break above this barrier would be needed to ease the current bearish pressure. On the downside, the September low near 94.30 is the key support level.
(The technical analysis of this story was written with the help of an AI tool. Know more.)
Indian Rupee FAQs
The Indian Rupee (INR) is one of the most sensitive currencies to external factors. The price of Crude Oil (the country is highly dependent on imported Oil), the value of the US Dollar – most trade is conducted in USD – and the level of foreign investment, are all influential. Direct intervention by the Reserve Bank of India (RBI) in FX markets to keep the exchange rate stable, as well as the level of interest rates set by the RBI, are further major influencing factors on the Rupee.
The Reserve Bank of India (RBI) actively intervenes in forex markets to maintain a stable exchange rate, to help facilitate trade. In addition, the RBI tries to maintain the inflation rate at its 4% target by adjusting interest rates. Higher interest rates usually strengthen the Rupee. This is due to the role of the ‘carry trade’ in which investors borrow in countries with lower interest rates so as to place their money in countries’ offering relatively higher interest rates and profit from the difference.
Macroeconomic factors that influence the value of the Rupee include inflation, interest rates, the economic growth rate (GDP), the balance of trade, and inflows from foreign investment. A higher growth rate can lead to more overseas investment, pushing up demand for the Rupee. A less negative balance of trade will eventually lead to a stronger Rupee. Higher interest rates, especially real rates (interest rates less inflation) are also positive for the Rupee. A risk-on environment can lead to greater inflows of Foreign Direct and Indirect Investment (FDI and FII), which also benefit the Rupee.
Higher inflation, particularly, if it is comparatively higher than India’s peers, is generally negative for the currency as it reflects devaluation through oversupply. Inflation also increases the cost of exports, leading to more Rupees being sold to purchase foreign imports, which is Rupee-negative. At the same time, higher inflation usually leads to the Reserve Bank of India (RBI) raising interest rates and this can be positive for the Rupee, due to increased demand from international investors. The opposite effect is true of lower inflation.
Nothing in this material constitutes investment advice, personal recommendation, investment research, an offer, or a solicitation to buy or sell any financial instrument. The content has been prepared without consideration of your individual investment objectives, financial situation, or needs, and should not be treated as such.
Past performance is not a reliable indicator of future performance and/or results. Forward-looking scenarios or forecasts are not a guarantee of future performance. Actual results may differ materially from those anticipated.
Mitrade makes no representation or warranty as to the accuracy or completeness of the information provided and accepts no liability for any loss arising from reliance on such information.
Recommended Articles


