



Ripple and Stellar outlook: XRP slips, XLM rebound faces resistance amid mixed sentiment
- XRP remains under pressure, trading below $1.500 on Thursday and down 1.72% so far this week.
- XLM extends its rebound, trading at $0.227 on Thursday after modest gains the previous day.
- Rising US Treasury yields and mixed derivatives metrics continue to cap upside momentum for XRP and XLM.
Ripple (XRP) remains under pressure, slipping below $1.500 on Thursday while Stellar (XLM) extends its rebound, trading around $0.227 but facing resistance amid mixed market sentiment. Rising US Treasury yields and mixed derivatives metrics continue to weigh on risk appetite, leaving traders cautious for both tokens.
Soaring US yields weigh on risky assets
Crypto markets are being held back by the same force weighing on broader risk assets: soaring US Treasury yields. The 5-year yield has risen above 5%, while the 10-year yield is above 5.2%, with both at 19-year highs. Surging yields are pushing investors away from risk assets, stalling upside momentum for Ripple and Stellar. These higher yields make traditional fixed-income assets more attractive than riskier investments such as cryptocurrencies, capping XRP and XLM’s outlook.
Mixed derivatives cap upside
Derivatives data shows a mixed and cautious outlook among traders. CoinGlass’ long-to-short ratios for Ripple and Stellar read 0.85 and 0.68 on Thursday, nearing the lowest levels over a month. A ratio below one indicates bearish sentiment, as traders bet that asset prices will fall.
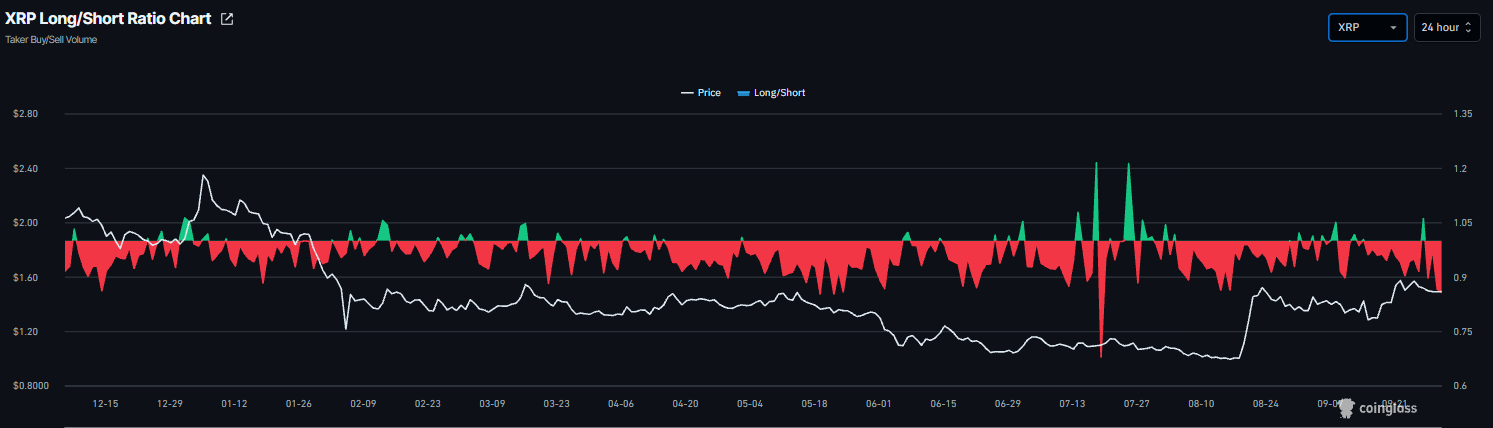
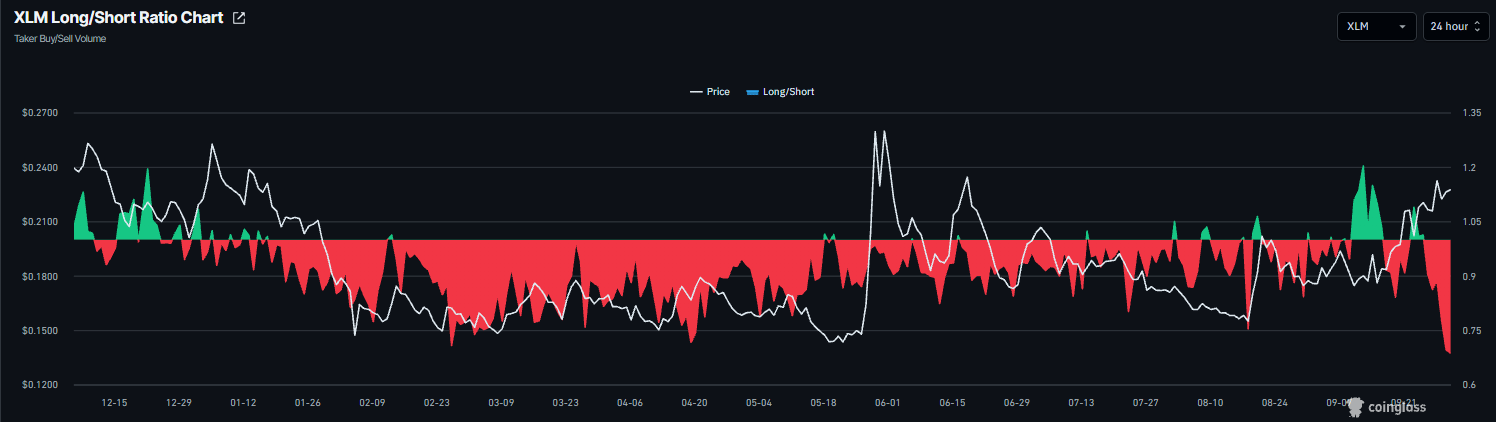
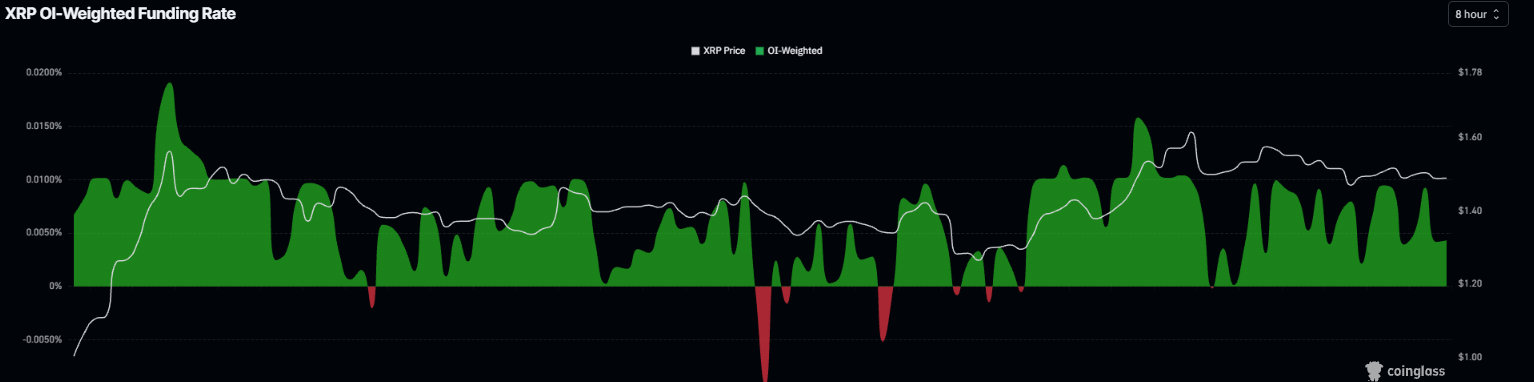
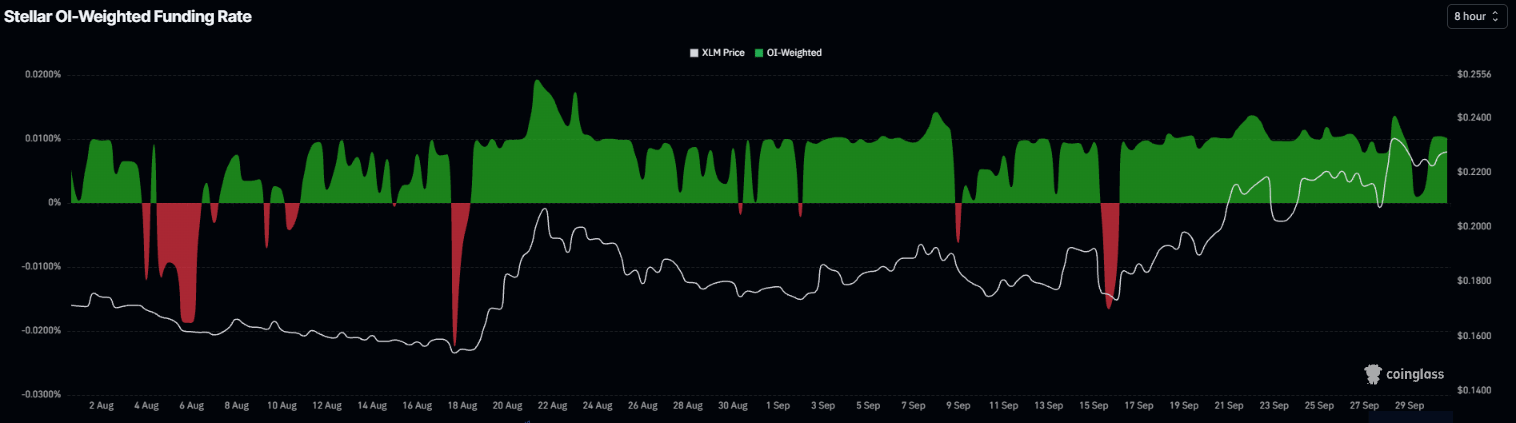
In addition, the XRP funding rate flipped positive on September 24, reading 0.0040% on Thursday. Similarly, the XLM funding rate flipped positive on September 14, reading 0.0100% on Thursday. These positive rates indicate longs are paying shorts, reflecting a bullish outlook.
XRP technical outlook: Extends pullback
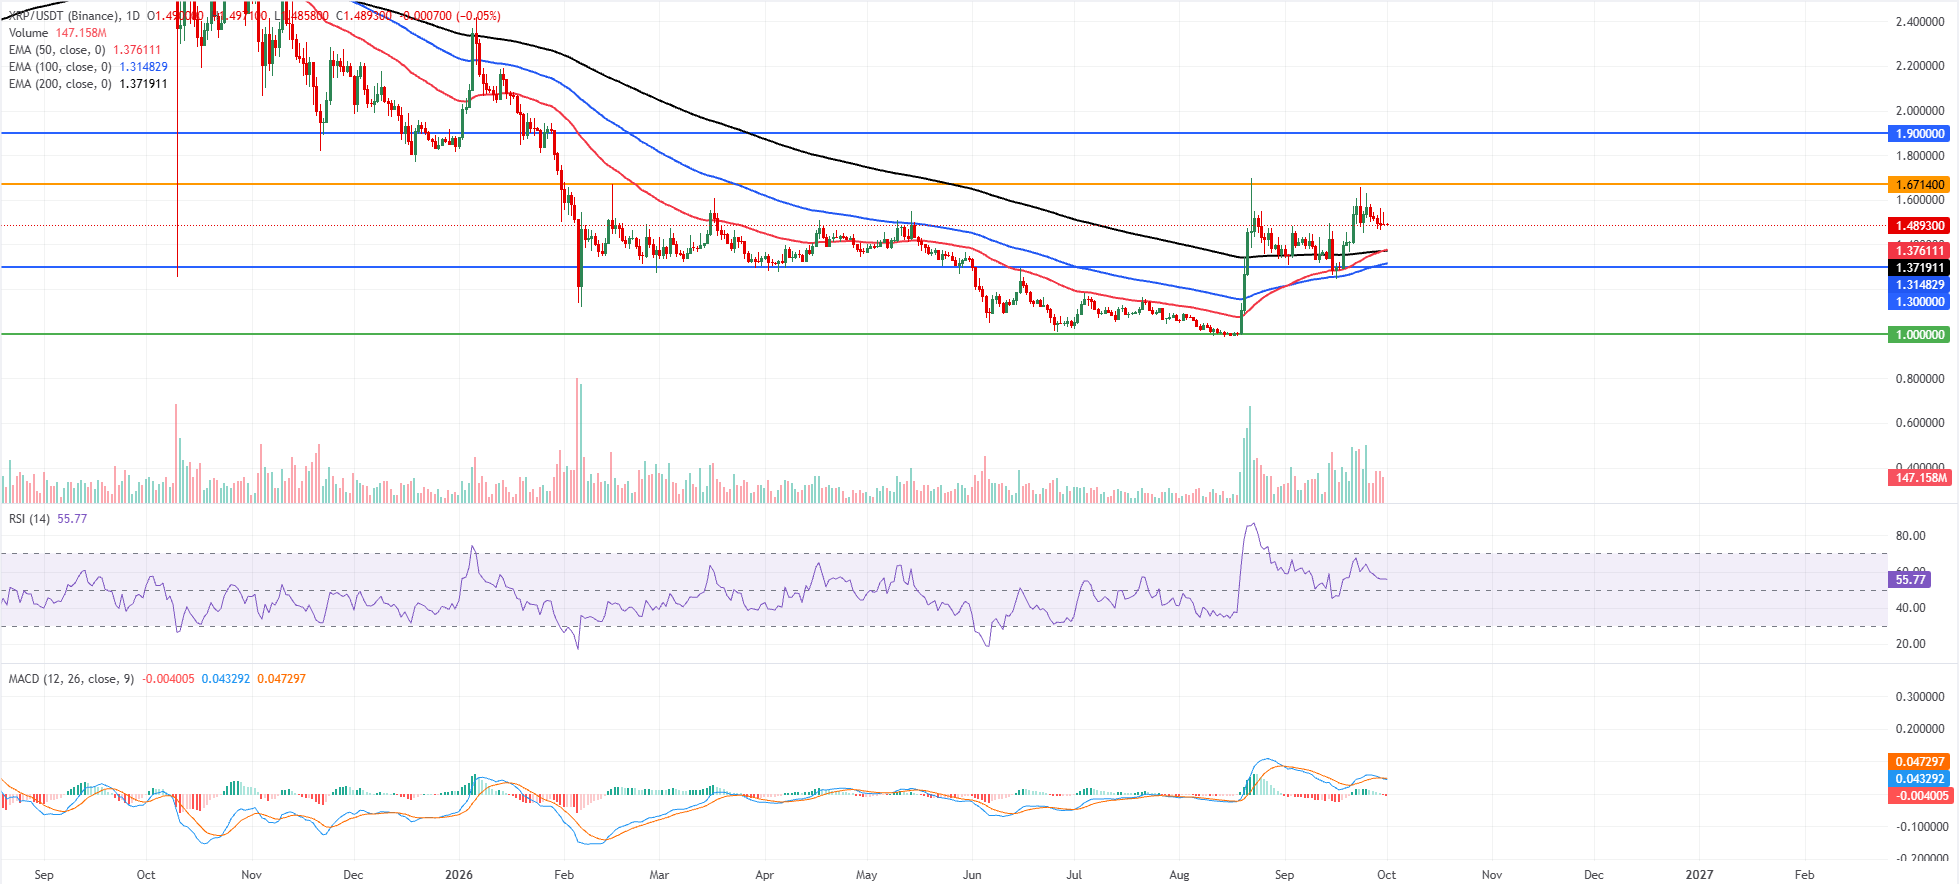
XRP price trades at $1.489 on Thursday after a slight correction so far this week. Despite this pullback, XRP remains bullish, holding well above the 50-day, 100-day, and 200-day Exponential Moving Averages (EMAs) clustered between roughly $1.376 and $1.314, which now underpin the broader uptrend.
The Relative Strength Index (RSI) at 55 stays comfortably above the neutral line, hinting at steady but not overextended buying pressure. At the same time, the Moving Average Convergence Divergence (MACD) indicator has slipped marginally below zero, suggesting that upside momentum is moderating after the recent advance rather than reversing decisively.
On the topside, initial resistance is seen at the horizontal barrier near $1.671, ahead of a stronger cap at $1.900, where fresh supply could emerge if bulls extend the rally.
On the downside, the 50-day EMA reinforces immediate support at $1.376 and the 200-day EMA at $1.371, with the 100-day EMA at $1.314 and the horizontal floor at $1.300 marking a deeper demand area; only a break below that zone would expose the more distant structural base around $1.000.
XLM technical outlook: Extends rebound
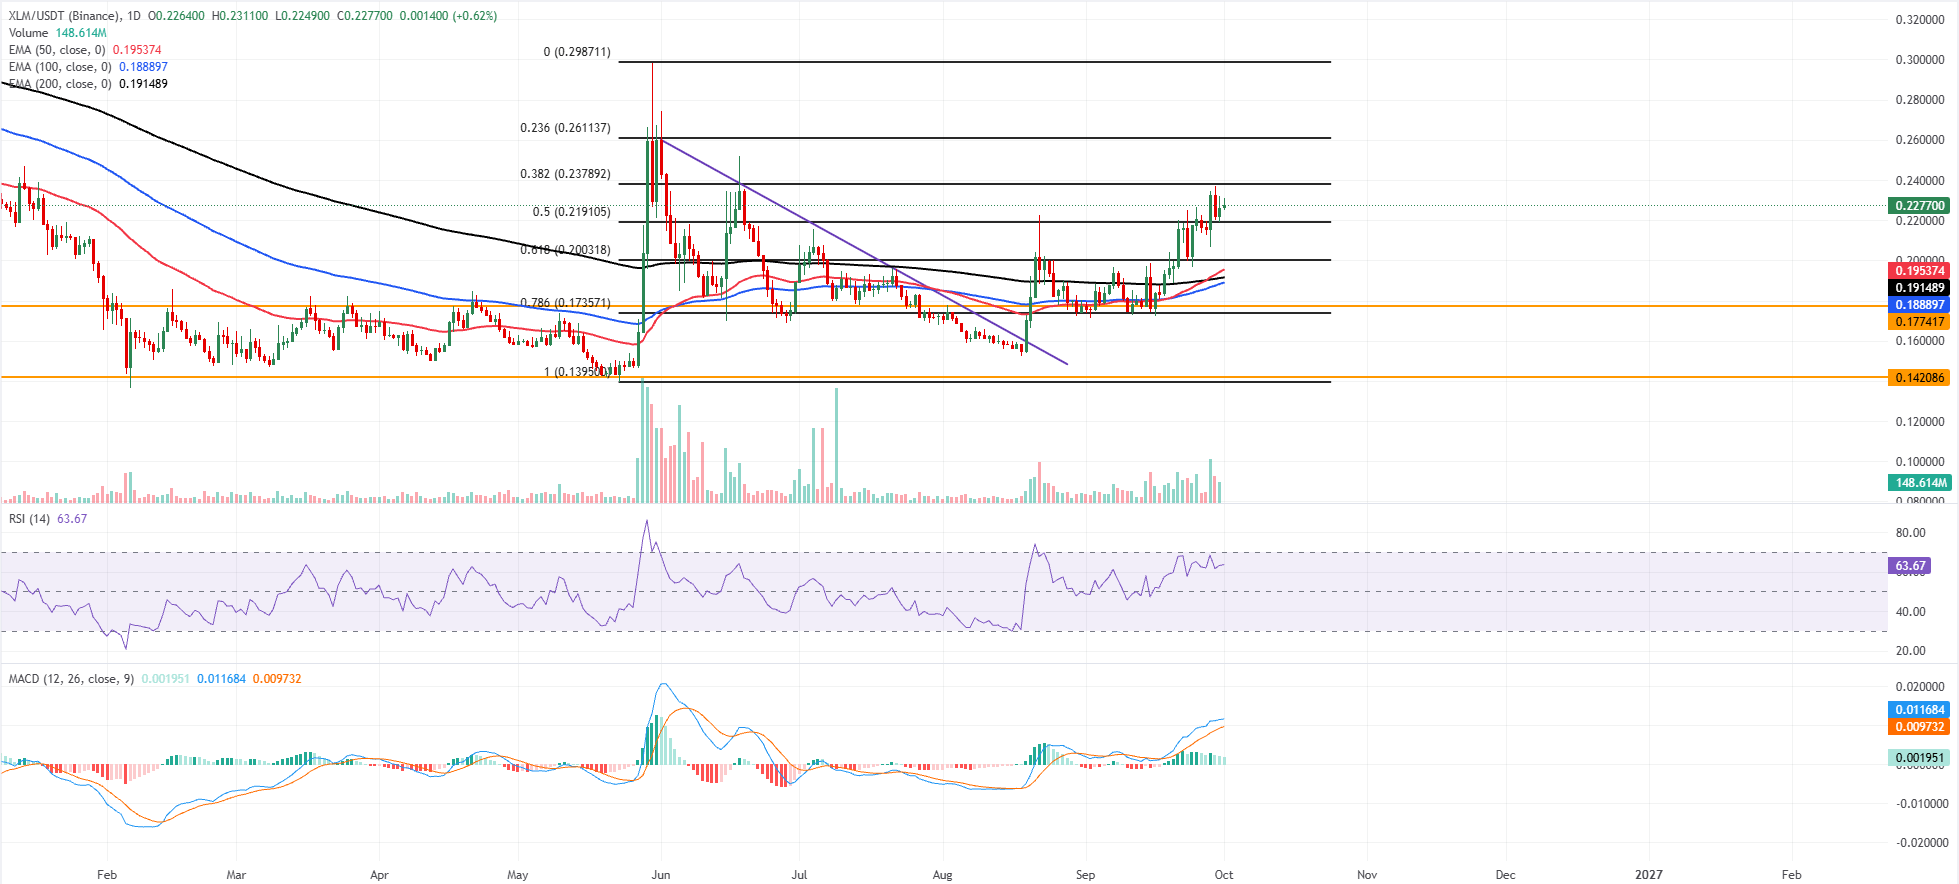
XLM price trades at $0.227 on Thursday after a slight rebound the previous day. XLM is sustaining a constructive bullish bias as price holds above the 50-day, 100-day, and 200-day EMAs clustered between roughly $0.188 and $0.195. This reclaim of the medium- and long-term EMAs, backed by a firm RSI near 63 and a positive MACD reading, suggests buyers remain in control as upside momentum builds.
On the downside, initial support aligns at the 50% retracement at $0.219, with the 61.8% Fibonacci retracement at $0.200 and the EMA cluster around $0.195–$0.191 reinforcing a broader demand zone before deeper horizontal support levels emerge at $0.177 and $0.142.
On the topside, immediate resistance is seen at the 38.2% Fibonacci retracement at $0.237, followed by the 23.6% Fibonacci retracement at $0.261 and the descending trendline resistance near $0.260, a confluence that may cap the advance unless buyers push through decisively.
(The technical analysis of this story was written with the help of an AI tool. Know more.)
Nothing in this material constitutes investment advice, personal recommendation, investment research, an offer, or a solicitation to buy or sell any financial instrument. The content has been prepared without consideration of your individual investment objectives, financial situation, or needs, and should not be treated as such.
Past performance is not a reliable indicator of future performance and/or results. Forward-looking scenarios or forecasts are not a guarantee of future performance. Actual results may differ materially from those anticipated.
Mitrade makes no representation or warranty as to the accuracy or completeness of the information provided and accepts no liability for any loss arising from reliance on such information.
Recommended Articles


