


CFDs are complex instruments and come with a high risk of losing money rapidly due to leverage. 83% of retail investor accounts lose money when trading CFDs with this provider. You should consider whether you understand how CFDs work and whether you can afford to take the high risk of losing your money.

Cardano Price Forecast: Retail support wanes as ADA tests a make-or-break level

Source Fxstreet
  • Cardano recovers nearly 2% on Tuesday, sustaining above its 50-day EMA at $0.2302 after the previous day’s roughly 8% decline.
  • ADA derivatives data shows a decline in Open Interest as funding rates flip negative, suggesting reduced speculative demand.
  • The technical outlook for ADA is mixed, with price testing a crucial support cluster near $0.2300 amid mounting selling pressure.

Cardano (ADA) price is up nearly 2% at press time on Tuesday, holding above its 50-day Exponential Moving Average (EMA) at $0.2302 and a near-term rising support trendline at $0.2264. ADA is losing retail demand in the derivatives market as its futures Open Interest declines and funding rates flip negative. The technical outlook for ADA is mixed, with the price testing a crucial support cluster near $0.2300 as easing momentum warns of a bearish shift.

ADA loses retail support

Cardano sees reduced retail participation in leveraged derivatives, implying a downside bias in investors' sentiment. CoinGlass data shows ADA futures Open Interest (OI) is down to $504.96 million on Tuesday, from $549.14 million the previous day, indicating a lower notional value of open contracts. 

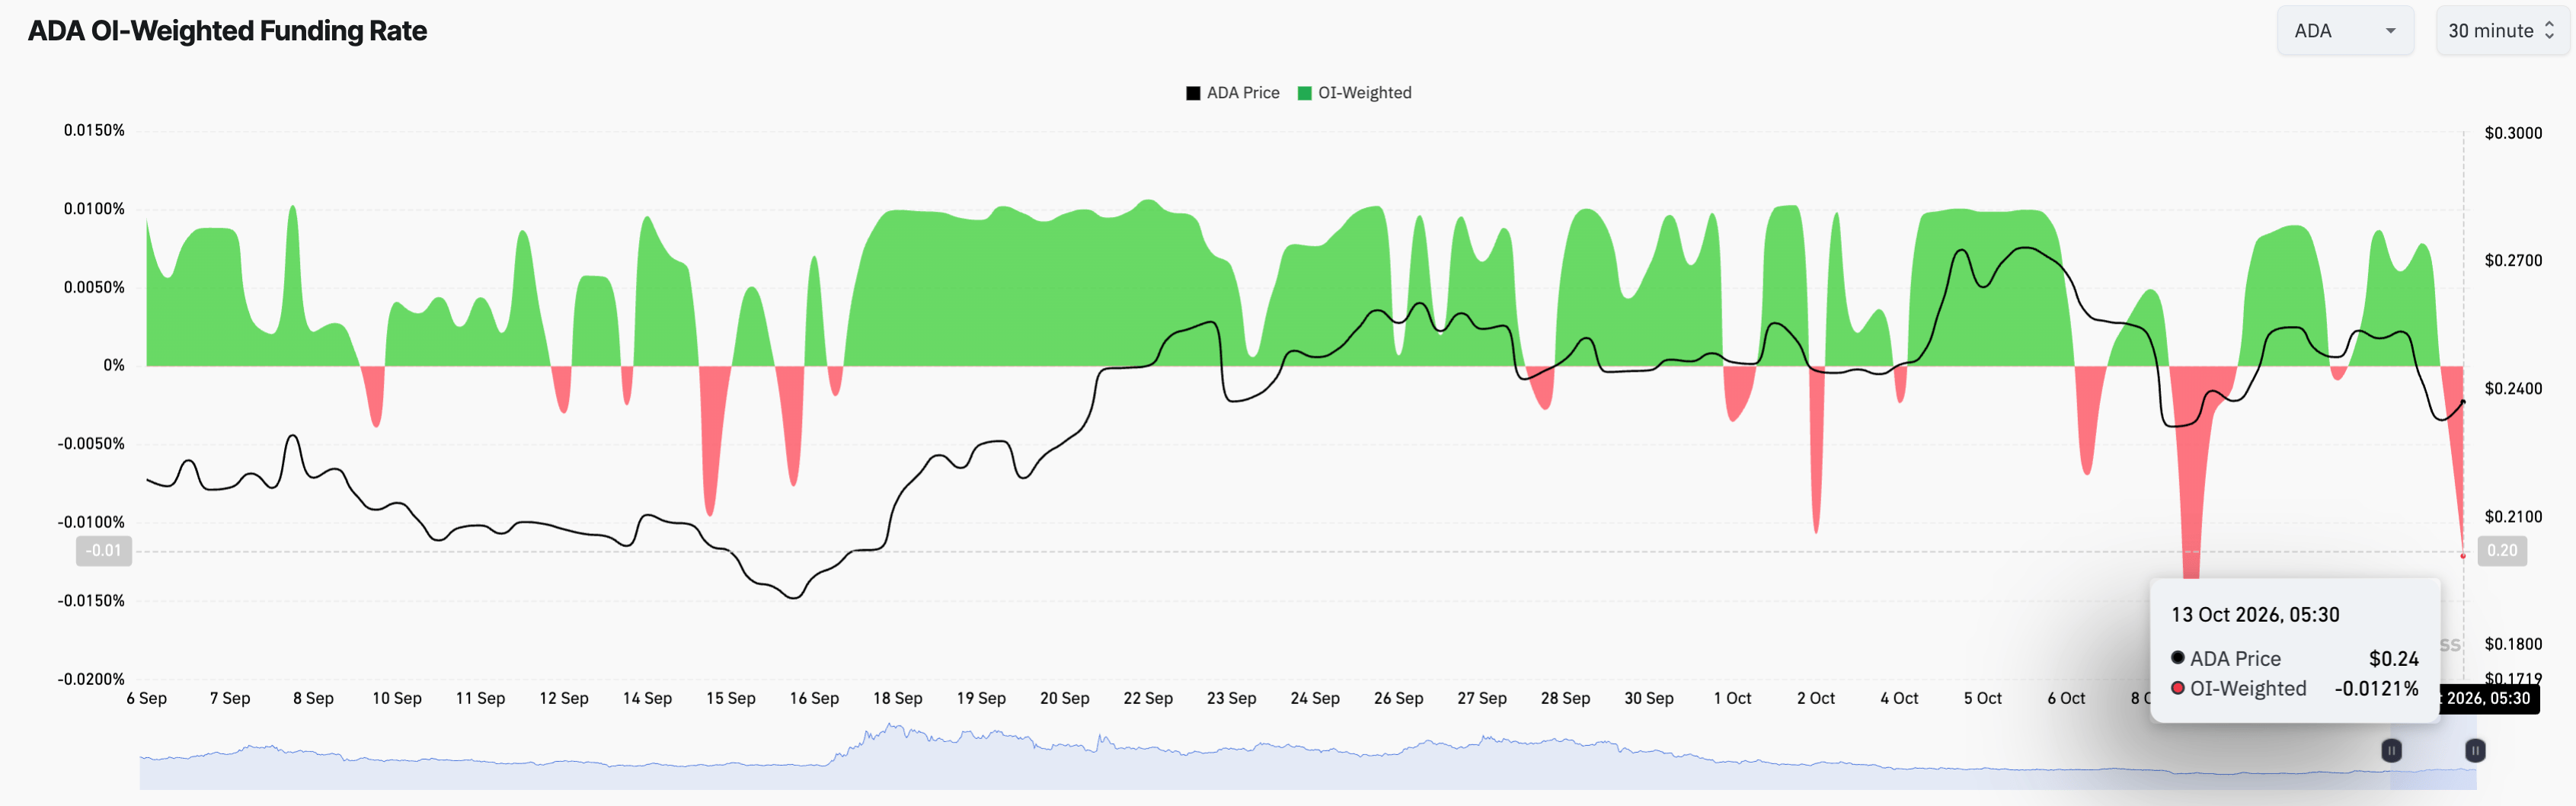
At the same time, the OI-weighted funding rate drops below zero to -0.0121% from 0.0078%, suggesting increased interest among traders in buying short positions. This implies a bearish bias among traders, as they anticipate further downside.
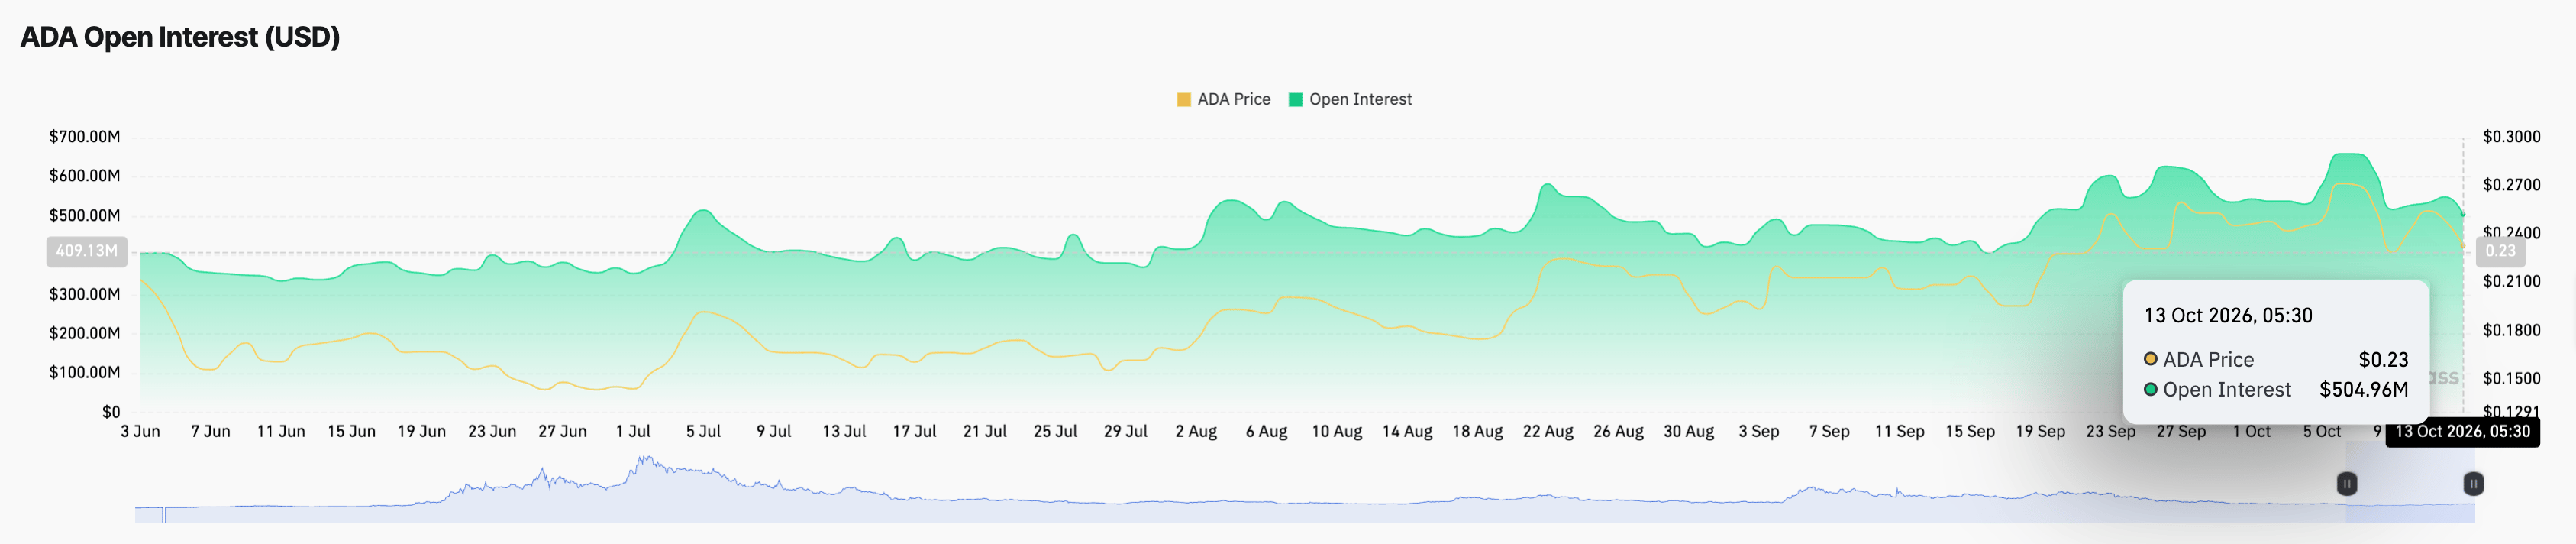
ADA Open Interest chart. Source: CoinGlass
ADA funding rate data. Source: CoinGlass

Technical outlook: Will Cardano witness a bearish trend reversal?

Cardano trades around $0.2374 at press time on Tuesday, following a decline of over 7% the previous day. ADA price is caught between the 50-day EMA at $0.2302, which underpins near-term support, and the 200-day EMA at $0.2414, which caps the topside, leaving the near-term bias neutral.

From a technical perspective, an upward-sloping trendline, connecting the July 28 and August 18 lows, with a break price of $0.2264, supports the rebound attempts. A confirmed breakout below this zone could test the August 30 low at $0.1894.

Momentum remains neutral to bearish on the daily chart, with the Moving Average Convergence Divergence (MACD) trending downward after crossing below its signal line, while the Relative Strength Index (RSI) at 48 remains neutral.

Chart Analysis ADA/USDT (Binance)
ADA/USDT daily price chart.

Looking up, Cardano must reclaim Monday's high at $0.2561 to open the path toward the February 14 high at $0.3007.

(The technical analysis of this story was written with the help of an AI tool. Know more.)

Disclaimer: The content available on Mitrade Insights is provided for informational and marketing purposes only. It has not been prepared in accordance with legal requirements designed to promote the independence of investment research and is not subject to any prohibition on dealing ahead of the dissemination of investment research
Nothing in this material constitutes investment advice, personal recommendation, investment research, an offer, or a solicitation to buy or sell any financial instrument. The content has been prepared without consideration of your individual investment objectives, financial situation, or needs, and should not be treated as such.
Past performance is not a reliable indicator of future performance and/or results. Forward-looking scenarios or forecasts are not a guarantee of future performance. Actual results may differ materially from those anticipated.
Mitrade makes no representation or warranty as to the accuracy or completeness of the information provided and accepts no liability for any loss arising from reliance on such information.
placeholder
USD/CHF ticks up to near 0.7900 as US Dollar edges higherThe USD/CHF pair edges up to near 0.7900 during the late Asian trading session on Monday. The Swiss Franc pair trades mildly higher as the US Dollar (USD) ticks up, with the US Dollar Index (DXY) rising to near 98.15.
Author  FXStreet
Dec 29, 2025
The USD/CHF pair edges up to near 0.7900 during the late Asian trading session on Monday. The Swiss Franc pair trades mildly higher as the US Dollar (USD) ticks up, with the US Dollar Index (DXY) rising to near 98.15.
placeholder
Top 3 Preisvorhersagen: Bitcoin steigt über 92.000 USD, während Ethereum und Ripple Widerstandsfähigkeit zeigenBitcoin (BTC), Ethereum (ETH) und Ripple (XRP) notieren am Montag im Plus und treiben eine breitere Erholung des Kryptowährungsmarktes voran. Bitcoin und Ethereum setzen ihre Gewinne am zweiten aufeinanderfolgenden Tag fort und überschreiten 92.000 USD bzw. 3.100 USD, während XRP sich nahe 2,00 USD stabilisiert.
Author  FXStreet
Jan 12, Mon
Bitcoin (BTC), Ethereum (ETH) und Ripple (XRP) notieren am Montag im Plus und treiben eine breitere Erholung des Kryptowährungsmarktes voran. Bitcoin und Ethereum setzen ihre Gewinne am zweiten aufeinanderfolgenden Tag fort und überschreiten 92.000 USD bzw. 3.100 USD, während XRP sich nahe 2,00 USD stabilisiert.
placeholder
Silver Price Forecast: XAG/USD remains sideways around $65, FOMC takes centre stageSilver price (XAG/USD) continues to trade in a limited range at around $65.30 during the European trading session on Tuesday.
Author  FXStreet
Aug 18, Tue
Silver price (XAG/USD) continues to trade in a limited range at around $65.30 during the European trading session on Tuesday.
placeholder
WTI Price Forecast: Climbs above $86.00 as 100-day SMA breakout comes into playWest Texas Intermediate (WTI) – the benchmark US Crude Oil price – attracts buyers for the second straight day on Tuesday as escalating US-Iran tensions and the standoff over the Strait of Hormuz continue to fuel supply concerns.
Author  FXStreet
Sep 01, Tue
West Texas Intermediate (WTI) – the benchmark US Crude Oil price – attracts buyers for the second straight day on Tuesday as escalating US-Iran tensions and the standoff over the Strait of Hormuz continue to fuel supply concerns.
placeholder
Ripple and Stellar outlook: XRP ETF demand strengthens, XLM RWA market hits $4 billion milestoneRipple (XRP) and Stellar (XLM) are showing signs of recovery on Tuesday after rebounding slightly the previous day, following double-digit corrections last week.
Author  FXStreet
Sep 01, Tue
Ripple (XRP) and Stellar (XLM) are showing signs of recovery on Tuesday after rebounding slightly the previous day, following double-digit corrections last week.
Related Instrument
goTop
quote