



Oracle Stock Reclaims $149 as Buyers Target $159 Before Earnings
TradingKey - Oracle's stock is up 5.69% when we look at the latest session close of $154.04. Buyers successfully reclaimed the $148.60-$148.75 breakout zone. The stock is now pressing $156.80-$159.23 resistance. Oracle will be going into next week's fiscal Q1 earnings with 93% OCI growth and a $638 billion backlog. Cloud demand is strong, but with negative free cash flow and rising debt and infrastructure obligations, execution risk is elevated.
OCI Growth Remains the Core Bull Case
When we look at fiscal Q4, Oracle reported $19.2 billion in revenue, a 21% year over year increase. Cloud revenue totaled $9.9 billion, up 47%, and OCI revenue surged a staggering 93%. Full-year operating cash flow totaled $32.0 billion.
Where once the market valued Oracle primarily as a mature database company, OCI has now become the main growth engine along with large AI contracts and multicloud demand.
$638 Billion Backlog Gives Exceptional Visibility
At the end of fiscal 2026, Oracle reported a $638 billion remaining performance obligations (RPO) balance, an increase of 363% from the prior year. Most of that increase was from large AI contracts in which a customer either prepaid Oracle for GPUs or supplied the GPUs.
While some of the obligation is fulfilled, and there is less of a hardware funding need, the backlog should not be considered revenue in the near term. Oracle still needs to build and connect the capacity and provide the service obligation.
Free Cash Flow and Debt Remain the Main Risks
Negative free cash flow of $23.7 billion in fiscal 2026 is due to Oracle's OCIs investments. At $32.0 billion, operating cash flow was strong, but, as with most large enterprise software companies, there is a greater reliance on debt and long term lease obligations.
This is further important in the elevated bond yield environment. Oracle's AI economics are dependent on the demand from customers, but also the cost of capital, execution, construction, and access to the supply of available energy.
EU Licensing Scrutiny Adds a Fresh Risk
EU antitrust regulators are gathering information on how Oracle software is licensed, including potential impacts on customers – for example, if software costs or licensing restrictions are increased for customers that move or try to move to the marketplace competitive clouds. No formal investigation has been opened and no violations have been found.
License business maintains high margins. If Oracle were to be compelled to offer more liberal license migration terms, the pricing would be negatively affected.
Next Week's Earnings Are the Decisive Catalyst
Oracle will announce its fiscal Q1 2027 earnings on September 10 after the market close. Analysts will focus on OCI growth, total cloud revenue, backlog conversion, capex, free cash flow, debt issuance, and forward guidance.
The recent stock movement has been a reset of sentiment. ORCL is significantly below its 12-month high. A strong earnings report will likely provide another leg higher to the stock. Large increases in capex or slower cloud growth will continue to bring the balance sheet under scrutiny.
Oracle Technical Analysis: $159.23 Is the Breakout Trigger
ORCL closed at $154.04. This closes the gap to the supplied $154.04. Price moved back above $148.60-$148.75, along with the 23.6% Fibonacci level, and the moving average at $148.29. This is generally more bullish.
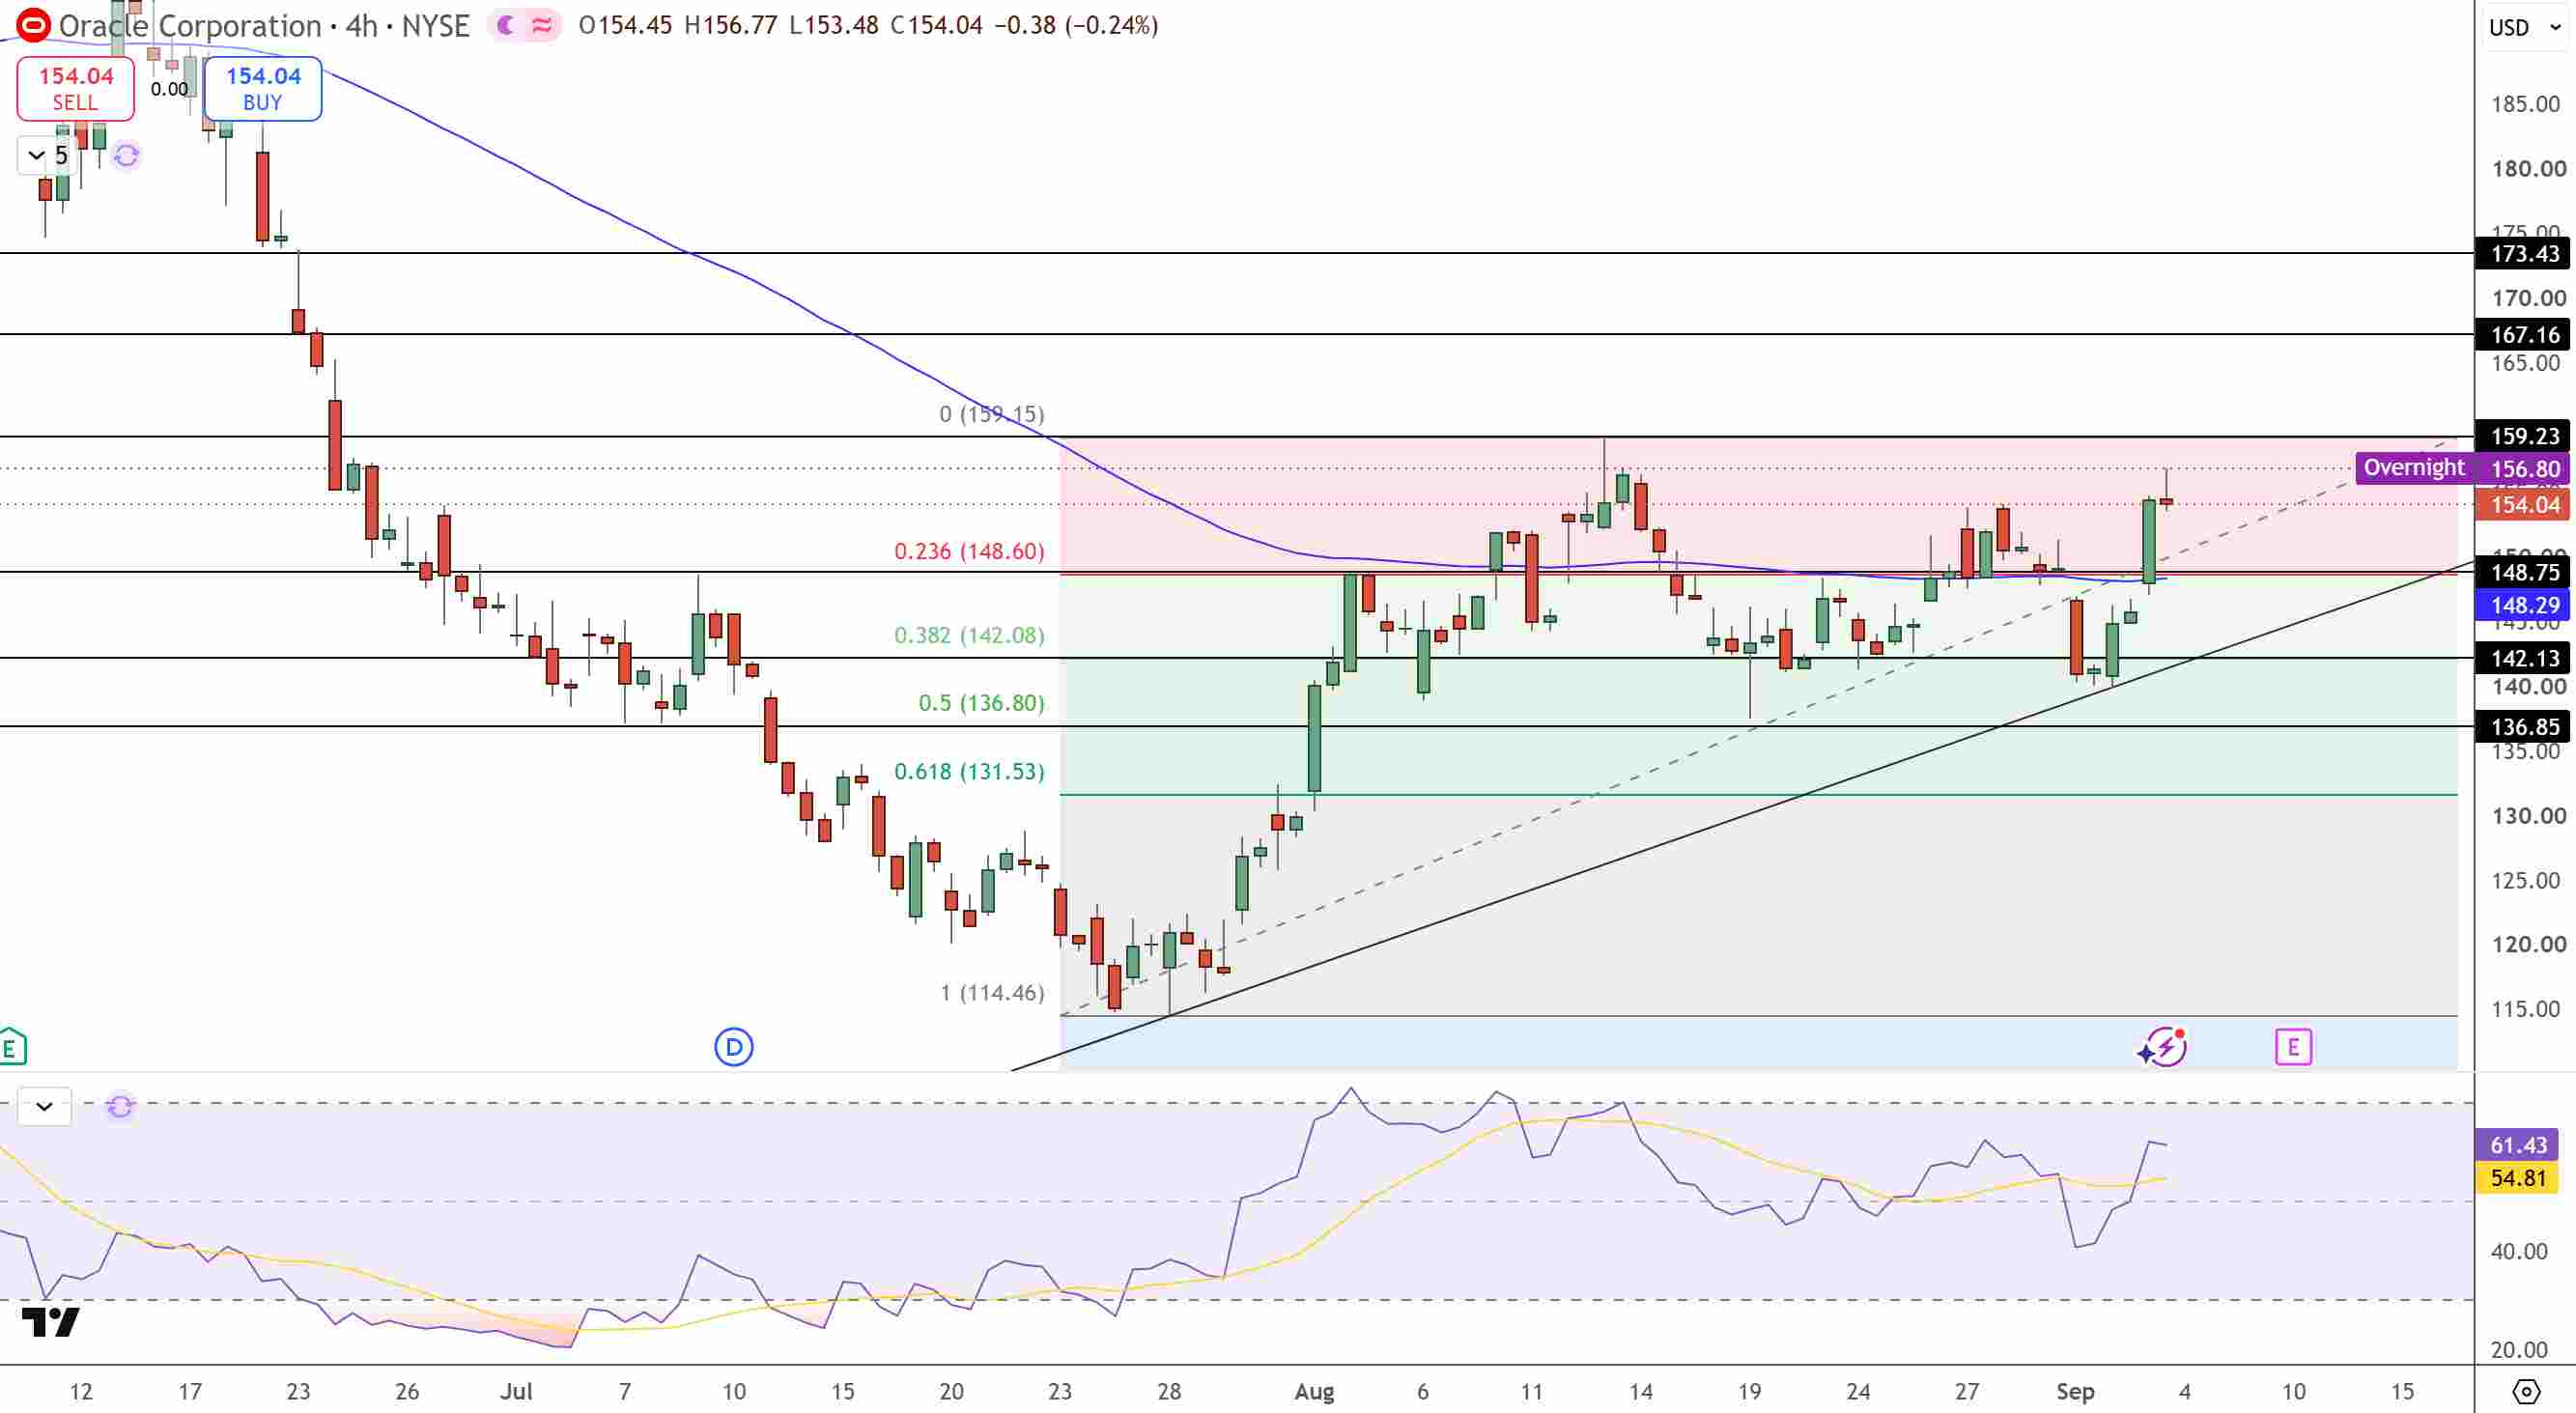
Oracle Stock Price Chart - Source: Tradingview
The first major resistance is located at $156.80-$159.23. A 4-hour close above this range would show a firm advance and bring $167.16 and $173.43 into range. Below this range, $148.60-$148.75 is important support. Loss of this puts $142.13 and the 50% Fibonacci level at $136.80 into range. RSI is at 61 and still rising, so there is still momentum without overbought conditions.
Key Levels
· Latest completed close: $154.04
· Breakout-retest support: $148.60-$148.75
· Major support: $142.13
· Breakout resistance: $156.80-$159.23
· First upside target: $167.16
· Higher target: $173.43
· Deeper support: $136.80
· RSI: Around 61, bullish but not overbought
Why is Oracle stock strengthening?
ORCL is currently benefiting from a sharp sentiment rebound, 93% OCI growth, and a potential positive result in next week's earnings due to the continued conversion of Oracle's massive AI backlog.
What level confirms another ORCL breakout?
A move above $159.23 for 4 hours confirms new upward momentum and paves the way to a possible move toward $167.16 and $173.43.
Bottom Line
There is still a robust AI-cloud fundamental base, but the stock still has a heavy balance-sheet burden. The $148.75 level was formerly a strong resistance. The stock breaking $159.23 is the next strong resistance to move $167-$173.
Nothing in this material constitutes investment advice, personal recommendation, investment research, an offer, or a solicitation to buy or sell any financial instrument. The content has been prepared without consideration of your individual investment objectives, financial situation, or needs, and should not be treated as such.
Past performance is not a reliable indicator of future performance and/or results. Forward-looking scenarios or forecasts are not a guarantee of future performance. Actual results may differ materially from those anticipated.
Mitrade makes no representation or warranty as to the accuracy or completeness of the information provided and accepts no liability for any loss arising from reliance on such information.
Recommended Articles


