



XRP (XRPUSD) Is down 1.59% on Oct 24: What Are the Risk Factors?
XRP (XRPUSD) is down 1.59% at Oct 24 21:00(ET), now at $1.2871, with a 7-day down of 1.20%.
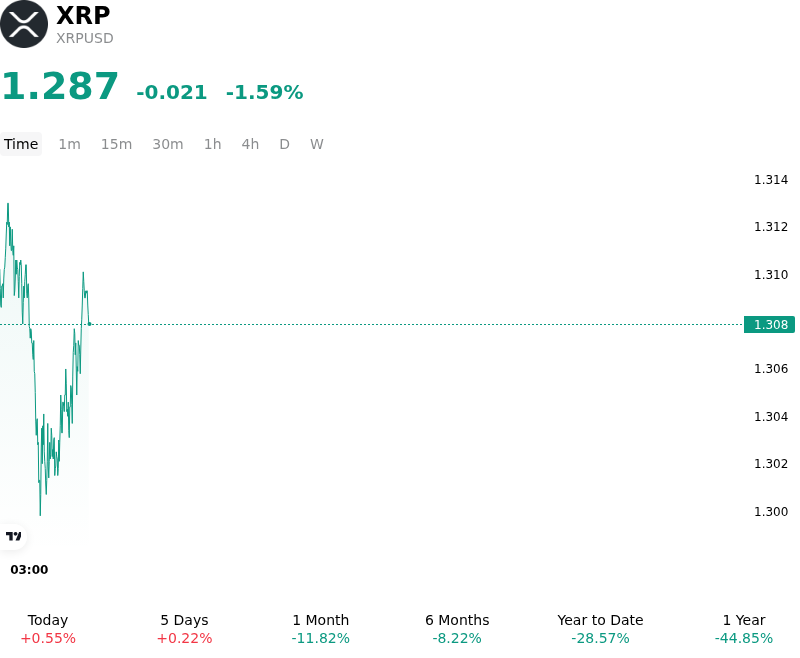
What is driving XRP (XRPUSD)’s stock price down today?
The pullback in XRP reflects broader macroeconomic headwinds and constrained digital asset liquidity. Sustained pressure from elevated U.S. Treasury yields and tight monetary expectations continued to divert capital away from risk-sensitive crypto assets toward fixed-income instruments. This risk-off tone across global macro markets dampened speculative appetite, leaving major altcoins vulnerable to sell-side pressure as forced long liquidations across crypto derivatives venues amplified intraday downside momentum.
In addition to macro liquidity constraints, asset-specific institutional flows for XRP lost momentum. Daily net inflows into spot XRP exchange-traded funds flattened following weeks of steady accumulation, removing a crucial source of spot buying pressure that had previously anchored valuations. On-chain metrics indicated elevated exchange sell activity, while key protocol catalysts faced temporary delays. Specifically, validator support for the latest XRP Ledger protocol upgrade briefly dipped below the required consensus threshold, pushing its implementation into November and encouraging short-term profit-taking among derivatives traders.
From a structural perspective, the intraday weakness represents an event-driven repricing within a broader range-bound consolidation pattern rather than a fundamental breakdown. Institutional adoption infrastructure, including prime brokerage expansion and Wall Street tokenization initiatives, continues to mature. However, near-term price action remains constrained by derivatives positioning, key technical support levels, and macroeconomic policy expectations ahead of the upcoming Federal Reserve meeting. Investors continue to monitor spot ETF flow trajectories, validator voting consensus, and global monetary liquidity as primary risk factors determining market directionality.
Technical Analysis of XRP (XRPUSD)
Technically, XRP (XRPUSD) shows a MACD (12,26,9) value of -0.009, indicating a sell signal. The RSI at 42.414 suggests neutral condition and the Williams %R at 69.466 suggests sell condition. Please monitor closely.
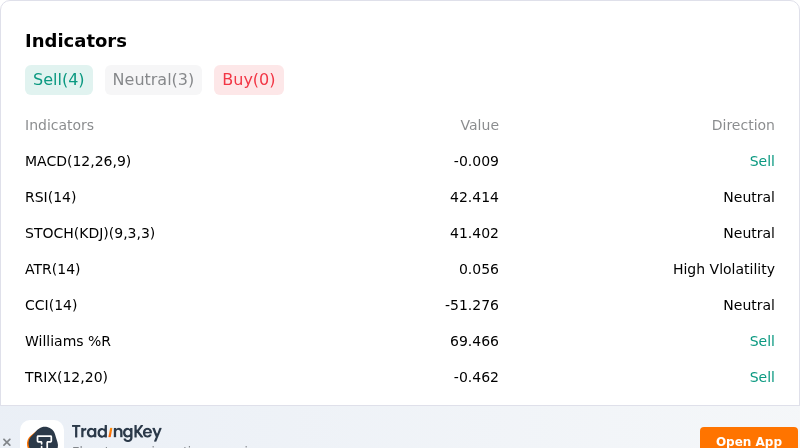
More details about XRP (XRPUSD)
Recent Events and Risks:
- Spot ETF Capital Inflow Deceleration: US-listed spot XRP ETFs have experienced a sharp moderation and pause in capital inflows after weeks of accumulation, reducing the marginal spot buying volume needed to absorb overhead sell pressure and leaving the price vulnerable to profit-taking.
- Elevated Exchange Reserves and Weakening Whale Accumulation: Total XRP exchange balances climbed toward one-year highs near 11.81 billion tokens, while 90-day average whale outflows from Binance dropped to five-year lows ($49.7 million), signaling substantial overhead supply overhang and diminished institutional buying interest at current levels.
- Derivatives Overleverage and Cascading Liquidation Risk: A large majority of net-long perpetual futures positions remain established above key support levels near $1.30 to $1.31, exposing underwater leveraged traders to heightened margin call and liquidation squeeze risks if technical support breaks downward.
- Macroeconomic Yield Volatility and Risk-Off Sentiment: Persistent US Treasury yield volatility and macroeconomic inflation concerns continue to suppress broad risk-asset appetite, exacerbating intraday volatility and weakness across major altcoins like XRP.
Nothing in this material constitutes investment advice, personal recommendation, investment research, an offer, or a solicitation to buy or sell any financial instrument. The content has been prepared without consideration of your individual investment objectives, financial situation, or needs, and should not be treated as such.
Past performance is not a reliable indicator of future performance and/or results. Forward-looking scenarios or forecasts are not a guarantee of future performance. Actual results may differ materially from those anticipated.
Mitrade makes no representation or warranty as to the accuracy or completeness of the information provided and accepts no liability for any loss arising from reliance on such information.
Recommended Articles


