



USD/JPY Price Forecast: Enters fresh upside leg on consolidation breakout
- USD/JPY ticks down to near 159.65 as the Japanese Yen outperforms.
- Japan’s PPI growth remains stronger-than-expected in December.
- The outlook of the USD/JPY remains firm as the Fed’s December rate hike looks certain.
The Japanese Yen (JPY) outperforms its major currency peers on Thursday. Against the US Dollar (USD), the Asia-Pacific currency is marginally higher even as the US Dollar Index (DXY) hits a fresh 18-month high at 103.08 during the day.
Japanese Yen Price Today
The table below shows the percentage change of Japanese Yen (JPY) against listed major currencies today. Japanese Yen was the strongest against the Australian Dollar.
| USD | EUR | GBP | JPY | CAD | AUD | NZD | CHF | |
|---|---|---|---|---|---|---|---|---|
| USD | 0.07% | 0.11% | -0.10% | 0.04% | 0.22% | 0.20% | -0.07% | |
| EUR | -0.07% | 0.04% | -0.16% | -0.04% | 0.15% | 0.12% | -0.14% | |
| GBP | -0.11% | -0.04% | -0.19% | -0.08% | 0.11% | 0.08% | -0.18% | |
| JPY | 0.10% | 0.16% | 0.19% | 0.13% | 0.31% | 0.27% | 0.02% | |
| CAD | -0.04% | 0.04% | 0.08% | -0.13% | 0.18% | 0.15% | -0.10% | |
| AUD | -0.22% | -0.15% | -0.11% | -0.31% | -0.18% | -0.02% | -0.29% | |
| NZD | -0.20% | -0.12% | -0.08% | -0.27% | -0.15% | 0.02% | -0.23% | |
| CHF | 0.07% | 0.14% | 0.18% | -0.02% | 0.10% | 0.29% | 0.23% |
The heat map shows percentage changes of major currencies against each other. The base currency is picked from the left column, while the quote currency is picked from the top row. For example, if you pick the Japanese Yen from the left column and move along the horizontal line to the US Dollar, the percentage change displayed in the box will represent JPY (base)/USD (quote).
As of writing, the USD/JPY pair edges down to near 159.65, but is close to its over two-month high of 159.94 posted on Wednesday.
The Japanese currency strengthens as hotter-than-projected Producer Price Index (PPI) data for October is expected to strengthen hopes of more interest rate hikes by the Bank of Japan (BoJ) in the near term.
Month-on-Month headline PPI grew by 0.7%, faster than 0.3% estimates. Inflation at the producer level was declined by 0.2% in September. On an annualized basis, the PPI unexpectedly grew at a faster pace of 7.1% against the prior release of 6.8%. The data was expected to have grown at a moderate pace of 6.5%.
Meanwhile, the US Dollar outperforms amid fears of an aggressive Federal Reserve (Fed) monetary tightening going forward.
Analysts at Rabobank highlight that the market’s response to the latest hawkish commentary from Fed officials, “including those from Waller that put the risk of a 50-bps rate hike on the table,” speaks to more than just a shift in rate expectations. They note that the market is now “fully priced for a December rate hike,” and, crucially, that these remarks were met “with no real speculation that the Fed would be pressured by political forces not to raise rates.”
Rabobank points out that “since Fed Chair Warsh surprised the market with a hawkish position at Jackson Hole in August, fears about diminished Fed credibility have dissipated.” In their view, “the results of last week’s mid-term elections suggest less reason to expect pressure from the White House,” reinforcing the perception that the central bank can proceed with policy tightening without significant political interference.
“In short,” Rabobank concludes, “markets have inferred that last week’s mid-term election result suggests that the issue of Fed credibility is likely to be diminished over the remainder of Trump’s term.” They argue that this development “should remove a significant potential hurdle from the outlook for the USD.”
USD/JPY Technical Analysis
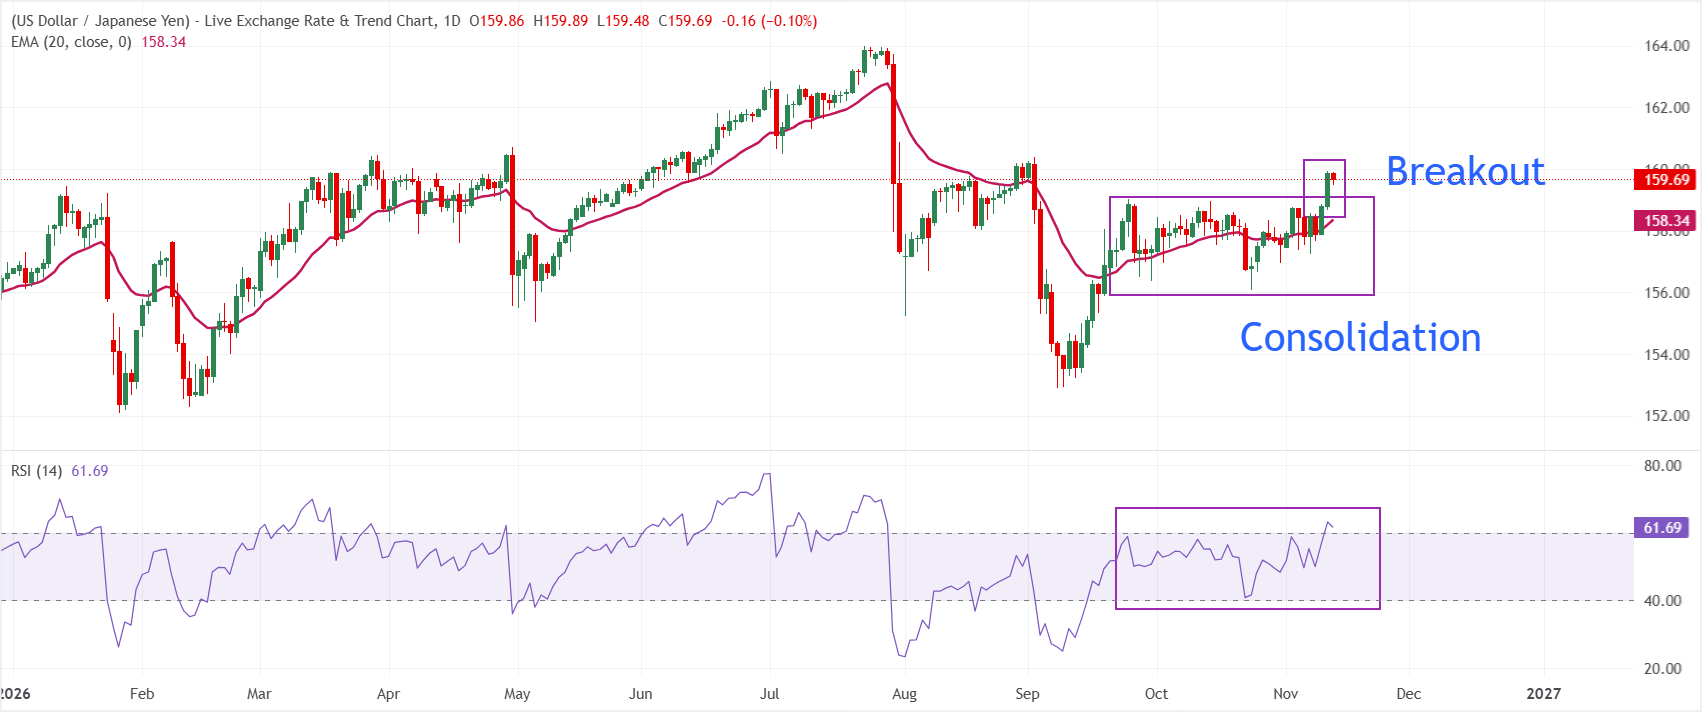
In the daily chart, USD/JPY trades at 159.69, keeping a bullish near-term bias as spot holds above the 20-day exponential moving average (EMA) at 158.34. The pair is extending its advance from last week’s pullback and the EMA clustered below price suggests underlying demand remains firm. The Relative Strength Index (14) at 61.66 stays in positive territory but shy of overbought, hinting that upside momentum is constructive without yet appearing stretched.
On the downside, initial support is located at the 20-day EMA at 158.34, where buyers are likely to defend the recent breakout area on a corrective dip. As long as USD/JPY holds above this moving average, the technical tone would favor further gains, while a daily close below it would signal fading bullish control and open room for a deeper retracement.
(The technical analysis of this story was written with the help of an AI tool. Know more.)
Economic Indicator
Producer Price Index (MoM)
The Producer Price Index released by the Bank of Japan is a measure of prices for goods purchased by domestic corporates in Japan. The PPI is correlated with the CPI (Consumer Price Index) and is a way to measure changes in manufacturing cost and inflation in Japan. A high reading is seen as anticipatory of a rate hike and is positive (or bullish) for the JPY, while a low reading is seen as negative (or Bearish).
Read more.Last release: Wed Nov 11, 2026 23:50
Frequency: Monthly
Actual: 0.7%
Consensus: 0.3%
Previous: -0.3%
Source: Statistics Bureau of Japan
Nothing in this material constitutes investment advice, personal recommendation, investment research, an offer, or a solicitation to buy or sell any financial instrument. The content has been prepared without consideration of your individual investment objectives, financial situation, or needs, and should not be treated as such.
Past performance is not a reliable indicator of future performance and/or results. Forward-looking scenarios or forecasts are not a guarantee of future performance. Actual results may differ materially from those anticipated.
Mitrade makes no representation or warranty as to the accuracy or completeness of the information provided and accepts no liability for any loss arising from reliance on such information.
Recommended Articles


