



Gold falls near $3,900 amid rising US yields and Fed hawkish bets
- Gold slips to around $3,900 amid renewed Middle East uncertainty.
- US 10-year Treasury yields climb four basis points to 4.954%.
- December Fed hike odds rise to 79%, adding more pressure on bullion.
Gold price (XAU/USD) falls on Tuesday as geopolitical tensions remain high in the Middle East, with Oil prices trimming their earlier losses, boosting the US Dollar's haven appeal due to their positive correlation. At the time of writing, XAU/USD trades at $3,926, down 0.45%.
XAU/USD retreats as Oil recovers and stronger US data and high Treasury yields pressure bullion
The uncertain outcome of the US-Iran conflict is weighing on Gold, given its current negative correlation with West Texas Intermediate (WTI), the US crude benchmark. Mixed headlines revealed that Israeli intelligence shared that Iran is considering the use of chemical weapons, according to the New York Times.
Earlier, headlines reported that Washington and Tehran were close to a deal, though Iran denied those claims, according to the IRIB news agency.
Data in the US showed that job vacancies rose, according to the Job Openings and Labor Turnover Survey (JOLTS) for September. Openings rose from 7.19 million to 7.5 million, up 4.5% from the previous month. The report showed that the hire rate was 3.4%, up from 3.3%, while total separations were unchanged at 3.3%.
Other data showed that Factory Orders improved from 0.3% MoM in the prior month to 1.8% MoM in September, the US Census Bureau reported.
Given the backdrop, the Greenback recovered some ground after the US Dollar Index (DXY) hit a daily low of 101.62. The DXY, which measures the buck’s value against six peers, is nearly unchanged at 101.78.
Along with the US Dollar, bullion prices are diving amid the rise of US Treasury yields, with the 10-year T-note up 4 basis points at 4.954%.
Of note, XAU/USD remains under bearish pressure as traders increased the odds of a Federal Reserve (Fed) rate hike in December to 79% from 74% a day earlier, according to the CME's FedWatch Tool.
The World Gold Council reduced its forecast for Gold investment growth to 200 metric tons from 400, citing weaker demand for bars and coins, but raised its estimate for central bank purchases.
Commodity traders are watching the US midterm elections, with prediction sites like Polymarket indicating that Democrats could recapture the House majority, with odds near 95%. For the US Senate, the chances are near 73%, which would complete the Dems' sweep.
Aside from this, the ADP Employment Change report is eyed on Wednesday, as is the ISM Services Purchasing Managers’ Index (PMI) for October.
XAU/USD technical outlook: Gold fails to gain traction, retreats towards $3,900
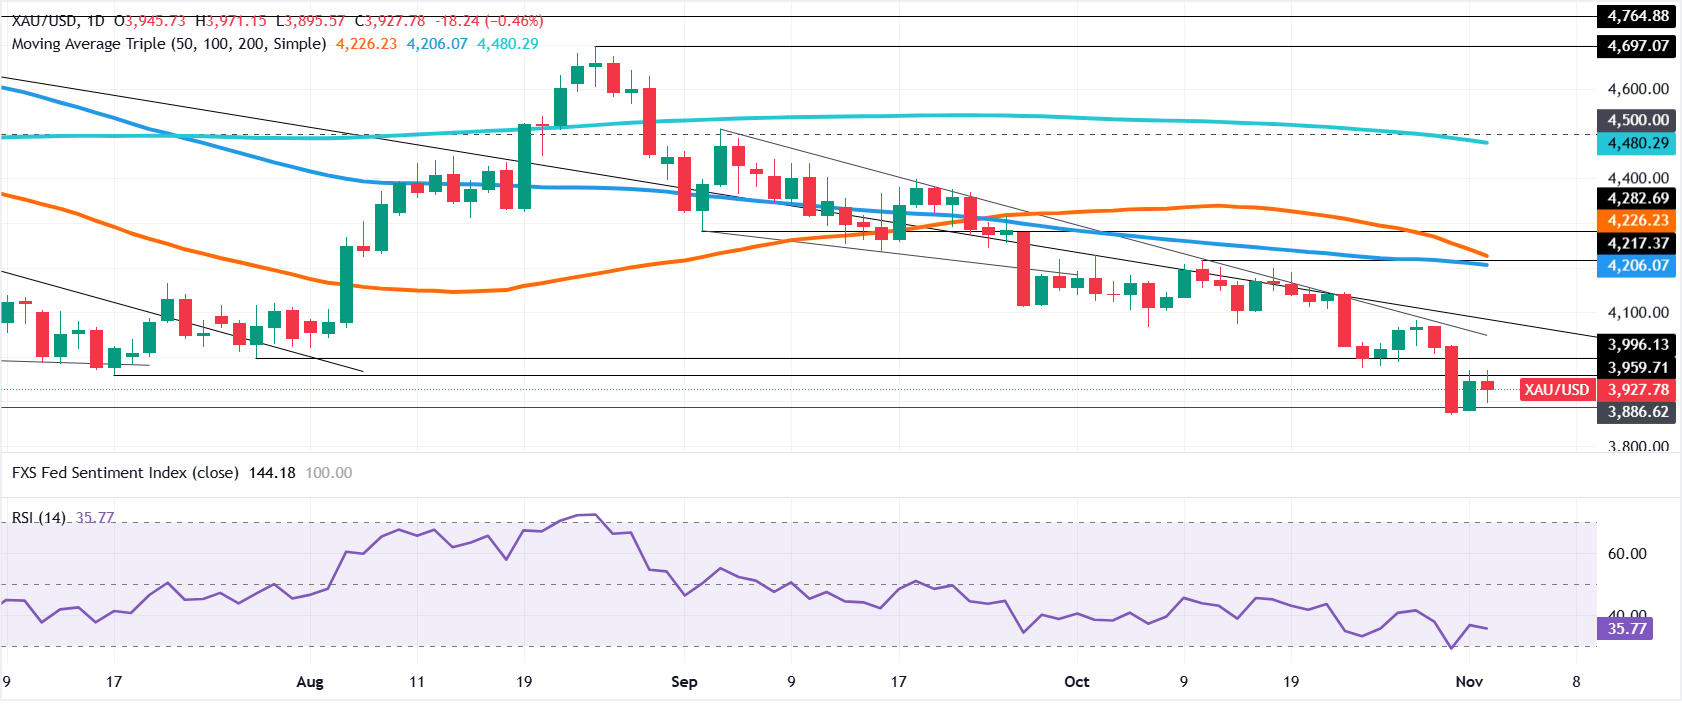
After Monday’s gains, XAU/USD is retreating but has failed to register a lower low, indicating sideways action. However, momentum is edging lower into bearish territory as depicted in the Relative Strength Index (RSI). This suggests that further downside is seen in the near term.
If Gold dives below $3,900, this paves the way to challenge the October 30 year-to-date low of $3,879, followed by the April 22, 2025, daily high, turned into support at $3,500.
On the other hand, if buyers reclaim $4,000, this paves the way to challenge a crucial resistance trendline near $4,050-$4,070, ahead of $4,100.
Gold FAQs
Gold has played a key role in human’s history as it has been widely used as a store of value and medium of exchange. Currently, apart from its shine and usage for jewelry, the precious metal is widely seen as a safe-haven asset, meaning that it is considered a good investment during turbulent times. Gold is also widely seen as a hedge against inflation and against depreciating currencies as it doesn’t rely on any specific issuer or government.
Central banks are the biggest Gold holders. In their aim to support their currencies in turbulent times, central banks tend to diversify their reserves and buy Gold to improve the perceived strength of the economy and the currency. High Gold reserves can be a source of trust for a country’s solvency. Central banks added 1,136 tonnes of Gold worth around $70 billion to their reserves in 2022, according to data from the World Gold Council. This is the highest yearly purchase since records began. Central banks from emerging economies such as China, India and Turkey are quickly increasing their Gold reserves.
Gold has an inverse correlation with the US Dollar and US Treasuries, which are both major reserve and safe-haven assets. When the Dollar depreciates, Gold tends to rise, enabling investors and central banks to diversify their assets in turbulent times. Gold is also inversely correlated with risk assets. A rally in the stock market tends to weaken Gold price, while sell-offs in riskier markets tend to favor the precious metal.
The price can move due to a wide range of factors. Geopolitical instability or fears of a deep recession can quickly make Gold price escalate due to its safe-haven status. As a yield-less asset, Gold tends to rise with lower interest rates, while higher cost of money usually weighs down on the yellow metal. Still, most moves depend on how the US Dollar (USD) behaves as the asset is priced in dollars (XAU/USD). A strong Dollar tends to keep the price of Gold controlled, whereas a weaker Dollar is likely to push Gold prices up.
Nothing in this material constitutes investment advice, personal recommendation, investment research, an offer, or a solicitation to buy or sell any financial instrument. The content has been prepared without consideration of your individual investment objectives, financial situation, or needs, and should not be treated as such.
Past performance is not a reliable indicator of future performance and/or results. Forward-looking scenarios or forecasts are not a guarantee of future performance. Actual results may differ materially from those anticipated.
Mitrade makes no representation or warranty as to the accuracy or completeness of the information provided and accepts no liability for any loss arising from reliance on such information.
Recommended Articles


