



Gold crashes toward $4,000 as hot US inflation sends Treasury yields above 5%
- Gold tumbles after retracing from a $4,146 daily high.
- US Core CPI rises 0.3% MoM, fueling expectations of further Fed tightening.
- US 10-year Treasury yields surge 12 basis points to 5.012%.
Gold (XAU/USD) tumbles during the North American session on Tuesday as Federal Reserve (Fed) officials were hawkish, expecting further tightening following the release of a red-hot inflation report in the United States (US). At the time of writing, XAU/USD trades at $4,021 after peaking near $4,146, down nearly 3%.
Bullion plunges nearly 3% on Fed hawkish rhetoric after stubborn US inflation data
US Consumer Price Index (CPI) in October rose by 0.4% MoM, down from 0.6% but exceeding forecasts of 0.3%. Core CPI, which excludes volatile items and is usually a clearer reading of inflation, expanded by 0.3% MoM, above forecasts of 0.2% and unchanged from September’s print, signaling that the disinflation process is stalling.
Earlier, Fed Governor Christopher Waller said that if core CPI showed an improvement in inflation, he would support a 25-basis-point hike. Nevertheless, if the reading came at 0.3%, he would go for a 50-basis-point increase, as he added: “Hiking only 25 basis points would put our credibility at risk, a risk I am not eager to take.”
Dallas Fed President Lorie Logan echoed some of Waller’s comments. She said that “more rapid rate hikes possibly needed this winter,” adding that the Fed is 50 basis points below a “modestly restrictive level.”
Money markets have fully priced in a 25-basis-point rate hike in December, while the odds of a 50-basis-point rate hike are at 10%, according to the CME FedWatch Tool.
Given the backdrop, Bullion prices collapsed as the US Dollar Index (DXY), which tracks the American currency’s value against six currencies, rose nearly 0.70% to 102.36. US Treasury yields, namely the 10-year T-note yield, soared 12 basis points to 5.012%, as investors grow confident that the Fed’s December rate hike is cooked.
Of note, Oil prices remain almost unchanged amid growing speculation that Washington and Tehran may agree to a ceasefire dealthat could end the conflict, which started by the end of February.
Ahead, the US economic docket will gain traction on Thursday, following the country's Veterans Day holiday, with traders eyeing jobless claims, housing data, and speeches by Fed officials.
XAU/USD technical outlook: Gold price sinks towards $4,000, further downside expected
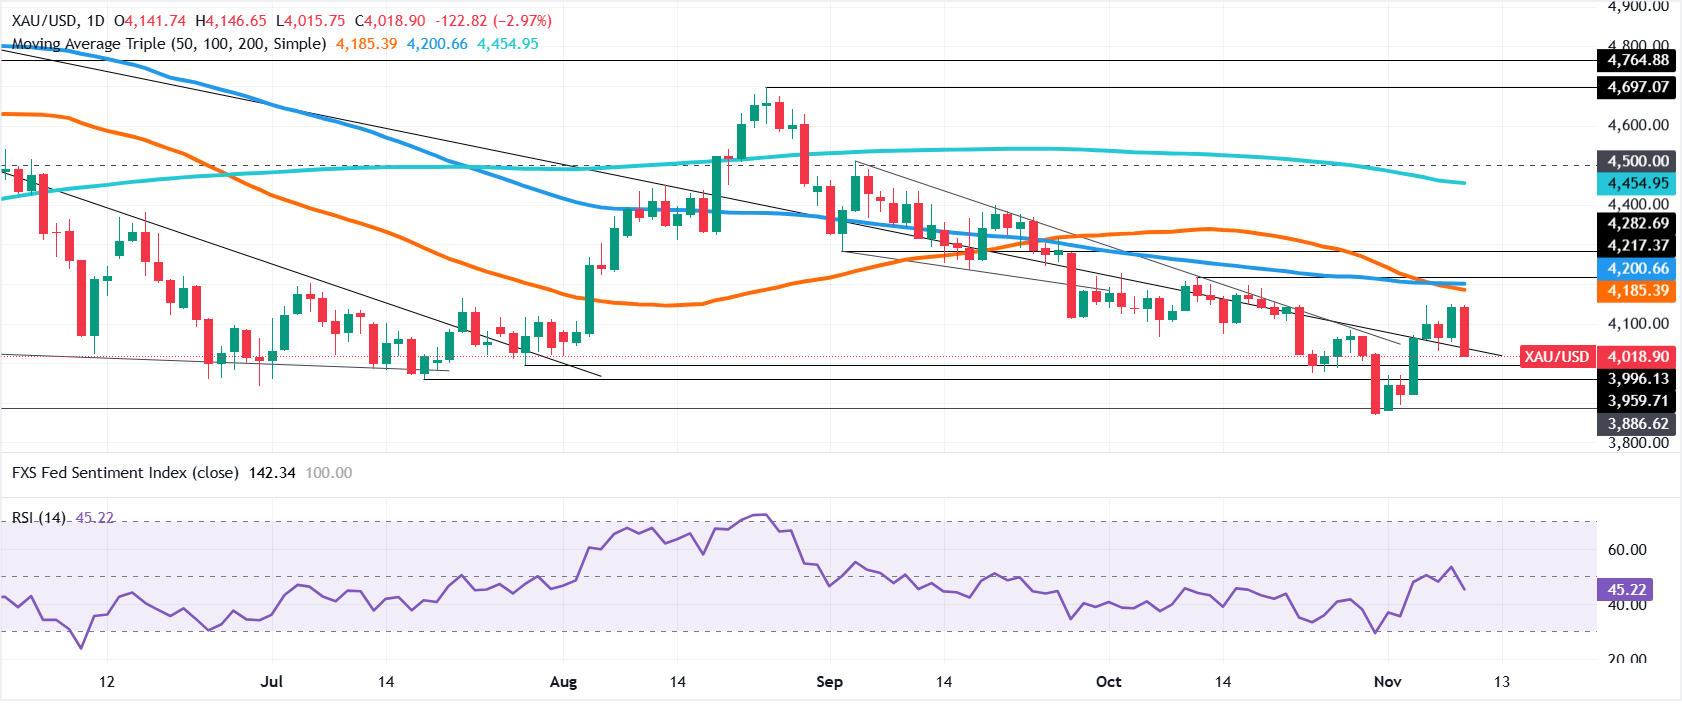
Given the fundamental backdrop, Gold collapses to a four-day low of $4,015 with sellers eyeing a decisive break below the $4,000 psychological level. Momentum shifted bearishly, as indicated by the Relative Strength Index (RSI), suggesting further downside lies ahead.
For a bearish continuation, Gold must drop below $4,000. In that outcome, a potential move towards the November 4 daily low at $3,919 is likely, followed by the October 30 year-to-date low at $3,870.
On the other hand, if Gold buyers reclaim $4,050, the next area of interest is $4,100. A breach of the latter opens the door for a recovery, with the next key resistance area being the confluence of the 50- and 100-day Simple Moving Averages (SMAs), at $4,185 and $4,200, respectively.
Gold FAQs
Gold has played a key role in human’s history as it has been widely used as a store of value and medium of exchange. Currently, apart from its shine and usage for jewelry, the precious metal is widely seen as a safe-haven asset, meaning that it is considered a good investment during turbulent times. Gold is also widely seen as a hedge against inflation and against depreciating currencies as it doesn’t rely on any specific issuer or government.
Central banks are the biggest Gold holders. In their aim to support their currencies in turbulent times, central banks tend to diversify their reserves and buy Gold to improve the perceived strength of the economy and the currency. High Gold reserves can be a source of trust for a country’s solvency. Central banks added 1,136 tonnes of Gold worth around $70 billion to their reserves in 2022, according to data from the World Gold Council. This is the highest yearly purchase since records began. Central banks from emerging economies such as China, India and Turkey are quickly increasing their Gold reserves.
Gold has an inverse correlation with the US Dollar and US Treasuries, which are both major reserve and safe-haven assets. When the Dollar depreciates, Gold tends to rise, enabling investors and central banks to diversify their assets in turbulent times. Gold is also inversely correlated with risk assets. A rally in the stock market tends to weaken Gold price, while sell-offs in riskier markets tend to favor the precious metal.
The price can move due to a wide range of factors. Geopolitical instability or fears of a deep recession can quickly make Gold price escalate due to its safe-haven status. As a yield-less asset, Gold tends to rise with lower interest rates, while higher cost of money usually weighs down on the yellow metal. Still, most moves depend on how the US Dollar (USD) behaves as the asset is priced in dollars (XAU/USD). A strong Dollar tends to keep the price of Gold controlled, whereas a weaker Dollar is likely to push Gold prices up.
Nothing in this material constitutes investment advice, personal recommendation, investment research, an offer, or a solicitation to buy or sell any financial instrument. The content has been prepared without consideration of your individual investment objectives, financial situation, or needs, and should not be treated as such.
Past performance is not a reliable indicator of future performance and/or results. Forward-looking scenarios or forecasts are not a guarantee of future performance. Actual results may differ materially from those anticipated.
Mitrade makes no representation or warranty as to the accuracy or completeness of the information provided and accepts no liability for any loss arising from reliance on such information.
Recommended Articles


