



Solana Price Forecast: ETF inflows, improving liquidity conditions lift SOL
- Solana surges over 19% this week and nears the 200-day EMA at $89, where a breakout could signal further gains.
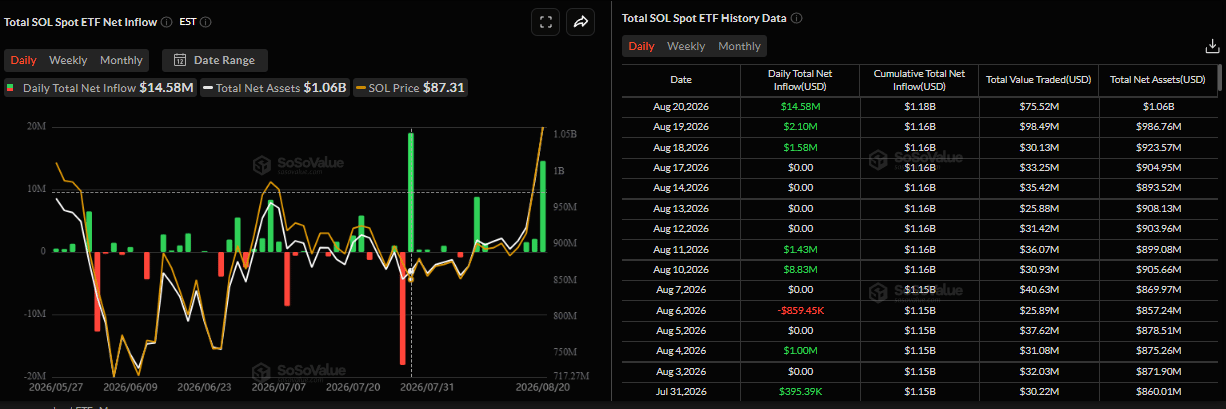
- US-listed spot ETFs recorded $14.58 million on Thursday, the highest single-day inflow since the end of July.
- The technical outlook remains constructive, with a sustained break above the 200-day EMA resistance suggesting further gains.
Solana (SOL) extends its strong weekly gains, up more than 19% so far this week, and is approaching the key 200-day EMA at $89 on Friday. This bullish price action is supported by crypto markets continuing to cheer the US Treasury’s decision to double its debt buyback operations. In addition, institutional demand for SOL continues to strengthen this week. The constructive technical outlook suggests further gains if SOL breaks above the 200-day EMA resistance.
Improving liquidity boosts Solana
The US Department of the Treasury announced on Wednesday that it will double the size of some of its buyback operations aimed at supporting liquidity in the longer-dated Treasury securities market.
Reuters reported that the Treasury will increase liquidity support buybacks for longer-dated nominal coupon securities from $2 billion to at least $4 billion per operation.
The increased Treasury buyback operations signaled improved liquidity conditions, eased liquidity concerns and boosted risk appetite. The move also contributed to a short squeeze across the crypto market, with SOL surging over 10% on Wednesday and continuing its gains to reach a high of $90.20 on Friday.
Institutional demand remains robust
Institutional demand for Solana has strengthened this week. SoSoValue data showed that SOL ETFs recorded an inflow of $14.58 million on Thursday, the highest single-day inflow since the end of July and marking the third straight day of positive inflows so far this week. If these inflows continue and intensify, SOL could extend gains.
Solana technical outlook: Close above 200-day EMA suggests further gains
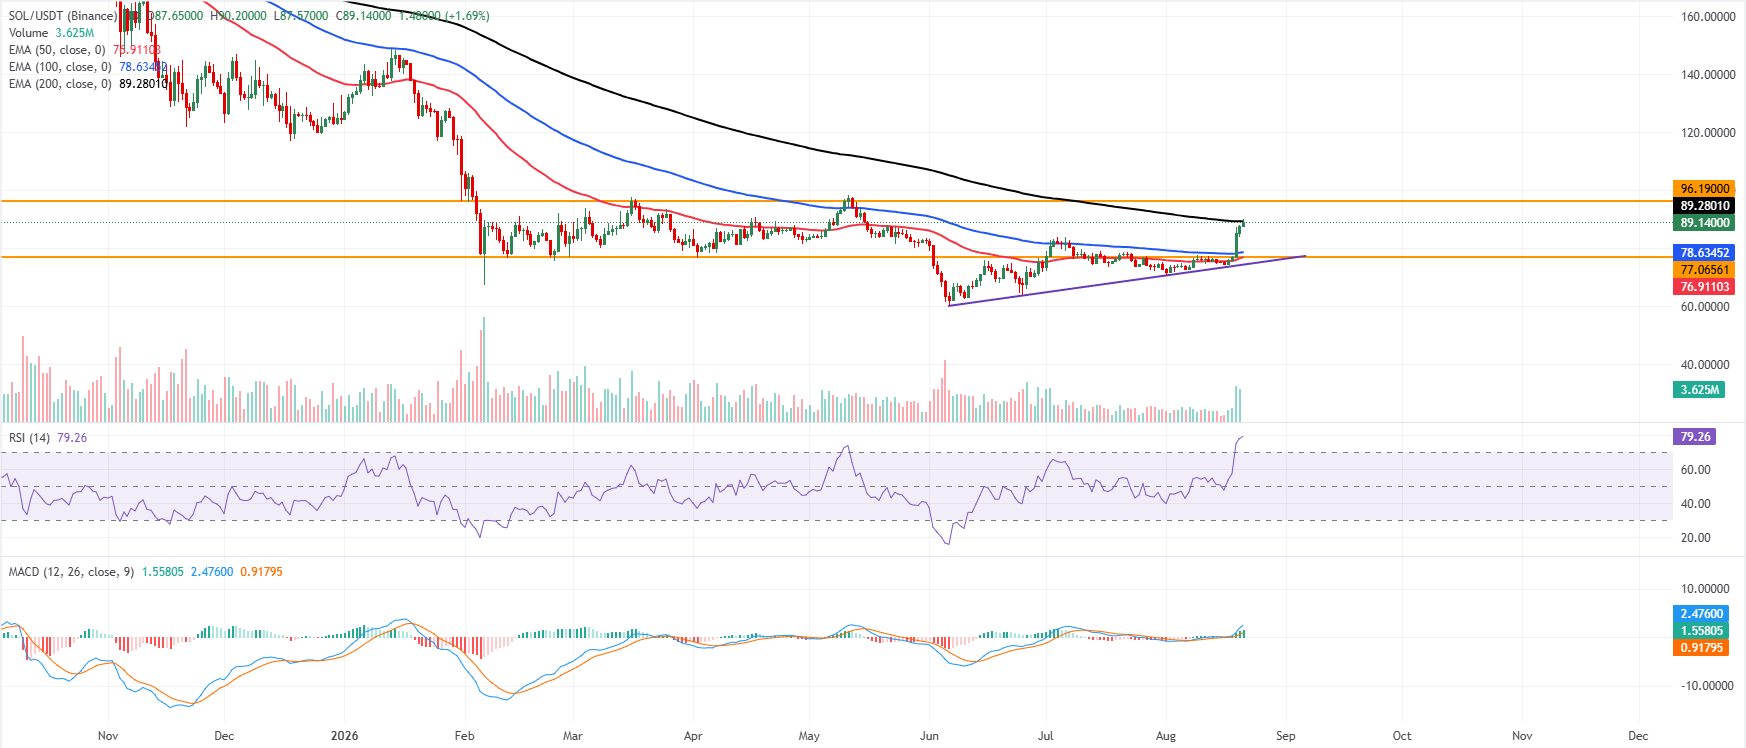
Solana price trades at $89.14 on Friday, retaining a bullish near-term bias as price holds clearly above the 50-day and 100-day Exponential Moving Averages (EMAs) at $76.91 and $78.63. However, the pair is now pressing against the 200-day EMA at $89.28, which acts as immediate overhead resistance and could cap further gains on the first attempt.
The Relative Strength Index (RSI) sits in overbought territory near 79. At the same time, the Moving Average Convergence Divergence (MACD) remains firmly positive, together suggesting strong but stretched upside momentum after the recent surge.
On the downside, initial support is seen at the recent horizontal floor around $77.07, reinforced by the underlying 100-day EMA at $78.63 and the 50-day EMA at $76.91. A deeper pullback would expose the broken rising trendline area near $74.38 as the next key demand zone.
On the topside, a sustained break above the 200-day EMA at $89.28 would open the way toward the next notable resistance around $96.19, where buyers could start to hesitate after the sharp rally.
(The technical analysis of this story was written with the help of an AI tool. Know more.)
Nothing in this material constitutes investment advice, personal recommendation, investment research, an offer, or a solicitation to buy or sell any financial instrument. The content has been prepared without consideration of your individual investment objectives, financial situation, or needs, and should not be treated as such.
Past performance is not a reliable indicator of future performance and/or results. Forward-looking scenarios or forecasts are not a guarantee of future performance. Actual results may differ materially from those anticipated.
Mitrade makes no representation or warranty as to the accuracy or completeness of the information provided and accepts no liability for any loss arising from reliance on such information.
Recommended Articles


