



Top 3 Price Predictions: Bitcoin, Ethereum, Ripple – BTC, ETH and XRP rebound as November begins after a losing October
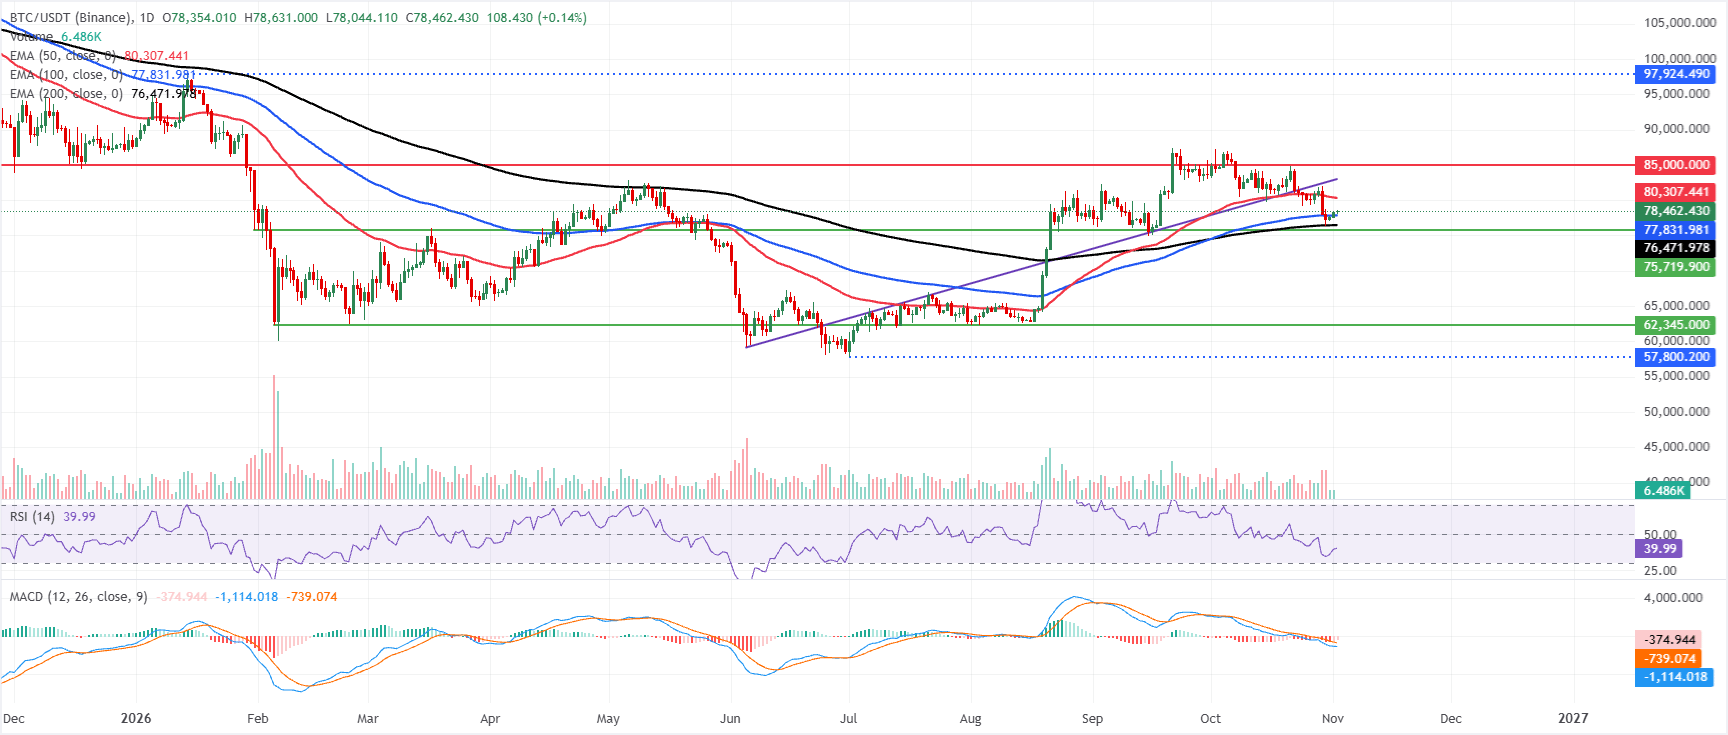
- Bitcoin extends its recovery, trading above $78,462 on Monday after finding support around the 100-day and 200-day EMAs.
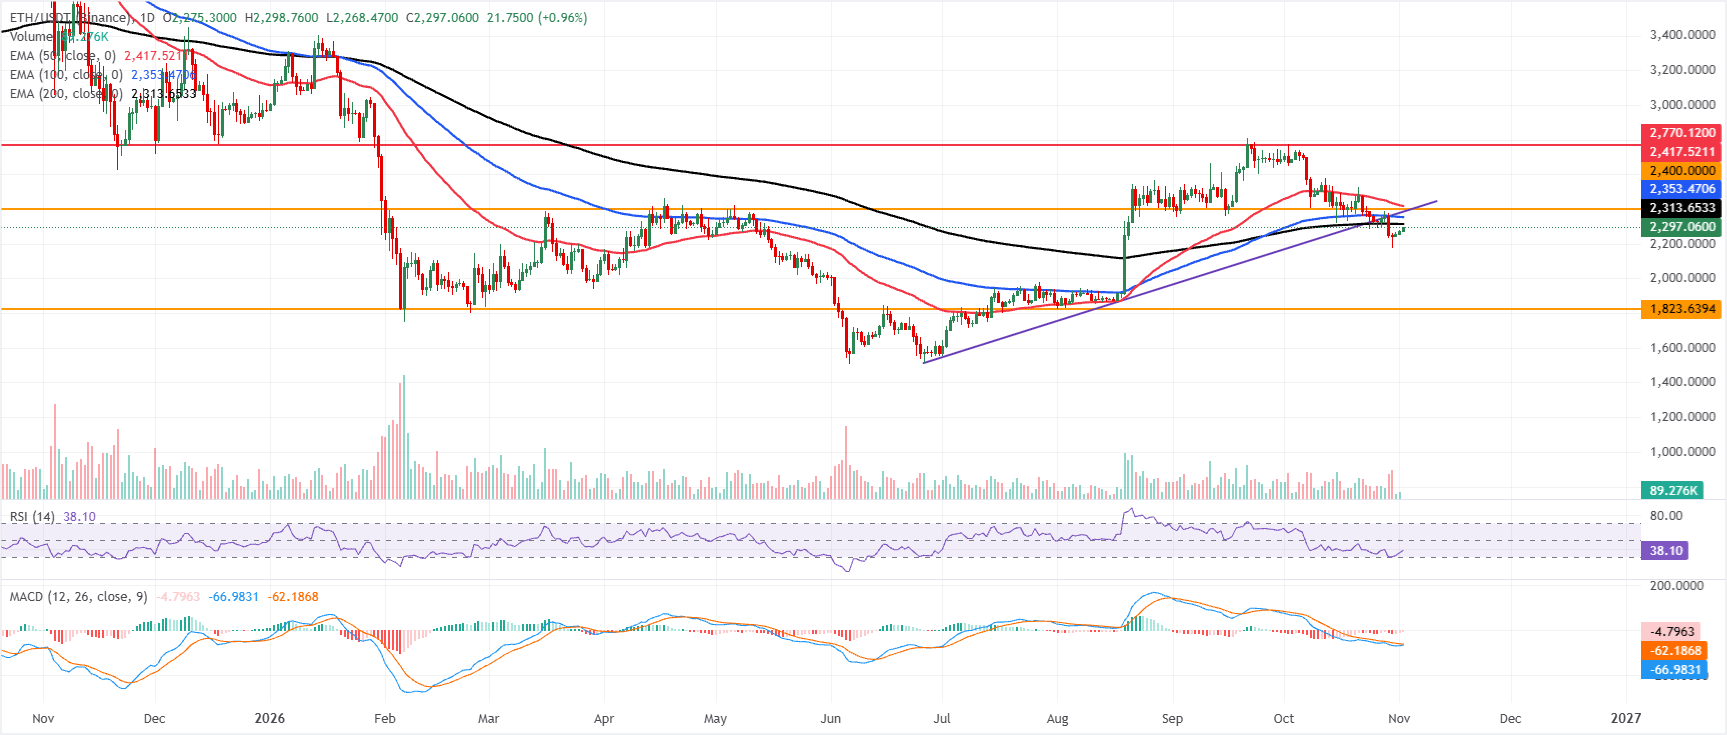
- Ethereum extends its rebound above $2,295, but holds below key EMAs, keeping its near-term outlook bearish.
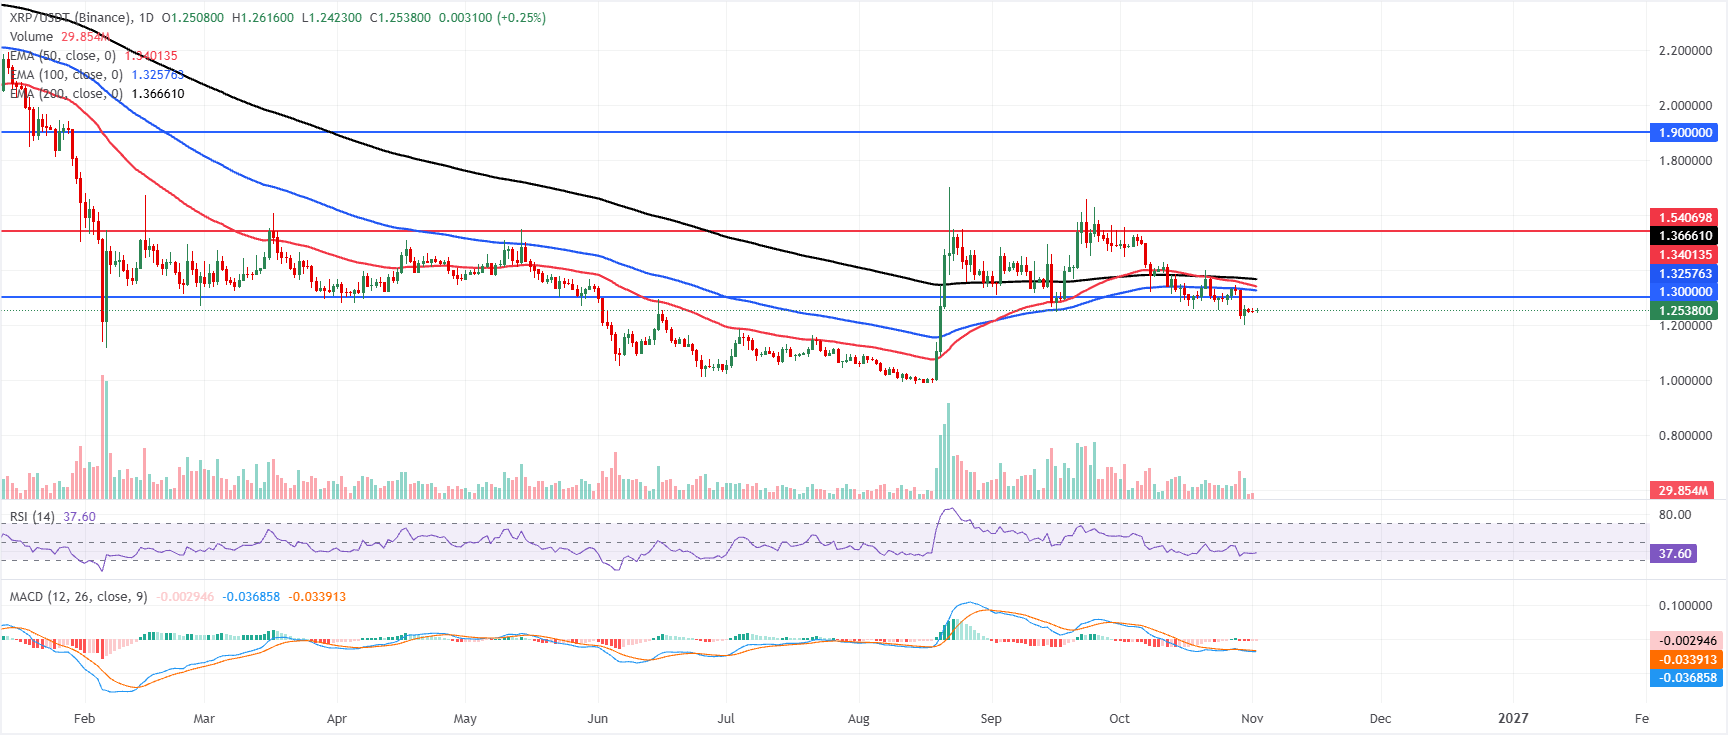
- XRP hovers around $1.25 on Monday after falling over 3.5% last week.
Bitcoin (BTC), Ethereum and Ripple (XRP) recover slightly on Monday after closing October with four straight weeks of losses. BTC climbs above $78,462 after finding support around its key support zones, while ETH rebounds above $2,295 but remains below key Exponential Moving Averages (EMAs), keeping its near-term outlook bearish. Meanwhile, XRP consolidates near $1.25 after shedding losses, as traders assess whether the early November rebound can gain traction.
Bitcoin finds support around key EMAs
Bitcoin price trades at $78,462 on Monday, consolidating between key Exponential Moving Averages (EMAs) as near-term bias turns slightly heavy. The 50-day EMA at $80,307 acts as immediate overhead resistance, capping attempts to resume the prior uptrend, while the 100-day and 200-day EMAs at $77,831 and $76,471, respectively, sit below price and hint at a still constructive broader structure.
Momentum is soft, with the Relative Strength Index (RSI) hovering near 40 and the Moving Average Convergence Divergence (MACD) remaining negative, suggesting fading bullish pressure rather than outright capitulation.
On the topside, a break above the 50-day EMA at $80,307 would be needed to reopen the path toward the horizontal resistance level at $85,000, where sellers recently emerged.
On the downside, initial support is seen at the 100-day EMA near $77,831, followed by a more important structural floor at the 200-day EMA around $76,471.
As long as BTC holds above these longer-term EMAs but remains capped by the 50-day EMA, the pair is likely to stay in a range, with any daily close below $76,471 reinforcing a deeper corrective phase and a sustained move above $80,307 shifting the bias back in favor of the bulls.
Ethereum holds below key EMAs
Ethereum price trades at $2,295 on Monday, holding below the key EMAs, which keeps the near-term bias bearish. ETH is capped by the 200-day EMA at $2,313 and the 100-day EMA at $2,353, while the prior ascending trendline break level at $2,385 reinforces overhead pressure.
The RSI at 37 remains weak but off oversold territory, and the MACD is still negative, suggesting any recovery attempts would likely face selling into nearby resistance.
On the topside, initial resistance appears at the 200-day EMA around $2,313, followed by the 100-day EMA at $2,353 and the broken trendline pivot near $2,385. Above there, a horizontal barrier at $2,400 precedes the 50-day EMA at $2,417, with a more distant cap at $2,770.
On the downside, the next meaningful support sits at the horizontal level near $1,823, where buyers would be expected to defend the broader uptrend structure if the current pullback extends.
XRP consolidates below key EMAs
XRP price trades at $1.253 on Monday, maintaining a bearish near-term bias as it holds below key EMAs. The 100-day EMA at $1.325, the 50-day EMA at $1.340 and the 200-day EMA at $1.366 all sit overhead, suggesting a capped market after the recent pullback.
Momentum remains fragile, with the RSI hovering near 37 and the MACD marginally negative, hinting that sellers still retain the upper hand despite the slowing downside.
On the topside, initial resistance emerges at the psychological $1.300 mark, ahead of the 100-day EMA at $1.325 and the 50-day EMA at $1.340, which form a nearby supply zone.
Higher up, the 200-day EMA at $1.366 reinforces the broader bearish structure. At the same time, a break above $1.540 would be needed to ease downside pressure and open the way toward the more distant horizontal barrier at $1.900. With no clear support levels defined by the current levels, further losses would leave XRP searching for fresh demand below $1.250 before any sustainable recovery can develop.
(The technical analysis of this story was written with the help of an AI tool. Know more.)
Cryptocurrency prices FAQs
Token launches influence demand and adoption among market participants. Listings on crypto exchanges deepen the liquidity for an asset and add new participants to an asset’s network. This is typically bullish for a digital asset.
A hack is an event in which an attacker captures a large volume of the asset from a DeFi bridge or hot wallet of an exchange or any other crypto platform via exploits, bugs or other methods. The exploiter then transfers these tokens out of the exchange platforms to ultimately sell or swap the assets for other cryptocurrencies or stablecoins. Such events often involve an en masse panic triggering a sell-off in the affected assets.
Macroeconomic events like the US Federal Reserve’s decision on interest rates influence crypto assets mainly through the direct impact they have on the US Dollar. An increase in interest rate typically negatively influences Bitcoin and altcoin prices, and vice versa. If the US Dollar index declines, risk assets and associated leverage for trading gets cheaper, in turn driving crypto prices higher.
Halvings are typically considered bullish events as they slash the block reward in half for miners, constricting the supply of the asset. At consistent demand if the supply reduces, the asset’s price climbs.
Nothing in this material constitutes investment advice, personal recommendation, investment research, an offer, or a solicitation to buy or sell any financial instrument. The content has been prepared without consideration of your individual investment objectives, financial situation, or needs, and should not be treated as such.
Past performance is not a reliable indicator of future performance and/or results. Forward-looking scenarios or forecasts are not a guarantee of future performance. Actual results may differ materially from those anticipated.
Mitrade makes no representation or warranty as to the accuracy or completeness of the information provided and accepts no liability for any loss arising from reliance on such information.
Recommended Articles


