



Ripple and Stellar outlook: XRP and XLM slide as bearish signal grows
- XRP remains under pressure, trading around $1.25 on Tuesday as bears control momentum.
- XLM extends its losses, trading below $0.162 and signaling a deeper correction.
- Mixed derivatives, bearish on-chain metrics and weakening technical indicators cap both altcoins’ recovery.
Ripple (XRP) and Stellar (XLM) remain under pressure on Tuesday, with bearish momentum capping recovery attempts. XRP trades around $1.25 as sellers maintain control, while XLM extends its decline below $0.162, raising the risk of a deeper correction. Meanwhile, mixed derivatives data, bearish on-chain metrics and weakening technical indicators all hint at continued downside risk for both altcoins.
Mixed derivatives metrics cap recovery
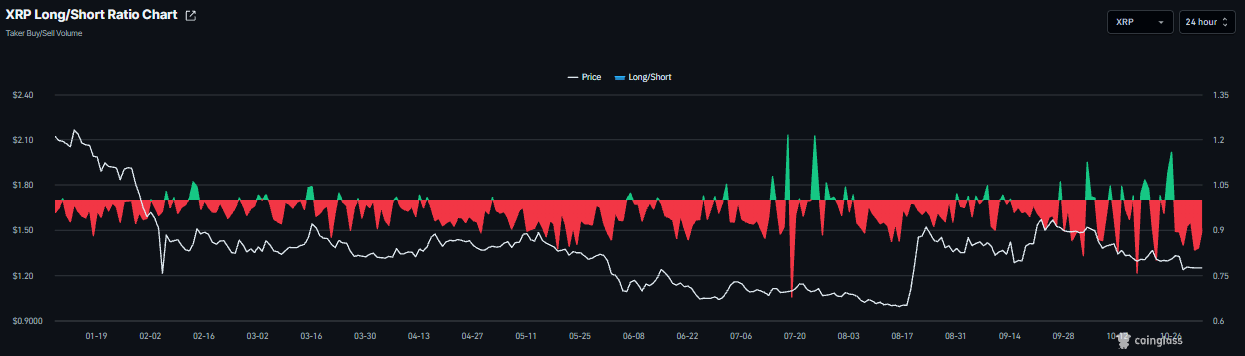
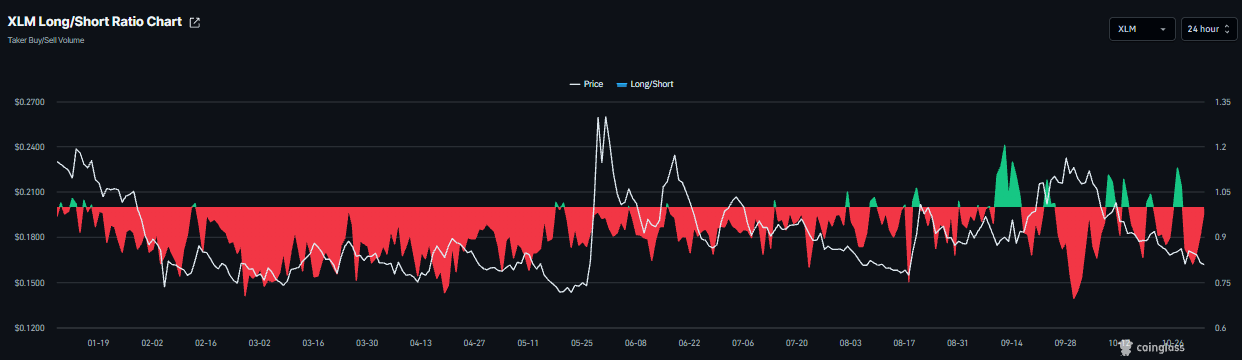
Derivatives data shows weakening conditions for Ripple and Stellar. CoinGlass’ long-to-short ratios for XRP and XLM read 0.90 and 0.98, respectively, on Tuesday. A ratio below one indicates bearish sentiment, as traders bet that asset prices will fall.
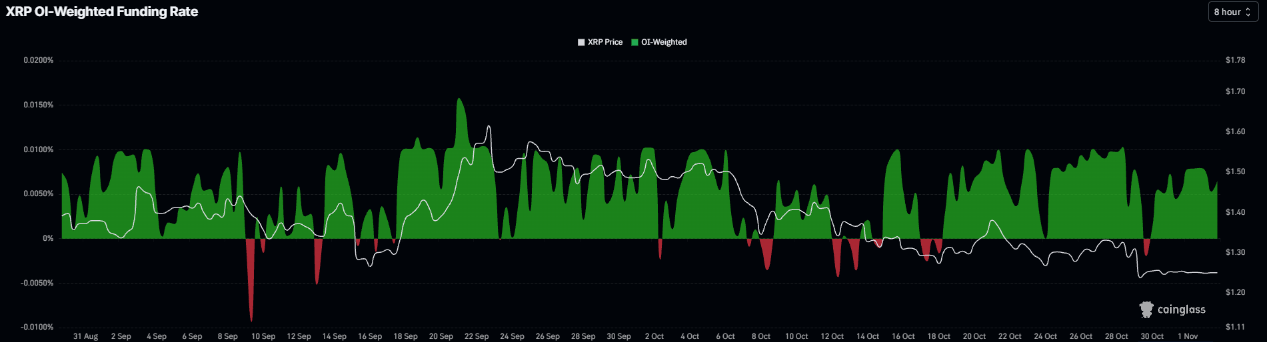
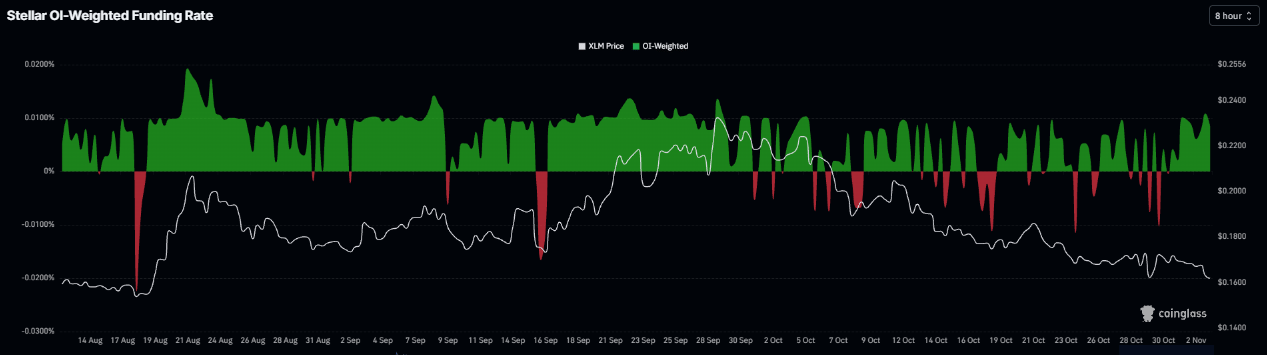
However, the funding rates of both altcoins flipped positive on October 30, reading 0.0065% for XRP and 0.0085% for XLM on Tuesday. These positive rates indicate that longs are paying shorts and suggest a mild bullish outlook.
Bearish on-chain data
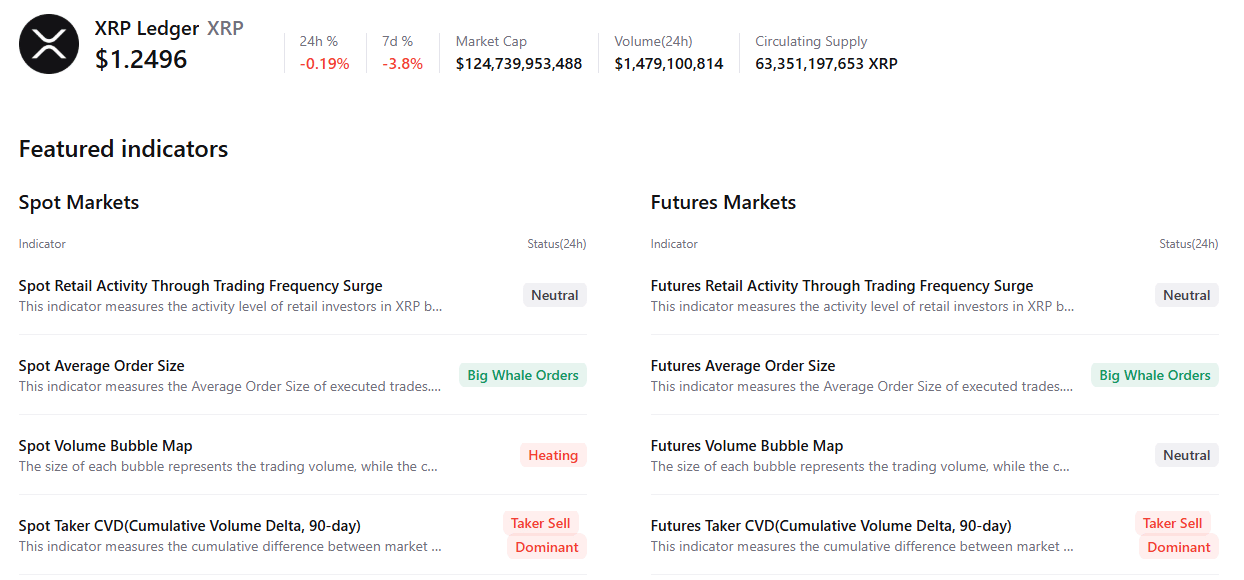
CryptoQuant’s summary data shows a bearish outlook for both altcoins. XRP’s spot and futures markets show large whale orders and sell-side dominance. In addition, the spot market shows heating conditions, highlighting a bearish, cautious sentiment bias among Ripple traders.
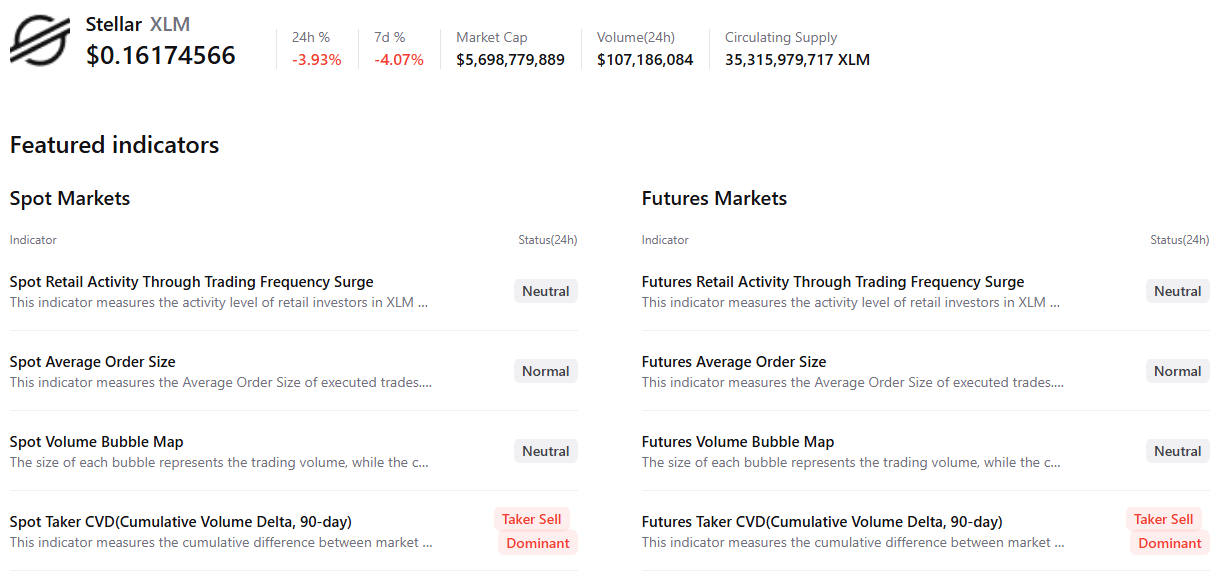
For XLM, spot and futures markets show sell-side dominance, indicating a negative outlook among Stellar traders.
XRP technical outlook: Consolidates below key EMAs
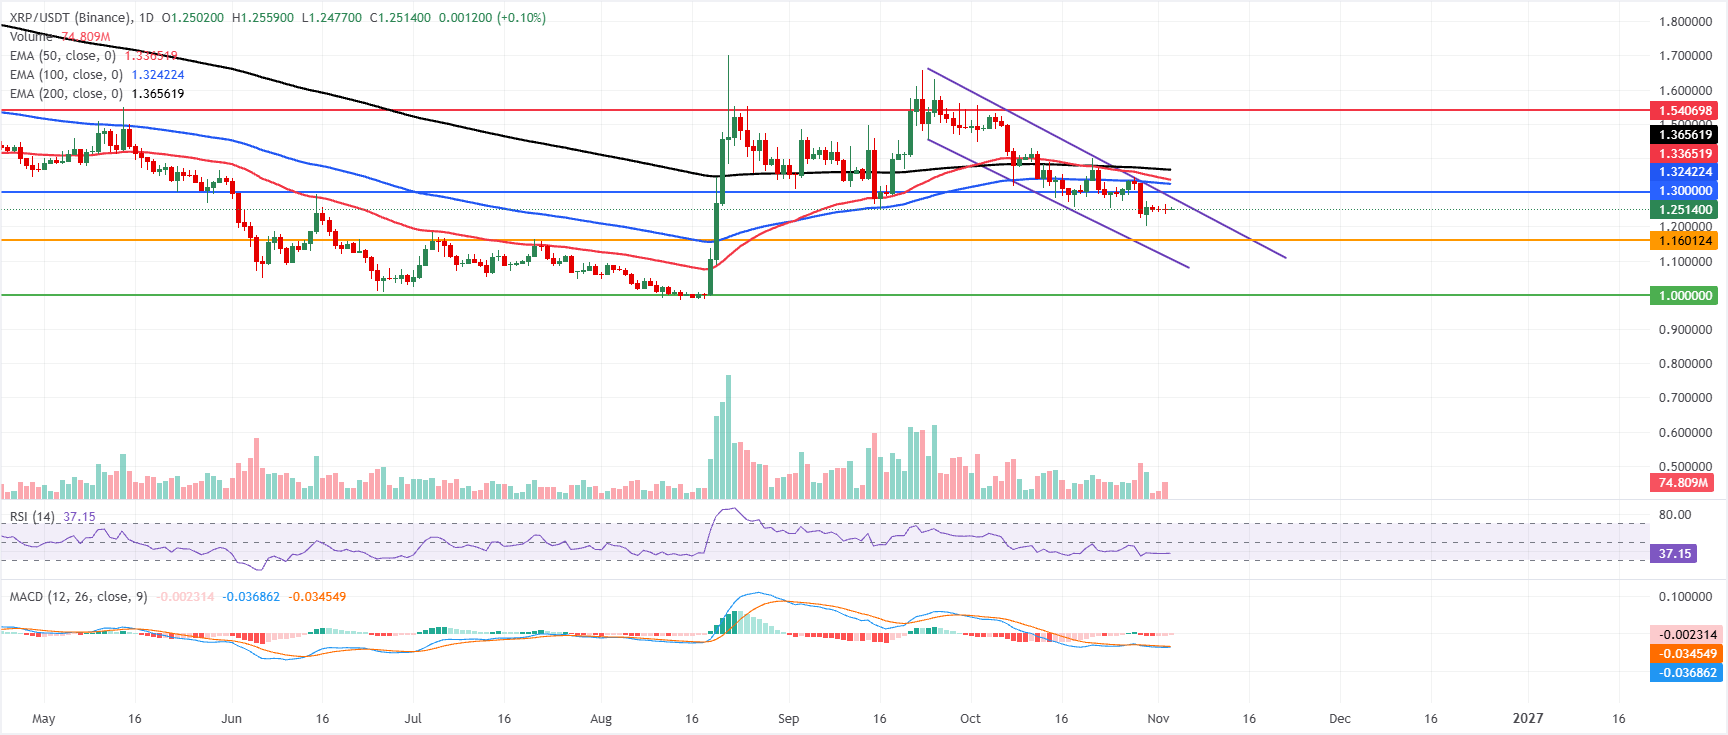
XRP price trades at $1.251 on Tuesday, maintaining a bearish near-term bias as it holds below the 50-day, 100-day and 200-day Exponential Moving Averages (EMAs) at $1.336, $1.324 and $1.365, respectively. XRP also remains under the upper trendline resistance at $1.285 and the horizontal barrier at $1.3000, reinforcing ongoing downside pressure.
The Relative Strength Index (RSI) near 37 suggests subdued momentum rather than oversold conditions. At the same time, the Moving Average Convergence Divergence (MACD) remains slightly negative, suggesting sellers still control the short-term tone.
On the topside, initial resistance is located at the trendline level around $1.285, followed by the $1.300 horizontal cap. Above these, the EMA cluster at $1.324 and $1.336, and then the 200-day EMA at $1.365, form a dense supply zone, ahead of higher barriers at $1.540 and $1.900.
On the downside, nearest support sits at $1.160, with a deeper structural floor at $1.000, where buyers would be expected to step in to counter any further slide.
XLM technical outlook: Bears in control
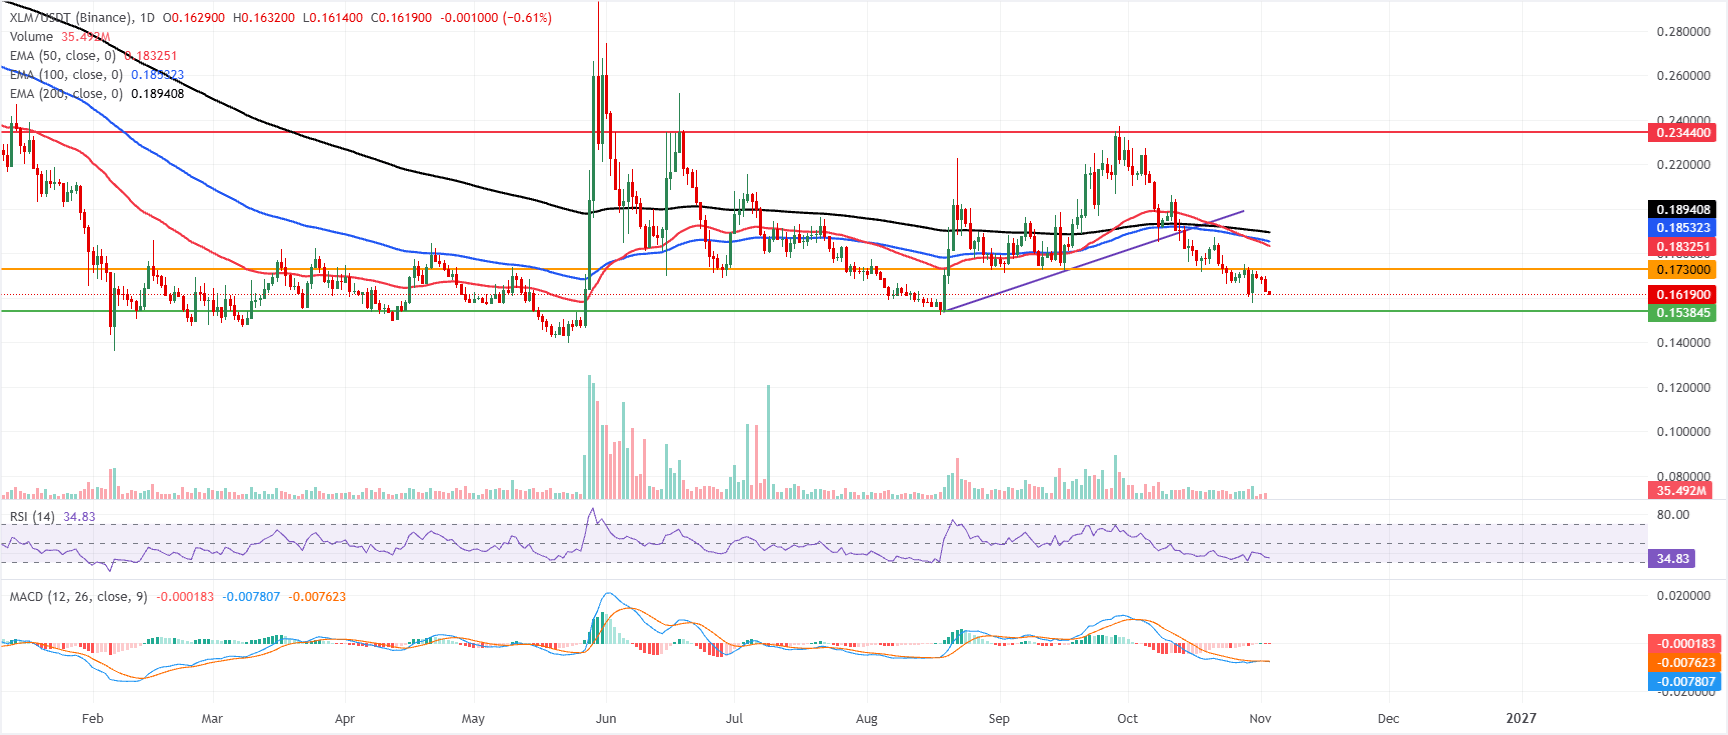
XLM price trades at $0.161 on Tuesday, maintaining a bearish near-term tone as it holds below the 50-day, 100-day, and 200-day EMAs clustered between roughly $0.183 and $0.189. XLM is retreating from the recent breakdown of the former support line at $0.173, while the RSI near 34 hints at weak but not extreme downside momentum, and the MACD remains marginally negative, reinforcing a capped outlook as long as the EMAs stay overhead.
On the topside, initial resistance appears at the horizontal barrier around $0.173, ahead of a dense EMA cluster acting as structural supply at $0.183, $0.185 and $0.189, while a stronger ceiling is seen near $0.234.
On the downside, immediate support is defined by the recent price area around $0.161, with more meaningful underlying demand aligned with the prior swing low and trendline anchor at $0.153; a sustained break below this latter level would likely open the door to a deeper bearish extension.
(The technical analysis of this story was written with the help of an AI tool. Know more.)
Nothing in this material constitutes investment advice, personal recommendation, investment research, an offer, or a solicitation to buy or sell any financial instrument. The content has been prepared without consideration of your individual investment objectives, financial situation, or needs, and should not be treated as such.
Past performance is not a reliable indicator of future performance and/or results. Forward-looking scenarios or forecasts are not a guarantee of future performance. Actual results may differ materially from those anticipated.
Mitrade makes no representation or warranty as to the accuracy or completeness of the information provided and accepts no liability for any loss arising from reliance on such information.
Recommended Articles


