



Crypto Today: Bitcoin, Ethereum, XRP under pressure as investors pull capital
- Bitcoin falls and trades at six-week lows, weighed down by $399 million in spot ETF outflows.
- Ethereum trades sideways above $2,200 support while upside remains structurally capped by major moving averages.
- XRP bulls and bears continue a tug-of-war around the $1.25 level amid mild ETF outflows.
Bitcoin (BTC) trades downward at $76,566 on Tuesday, testing six-week lows. The Crypto King's path of least resistance has remained largely sideways after the historic $6.3 billion Binance hack last week, with prevailing doldrums linked to reduced risk appetite and capital outflows.
Ethereum (ETH), like Bitcoin, trades under pressure as it consolidates within a narrow support range, with the lower limit near $2,200 and the upper limit around $2,300. Meanwhile, Ripple (XRP) hovers marginally above $1.25, weighed down by structural technical hurdles.
“The Binance hack continues to dominate the discussion. All things considered, the fact that the situation remains contained is remarkable given the reported scale of the incident,” Crypto Finance said via an emailed analysis report, adding, “It is arguably the type of event that very few parties could have absorbed."
ETF outflows persist amid cooling institutional demand
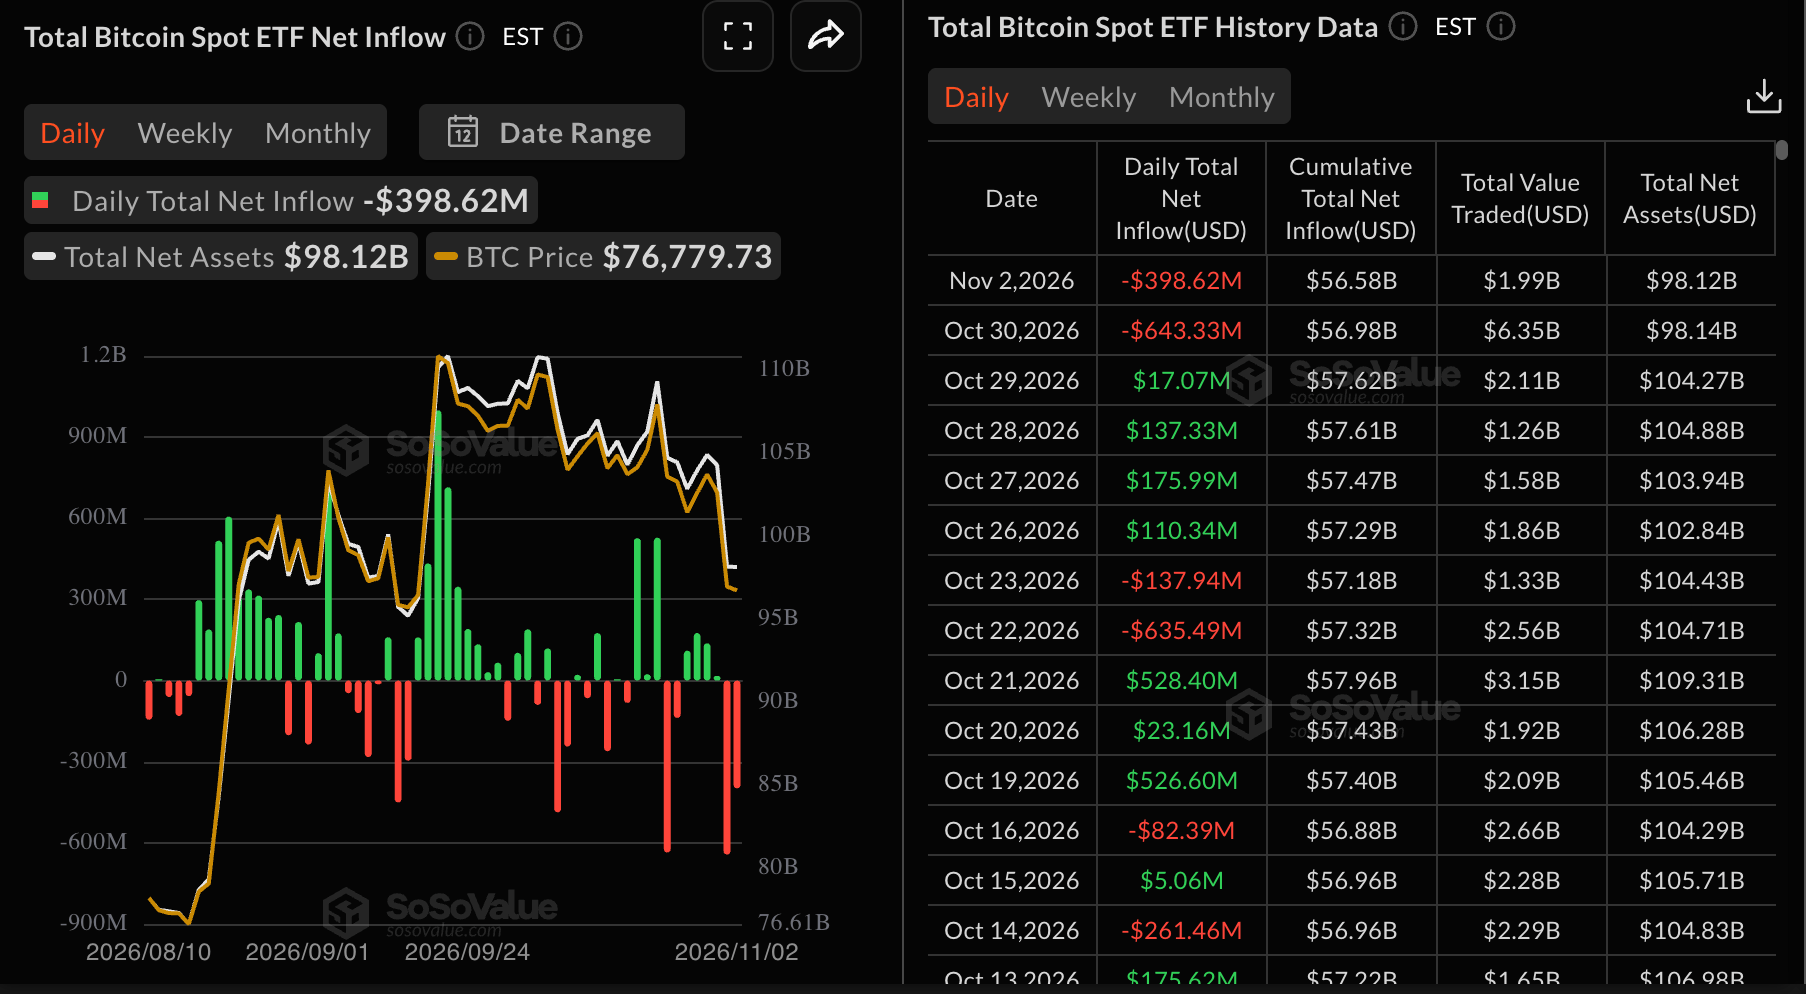
Interest in digital asset investment products continues to take a back seat as investors reposition after the Binance hack shook the broader crypto market. Bitcoin spot Exchange-Traded Funds (ETFs) recorded $399 million in outflows on Monday, extending the bearish streak last Friday, which saw $643 million in withdrawals. Despite the recent outflows, cumulative inflows stand at $56.6 billion, while total assets under management average $98.1 billion, according to SoSoValue.
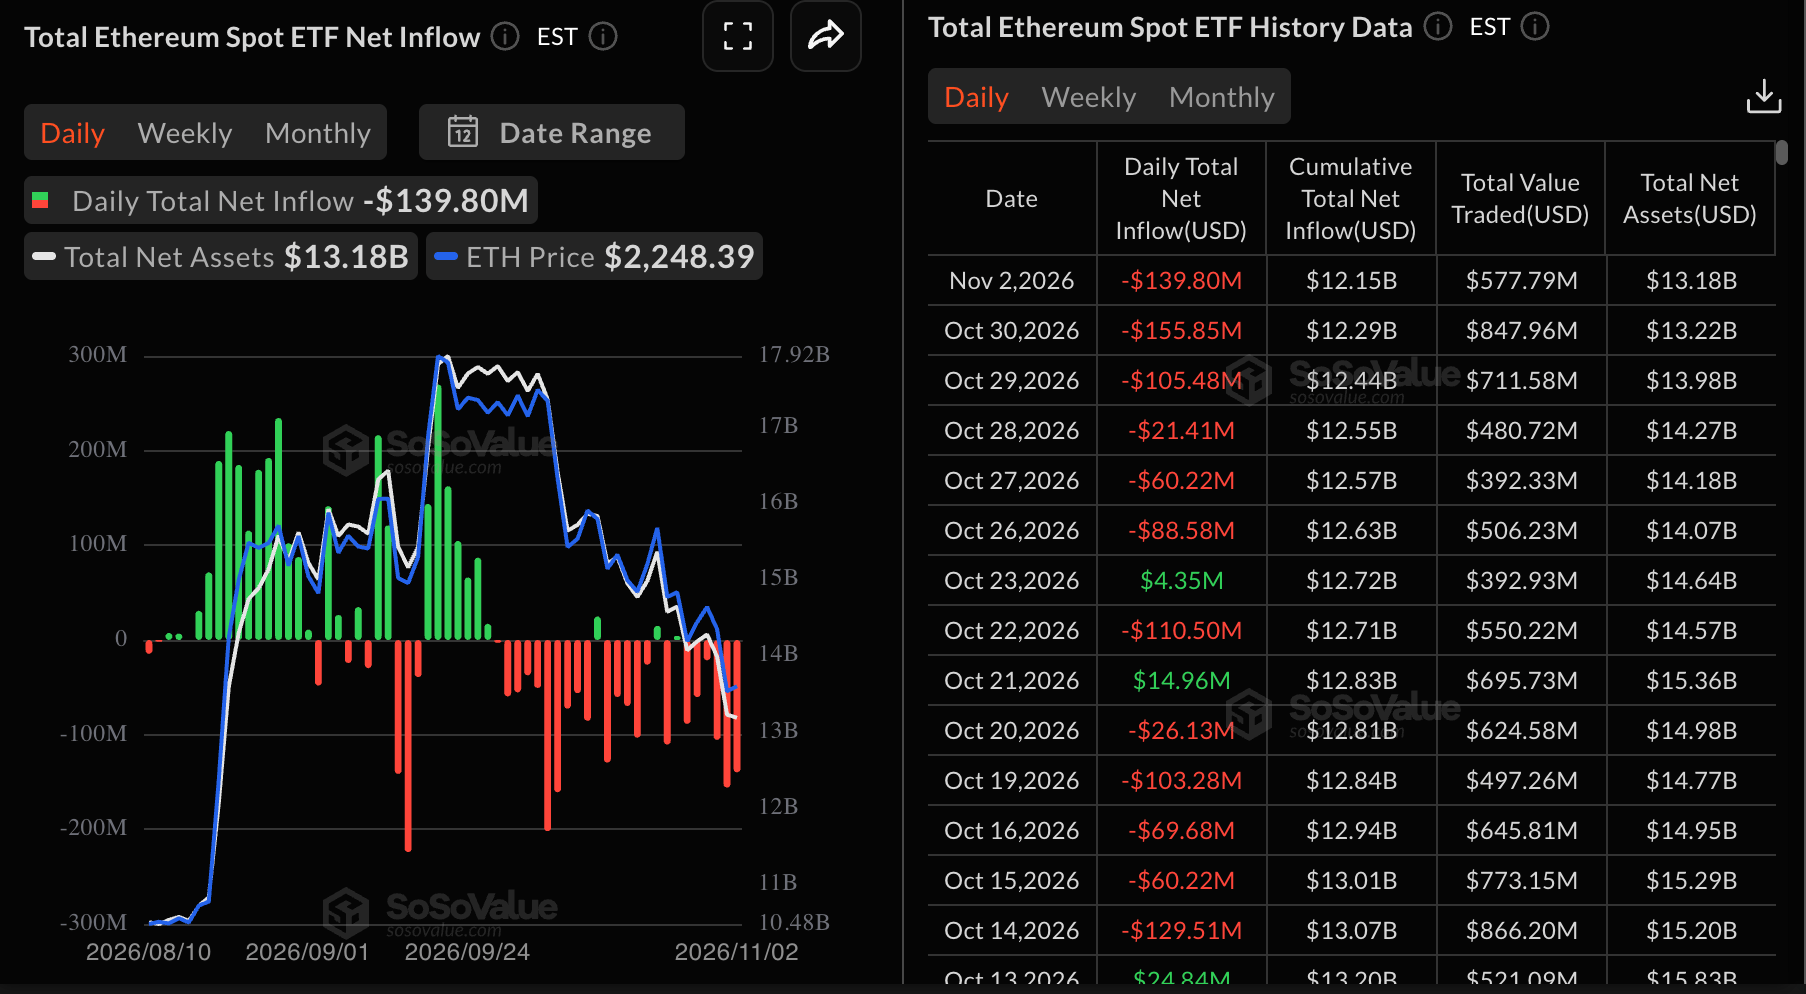
Ethereum spot ETFs extended their bearish trend with $140 million in outflows Monday, bringing cumulative inflows down to $12.1 billion. In comparison, total assets under management declined to $13.18 billion from $13.22 billion, recorded last Friday.
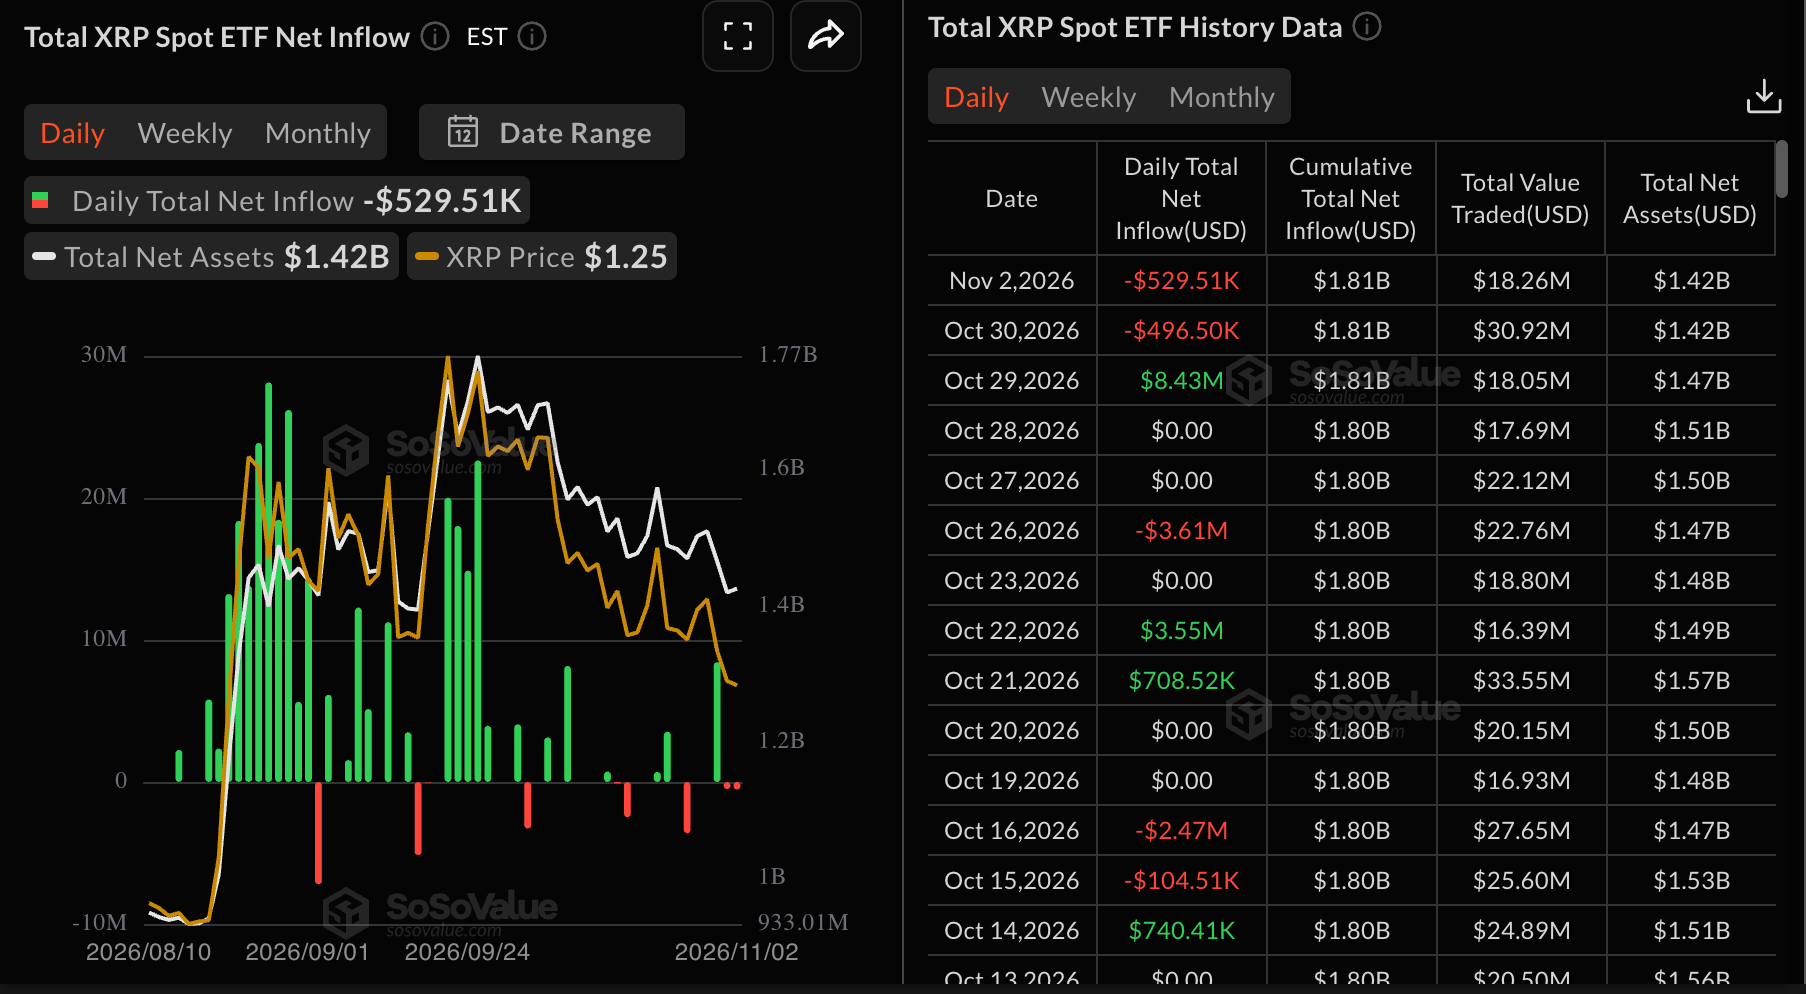
US-listed XRP ETFs posted the second straight day of mild outflows totaling $530,000 on Monday, and $497,000 last Friday. Cumulative inflows remain positive at $1.8 billion, with net assets under management at $1.4 billion, suggesting investors maintain a strong long-term outlook for the underlying asset.
Technical analysis: Bitcoin falters as sell-side pressure expands
Bitcoin trades at $76,566, flirting with the 200-day Exponential Moving Average (EMA) while remaining capped below the 100-day EMA at $77,776, keeping the near-term bias bearish. The 50-day EMA higher up at $80,099 reinforces the overhead supply, while the Moving Average Convergence Divergence (MACD) stays in negative territory with a weak profile and the Relative Strength Index (RSI) hovering around 34, hinting at lingering downside pressure rather than a decisive oversold bounce.
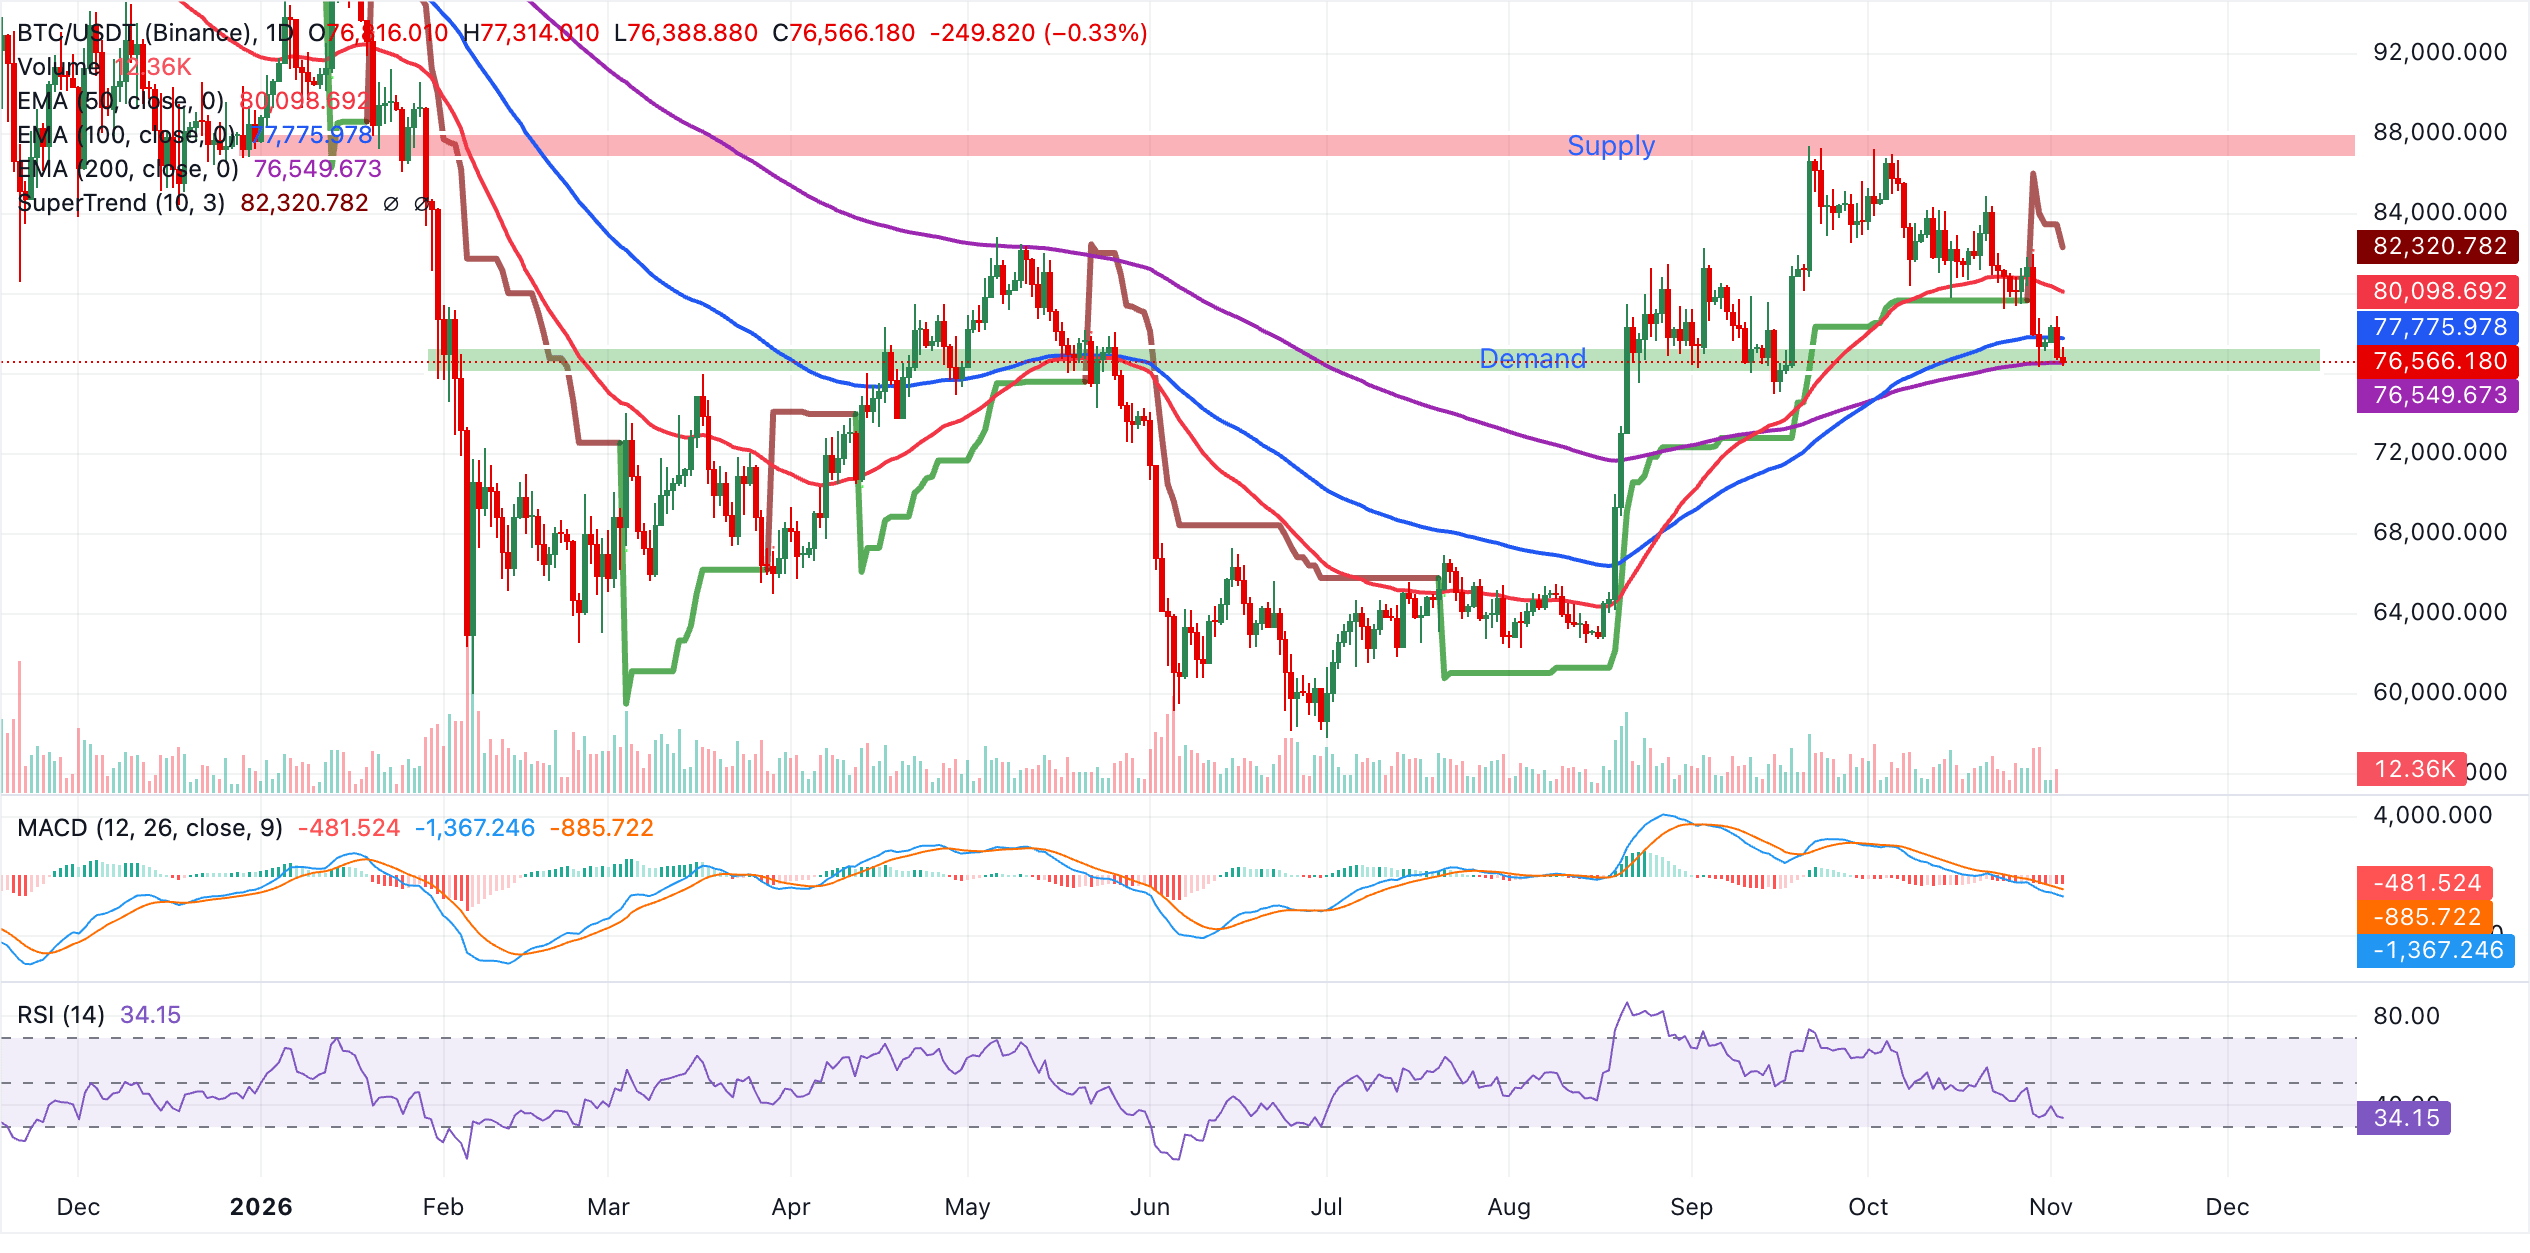
Initial resistance lies at the 100-day EMA around $77,776, ahead of a stronger barrier at the 50-day EMA near $80,099. On the downside, immediate support is provided by the 200-day EMA at $76,550. A daily close above the 100-day EMA would be needed to soften the bearish tone, whereas a sustained move back below the 200-day EMA would reopen the path for further retracement.
Ethereum technical analysis: ETH upholds lower support level
Ethereum trades at $2,257, extending a bearish phase after slipping below all key moving averages. The 200-day EMA at $2,307 is the nearest overhead cap, followed by the prior upward trendline break level at $2,341 and the 100-day EMA at $2,351, collectively suggesting any rebounds are likely to meet supply.
The 50-day EMA at $2,410 and the SuperTrend line at $2,475 reinforce broader topside pressure, while the Relative Strength Index (RSI) at 33 shows weak momentum just above oversold territory and the MACD histogram is negative but contracting, hinting at slowing downside rather than a reversal.
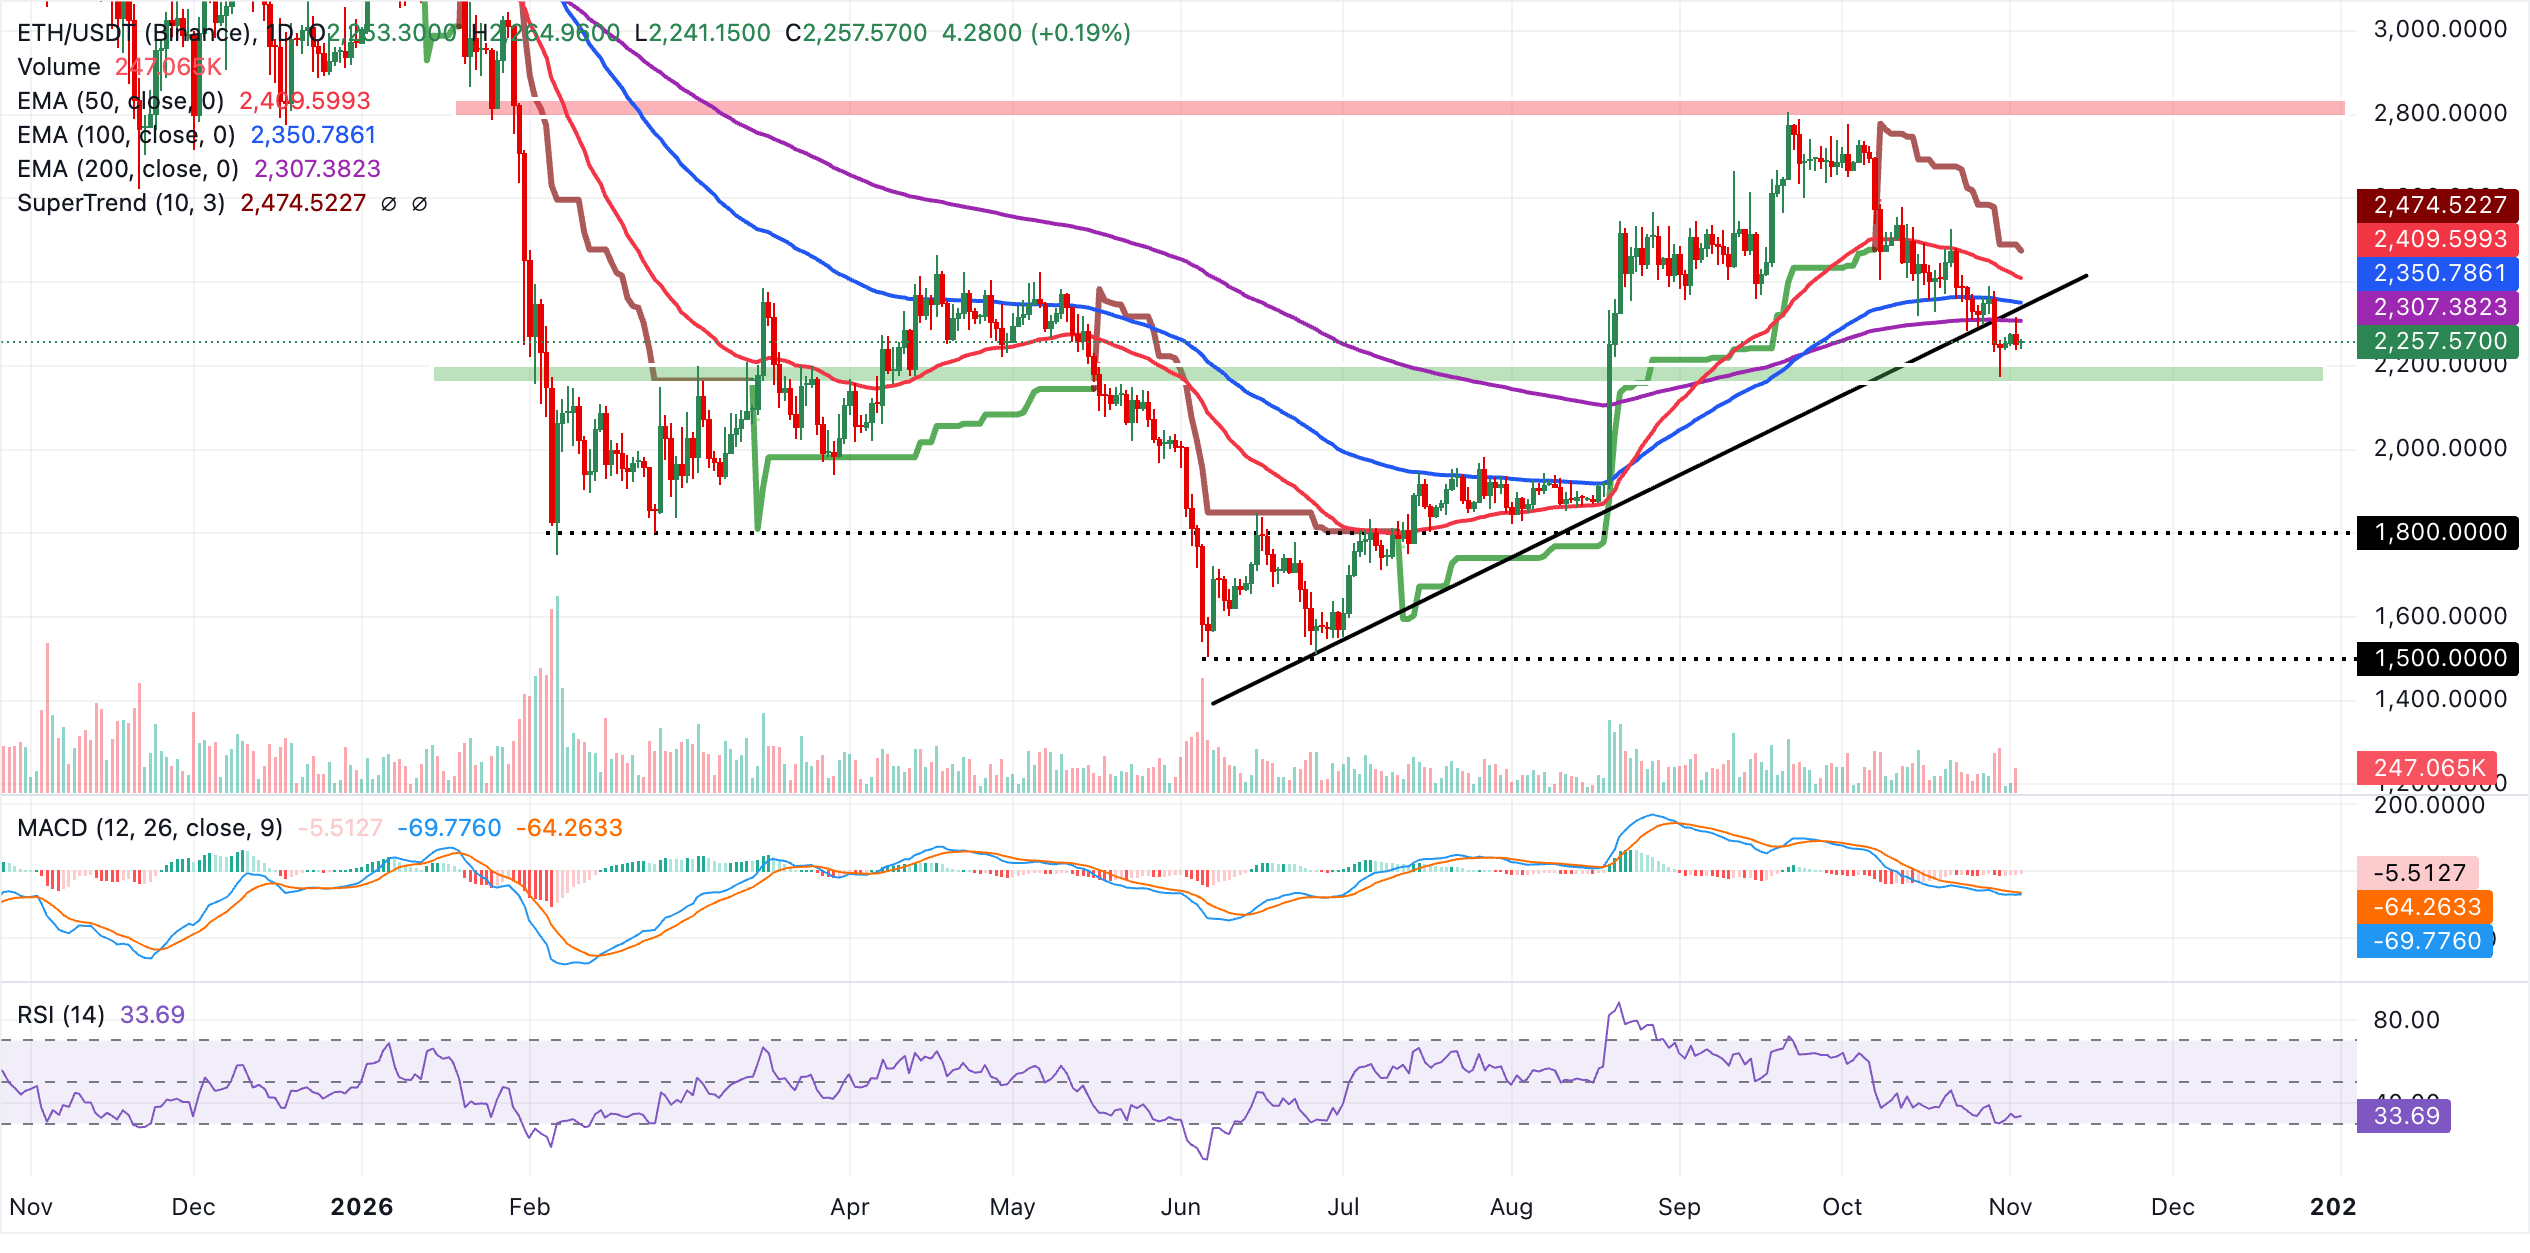
Immediate resistance lies at the 200-day EMA near $2,307, with subsequent barriers at the broken rising trendline around $2,341 and the 100-day EMA near $2,351. Further up, the 50-day EMA at roughly $2,410 precedes a stronger supply zone at the SuperTrend line around $2,475, where sellers could reassert control if price manages a deeper corrective bounce. On the downside, the lack of nearby mapped supports in the provided dataset leaves ETH vulnerable to further declines, so traders may look for new horizontal floors to emerge from price action before expecting a more durable recovery.
"BTC is now firmly trading below its 50-day EMA and is testing the key $76,400 area. The area at $78,800 is the first meaningful resistance, while a break lower would bring $73,700 into focus as the next support," Crypto Finance added.
Technical analysis: XRP maintains stronger bearish bias
XRP trades above $1.25, extending its retreat beneath a dense band of moving average and trendline resistance. The pair is now clearly below the 50-day EMA at $1.34, the 100-day EMA at $1.32 and the 200-day EMA at $1.36, which collectively suggest the broader bias has turned bearish while price remains capped under the broken downward resistance trendline at $1.29.
The SuperTrend indicator at $1.39 stays firmly above spot, reinforcing persistent selling pressure. Similarly, the RSI near 37 hints at weak momentum but not outright oversold conditions.
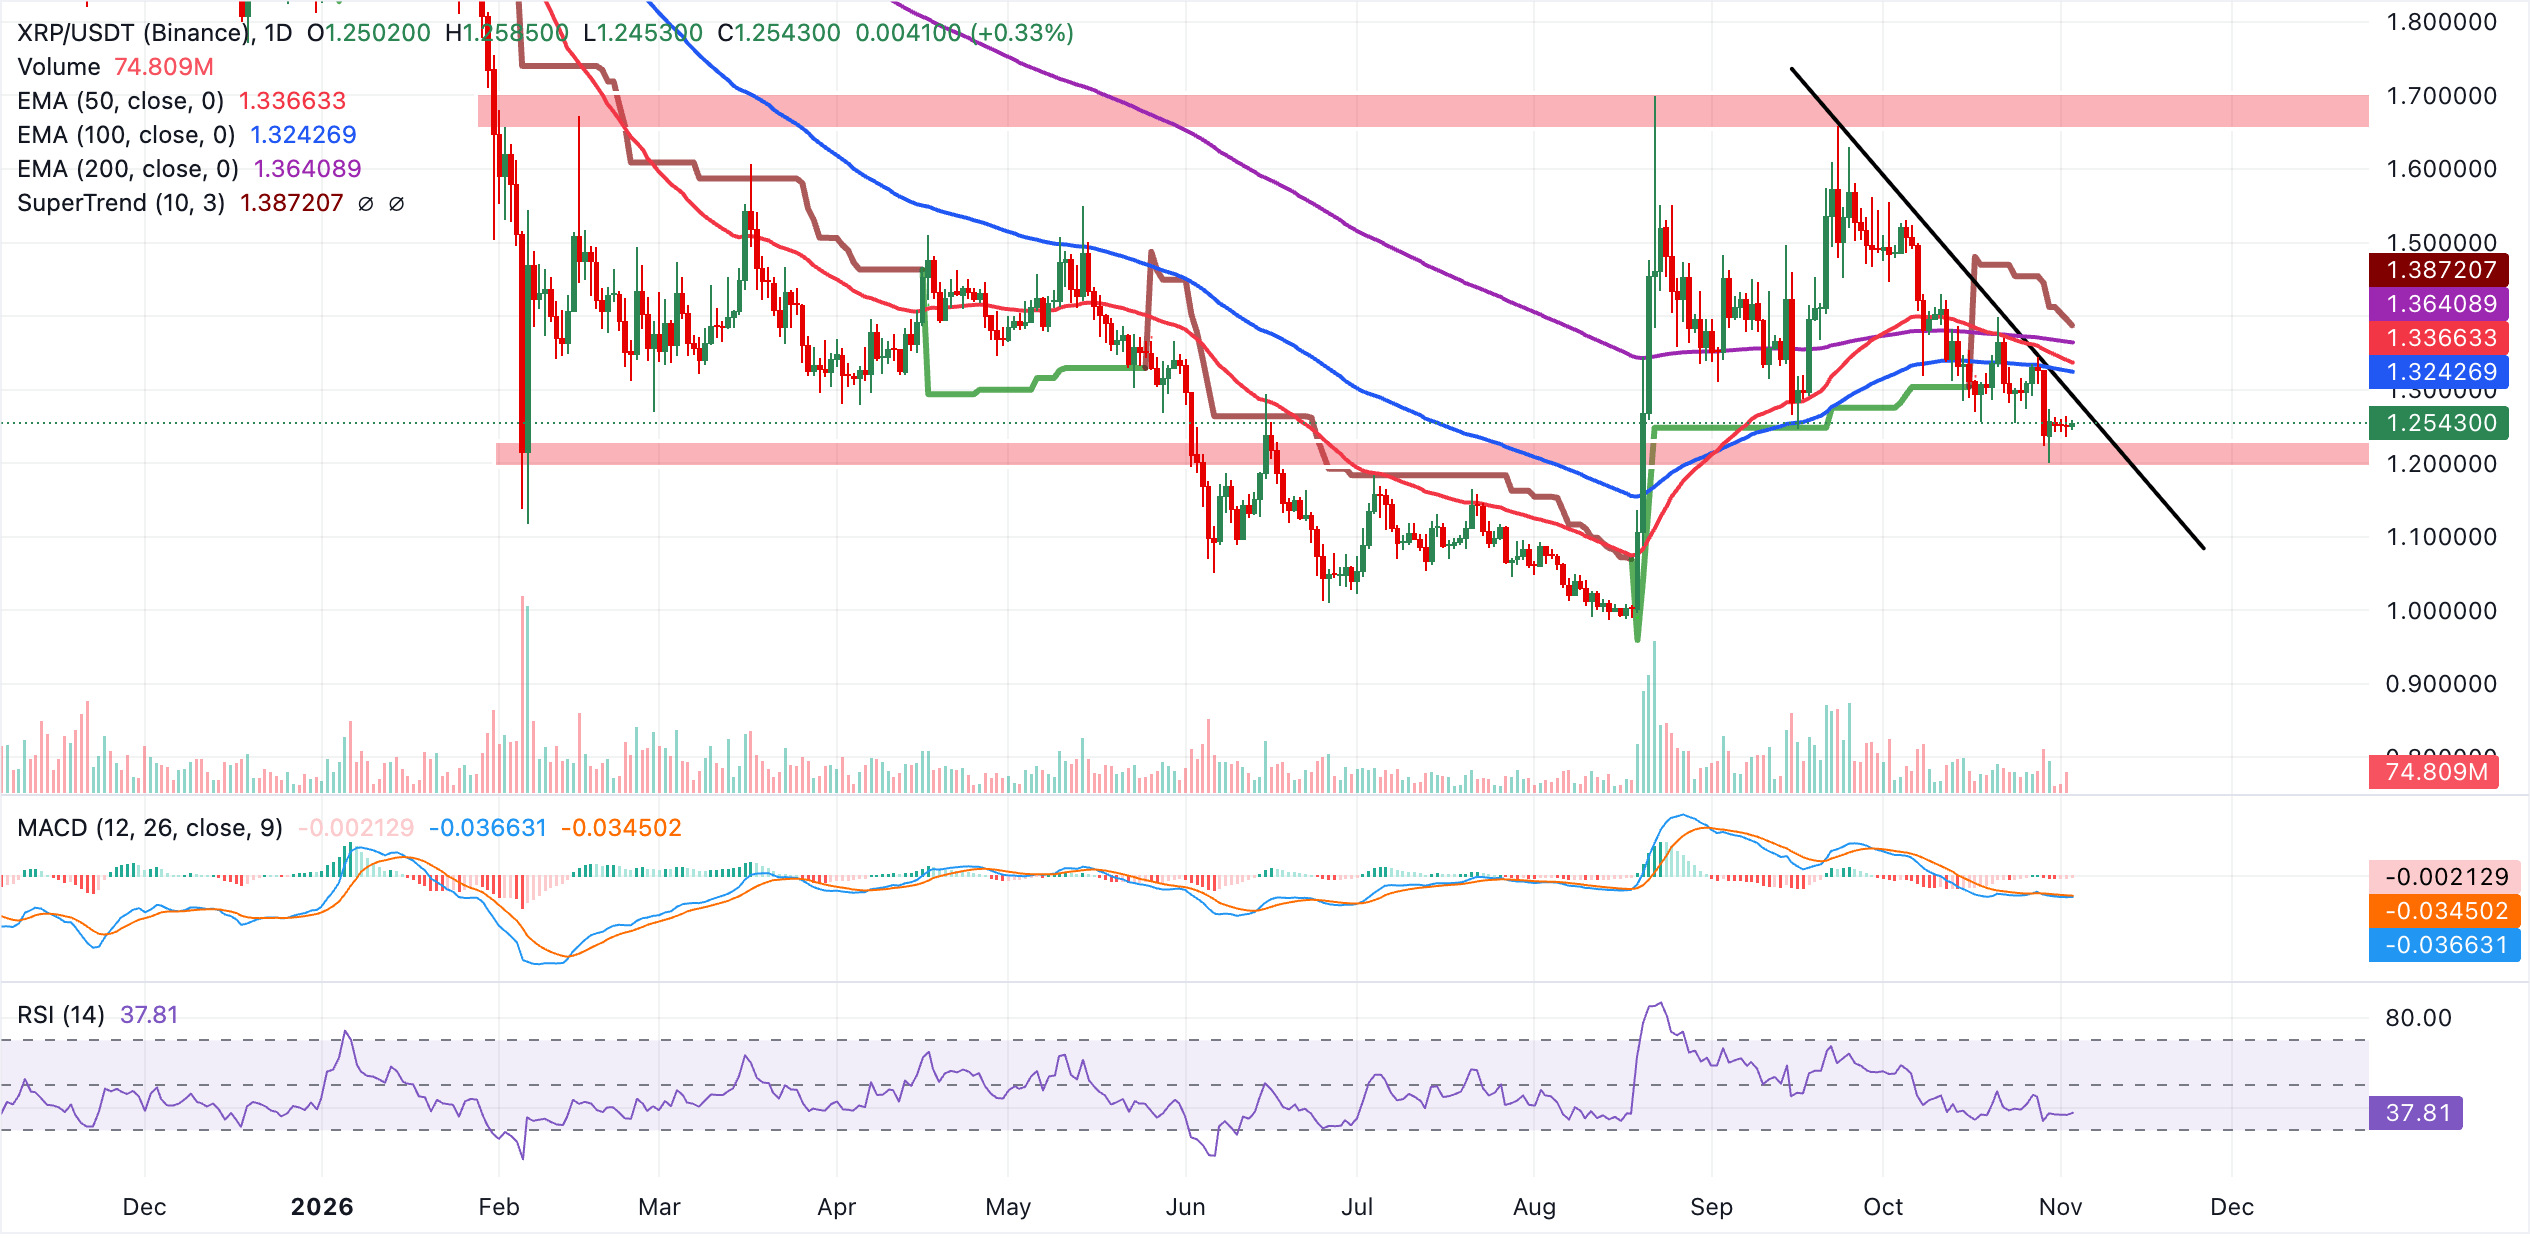
Initial resistance lies at the former trendline break area around $1.29, followed by the 100-day EMA at $1.32 and the 50-day EMA at $1.34. Above these levels, the 200-day EMA at $1.36 and the SuperTrend line at $1.39 define a broader supply zone that would need to be decisively reclaimed to ease the current bearish tone. With no clear technical support levels defined below the prevailing price on the daily chart, any further slide would leave the pair exposed to discovering fresh demand zones on lower time frames or previous swing lows not captured here.
(The technical analysis of this story was written with the help of an AI tool. Know more.)
Bitcoin, altcoins, stablecoins FAQs
Bitcoin is the largest cryptocurrency by market capitalization, a virtual currency designed to serve as money. This form of payment cannot be controlled by any one person, group, or entity, which eliminates the need for third-party participation during financial transactions.
Altcoins are any cryptocurrency apart from Bitcoin, but some also regard Ethereum as a non-altcoin because it is from these two cryptocurrencies that forking happens. If this is true, then Litecoin is the first altcoin, forked from the Bitcoin protocol and, therefore, an “improved” version of it.
Stablecoins are cryptocurrencies designed to have a stable price, with their value backed by a reserve of the asset it represents. To achieve this, the value of any one stablecoin is pegged to a commodity or financial instrument, such as the US Dollar (USD), with its supply regulated by an algorithm or demand. The main goal of stablecoins is to provide an on/off-ramp for investors willing to trade and invest in cryptocurrencies. Stablecoins also allow investors to store value since cryptocurrencies, in general, are subject to volatility.
Bitcoin dominance is the ratio of Bitcoin's market capitalization to the total market capitalization of all cryptocurrencies combined. It provides a clear picture of Bitcoin’s interest among investors. A high BTC dominance typically happens before and during a bull run, in which investors resort to investing in relatively stable and high market capitalization cryptocurrency like Bitcoin. A drop in BTC dominance usually means that investors are moving their capital and/or profits to altcoins in a quest for higher returns, which usually triggers an explosion of altcoin rallies.
Nothing in this material constitutes investment advice, personal recommendation, investment research, an offer, or a solicitation to buy or sell any financial instrument. The content has been prepared without consideration of your individual investment objectives, financial situation, or needs, and should not be treated as such.
Past performance is not a reliable indicator of future performance and/or results. Forward-looking scenarios or forecasts are not a guarantee of future performance. Actual results may differ materially from those anticipated.
Mitrade makes no representation or warranty as to the accuracy or completeness of the information provided and accepts no liability for any loss arising from reliance on such information.
Recommended Articles


