



NEAR Protocol Price Forecast: NEAR risks further decline as bearish signals mount
- NEAR Protocol hovers around $3.61 on Tuesday, holding steady after testing a crucial support level.
- Institutional investors took a breather from net-zero flows on Monday after more than $4 million in withdrawals last week.
- Persistently negative Coinbase premium and net outflows from NEAR futures suggest weak retail demand.
NEAR Protocol (NEAR) shows resilience above $3.50 on Tuesday, following the previous day’s rebound from the $3.40 support level. Muted institutional investor interest and a steady decline in retail demand, along with a negative Coinbase premium and outflows from NEAR futures, weigh on the AI token. The technical outlook for NEAR remains bearish, as the price trend is capped below multiple resistance levels.
NEAR ETF outflows and futures face selling pressure
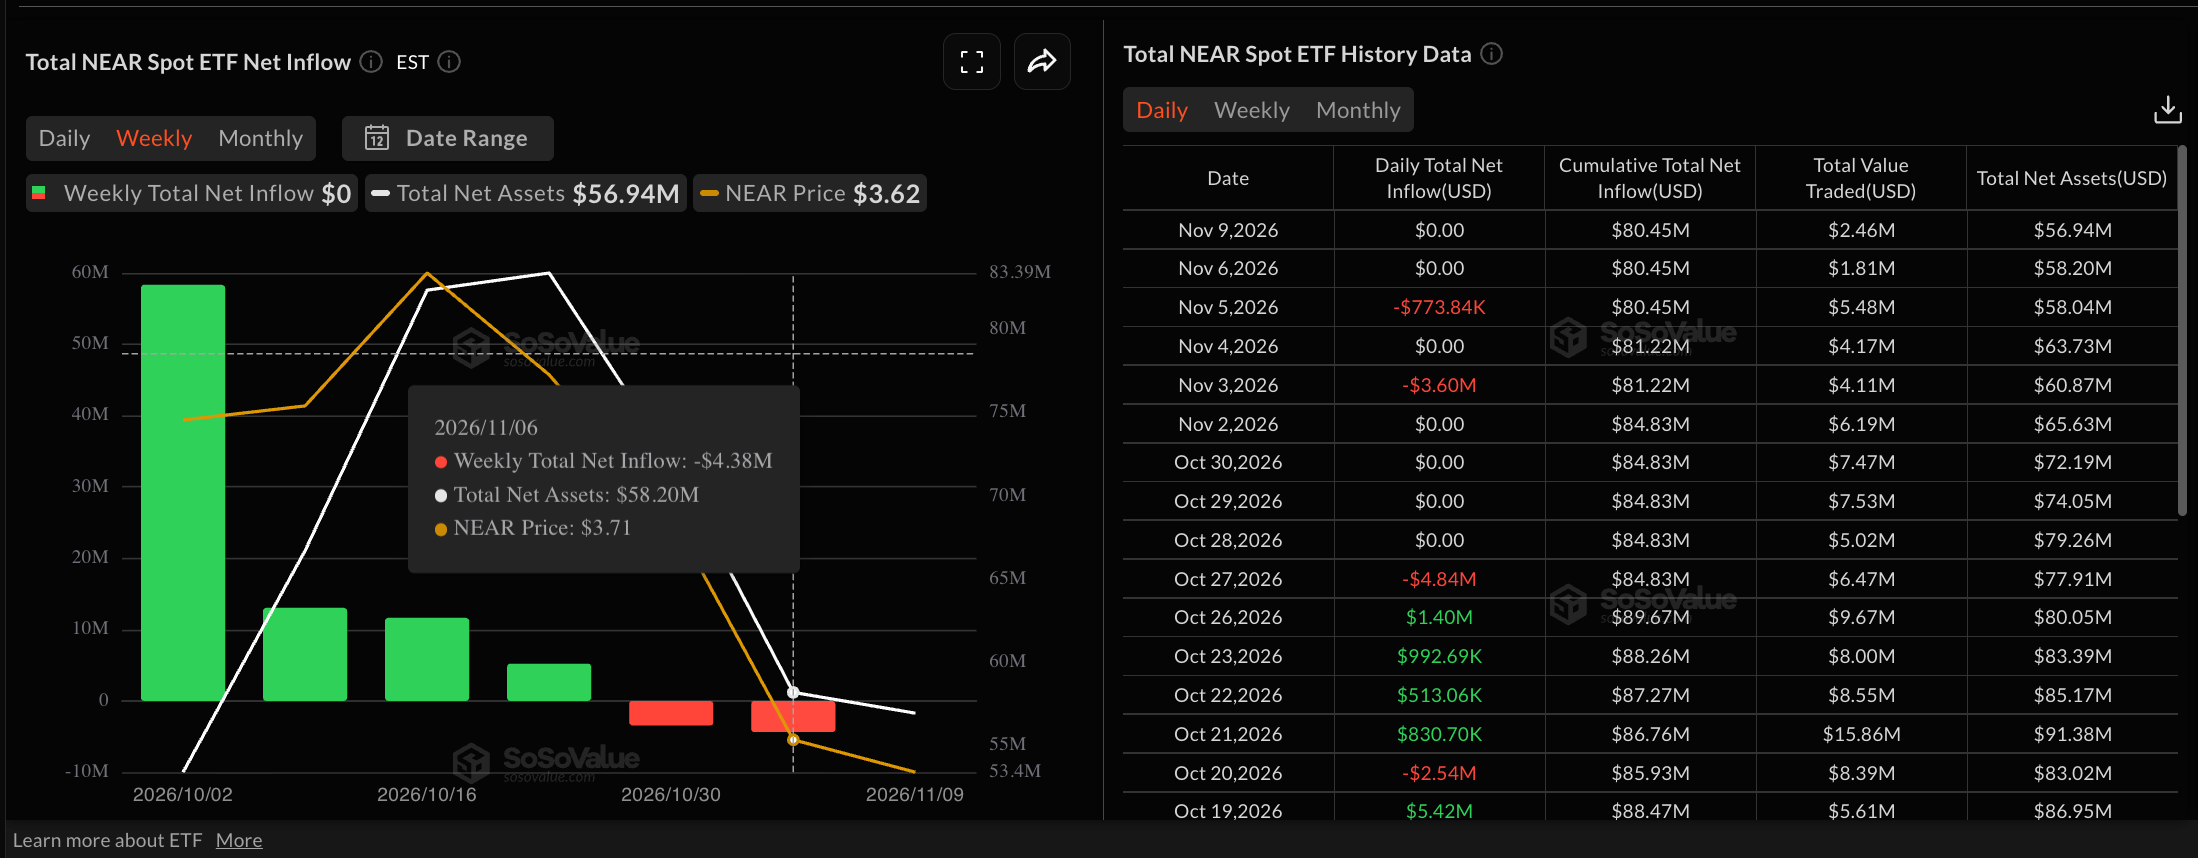
NEAR ETFs remain under pressure after a couple of weeks of net withdrawals. SoSoValue data shows zero net flows on Monday after $4.38 million and $3.43 million in outflows in the previous two weeks. Typically, consistent outflows suggest withdrawals by institutional investors, reflecting reduced confidence in the asset.
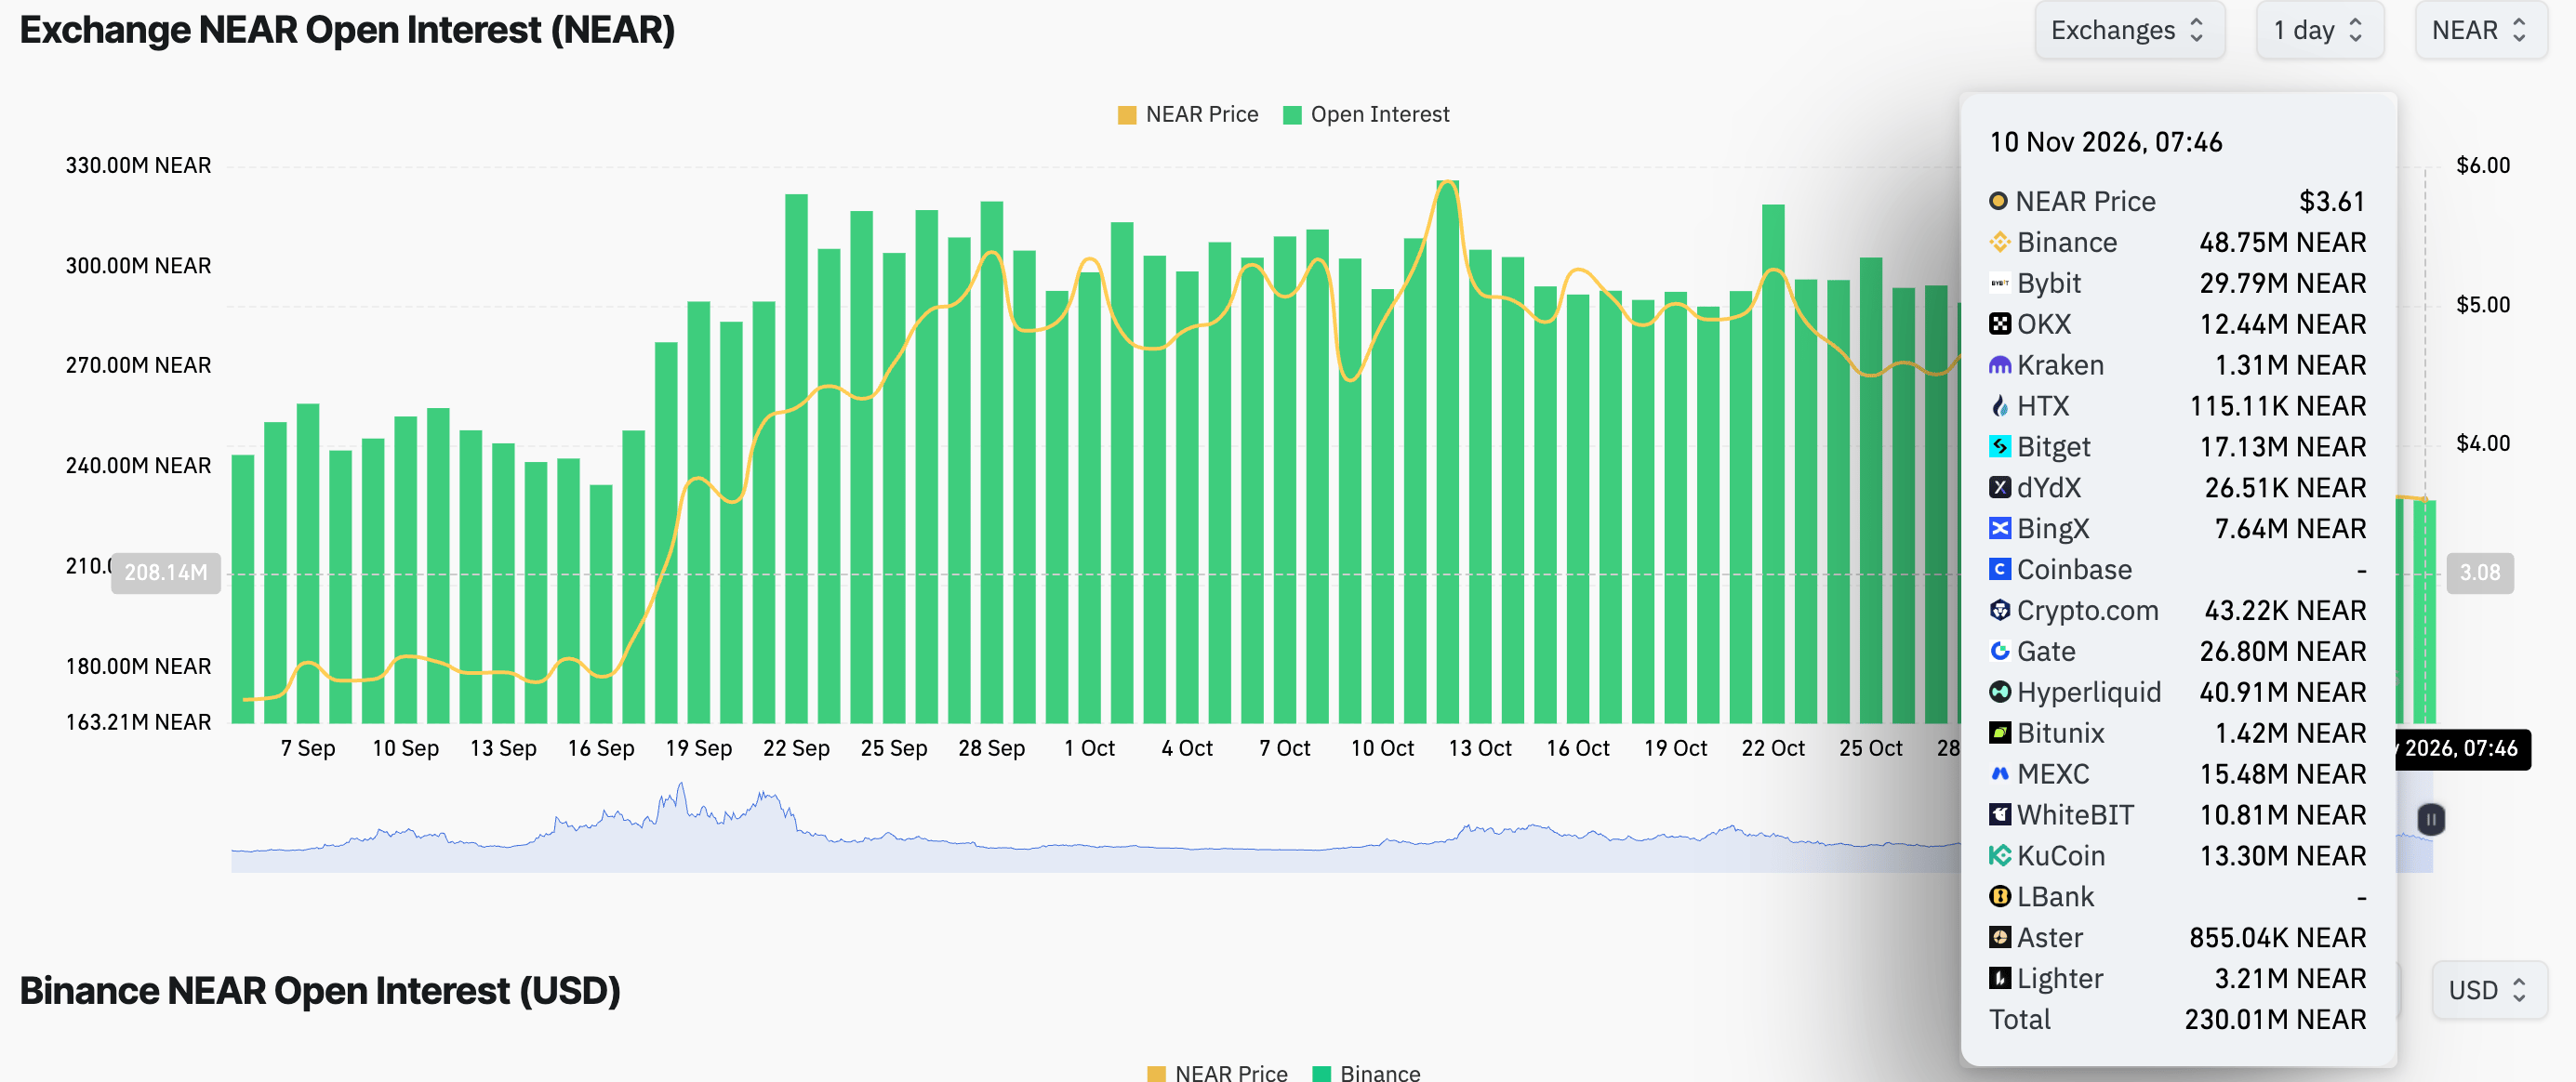
On the retail side, a similar decline in demand is evident. CoinGlass data shows NEAR Open Interest (OI) at 230 million NEAR on Tuesday, down from 318 million NEAR on October 22, indicating a reduction in the notional value of active contracts. This suggests a risk-off sentiment, aligning with rising net outflows from the futures market.
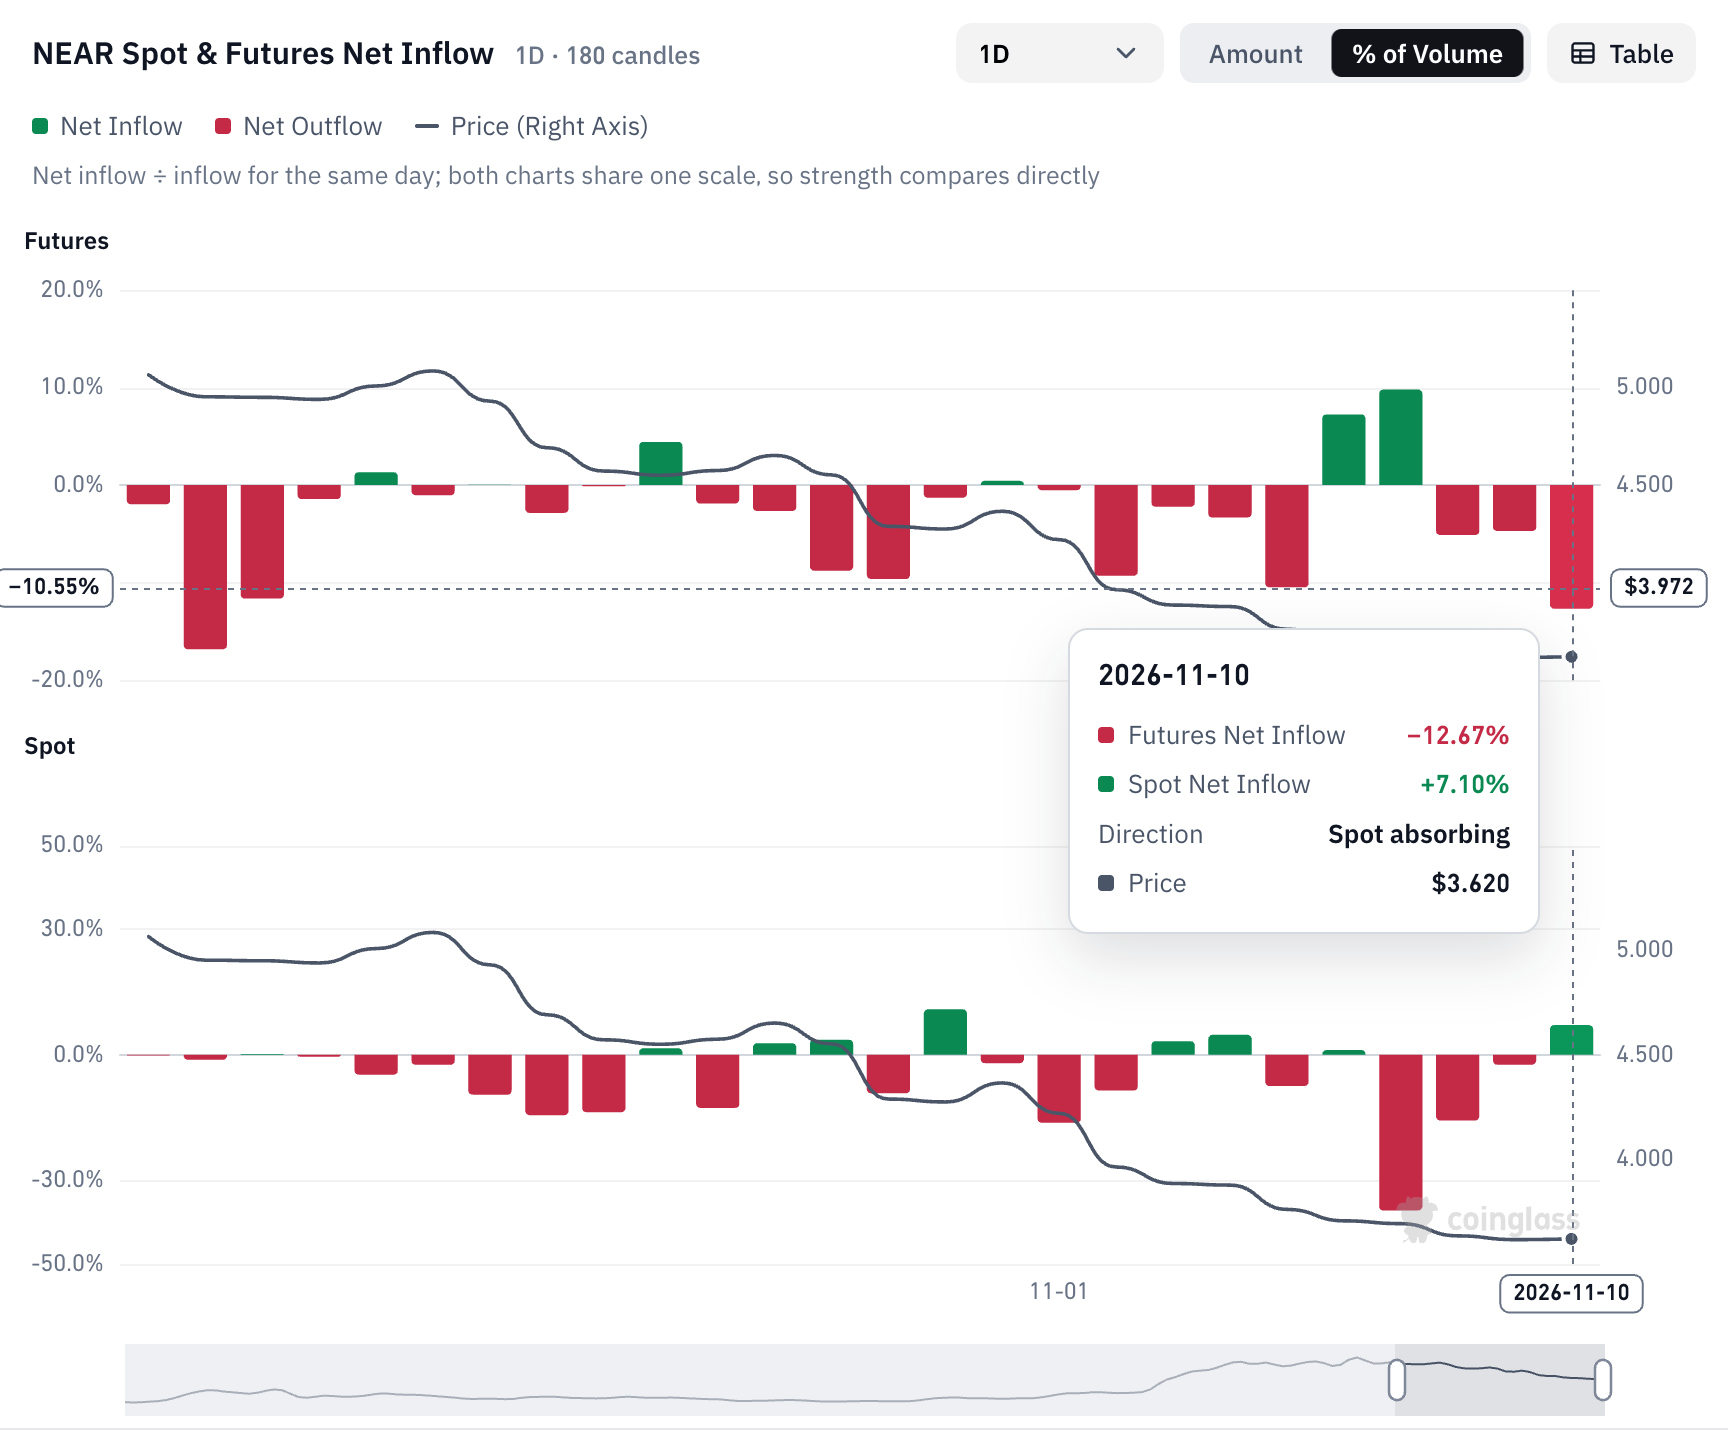
NEAR futures outflows accounted for 17% of daily volume, while the spot market absorbed the supply, with inflows accounting for nearly 10% of daily volume.
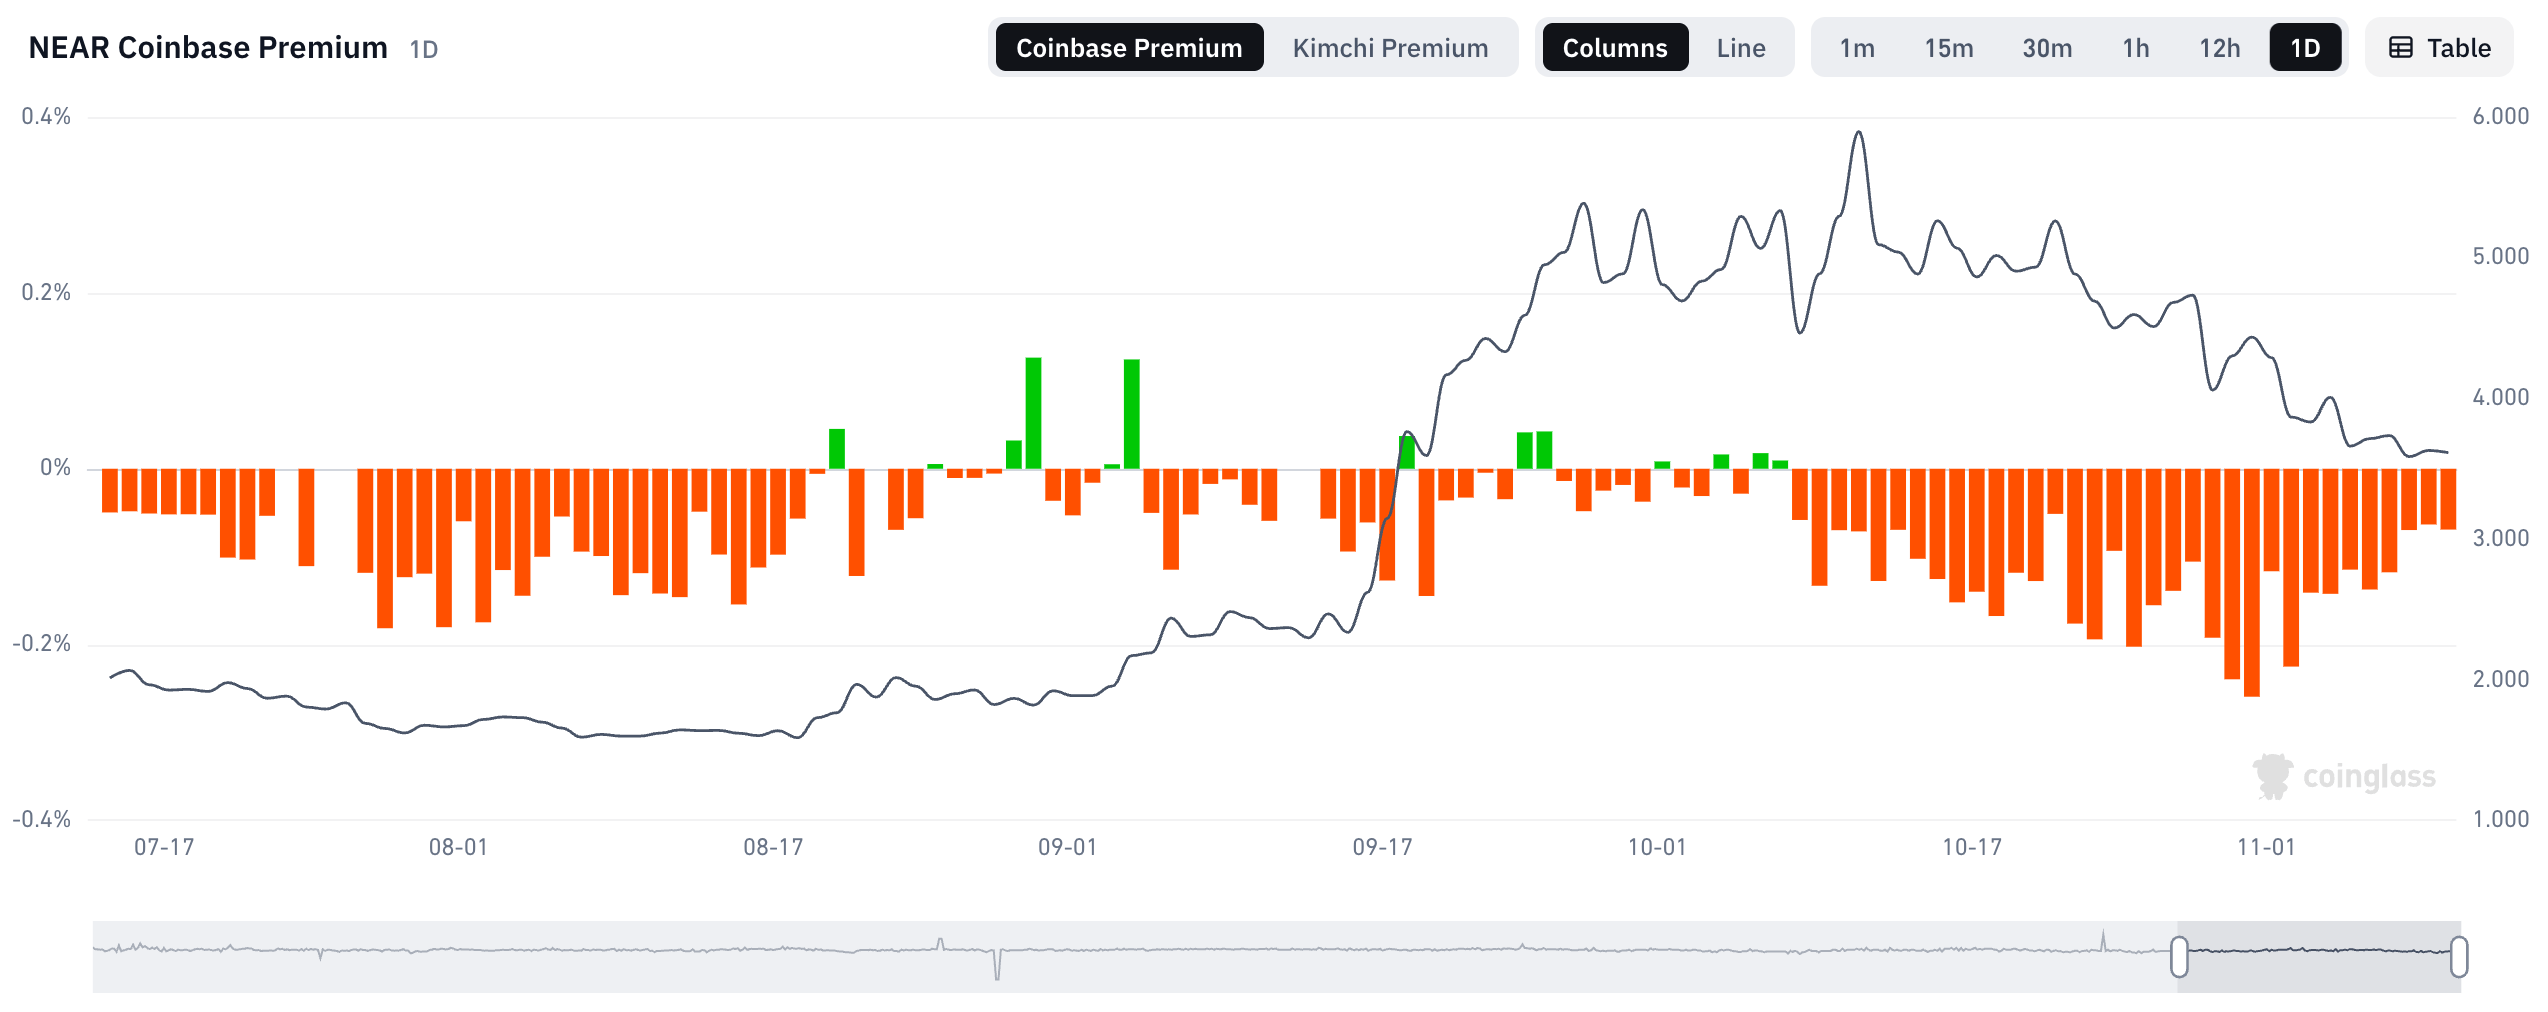
In addition, demand for the NEAR token in the US market is low. Coinbase offers it at a discount, with a negative premium of -0.097%, indicating that US investors are less interested in the token. For investors on the rebound lookout, a positive spike in Coinbase premium could forecast a bullish trend reversal, as previously seen on September 4 and multiple lower spikes in late September.
Technical outlook: Can NEAR defend its $3.40 support level?
NEAR Protocol trades at $3.6130 at press time on Tuesday, keeping a bearish near-term tone. On the four-hour chart, NEAR holds below the 50-period Exponential Moving Average (EMA) at $3.8332 and the 200-period EMA at $4.2614, reaffirming the downward trend.
From a technical perspective, NEAR is trading within a falling wedge pattern, with the descending trendline at $3.7981 and a support trendline near $3.4000. The immediate support emerging at the horizontal level around $3.4030 reinforces the support trendline. A confirmed breakout below this zone would expose the token to a deeper correction, with further cushions seen at $2.9780 and $2.7280.
Momentum shows mixed signals, with the Moving Average Convergence Divergence (MACD) line holding below and the Relative Strength Index (RSI) hovering near 43, both hinting at modest downside momentum.
Looking up, initial resistance is aligned at the downtrend line break area around $3.7981, followed closely by the 50-EMA at $3.8332. Beyond this, the horizontal barrier at $3.9160 acts as a higher resistance layer ahead of the 200-EMA near $4.2614.
(The technical analysis of this story was written with the help of an AI tool. Know more.)
Nothing in this material constitutes investment advice, personal recommendation, investment research, an offer, or a solicitation to buy or sell any financial instrument. The content has been prepared without consideration of your individual investment objectives, financial situation, or needs, and should not be treated as such.
Past performance is not a reliable indicator of future performance and/or results. Forward-looking scenarios or forecasts are not a guarantee of future performance. Actual results may differ materially from those anticipated.
Mitrade makes no representation or warranty as to the accuracy or completeness of the information provided and accepts no liability for any loss arising from reliance on such information.
Recommended Articles


