



Top Altcoins Price Forecast: Ripple, Cardano, and Solana remain vulnerable to further losses
- Ripple holds steady above its $1.00 psychological support on Tuesday, after five consecutive days of decline.
- Cardano hovers above $0.1700 with buyers defending the $0.1712 support level in focus.
- Solana continues its downtrend after breaking below a long-term support trendline.
Ripple (XRP), Cardano (ADA), and Solana (SOL) struggle to find their footing after last week’s decline amid a decline in institutional investors’ risk appetite. Ripple is close to testing its $1.00 psychological threshold, Cardano is putting a crucial horizontal level to the test, while Solana remains at risk of extending its downtrend after breaking a crucial support trendline.
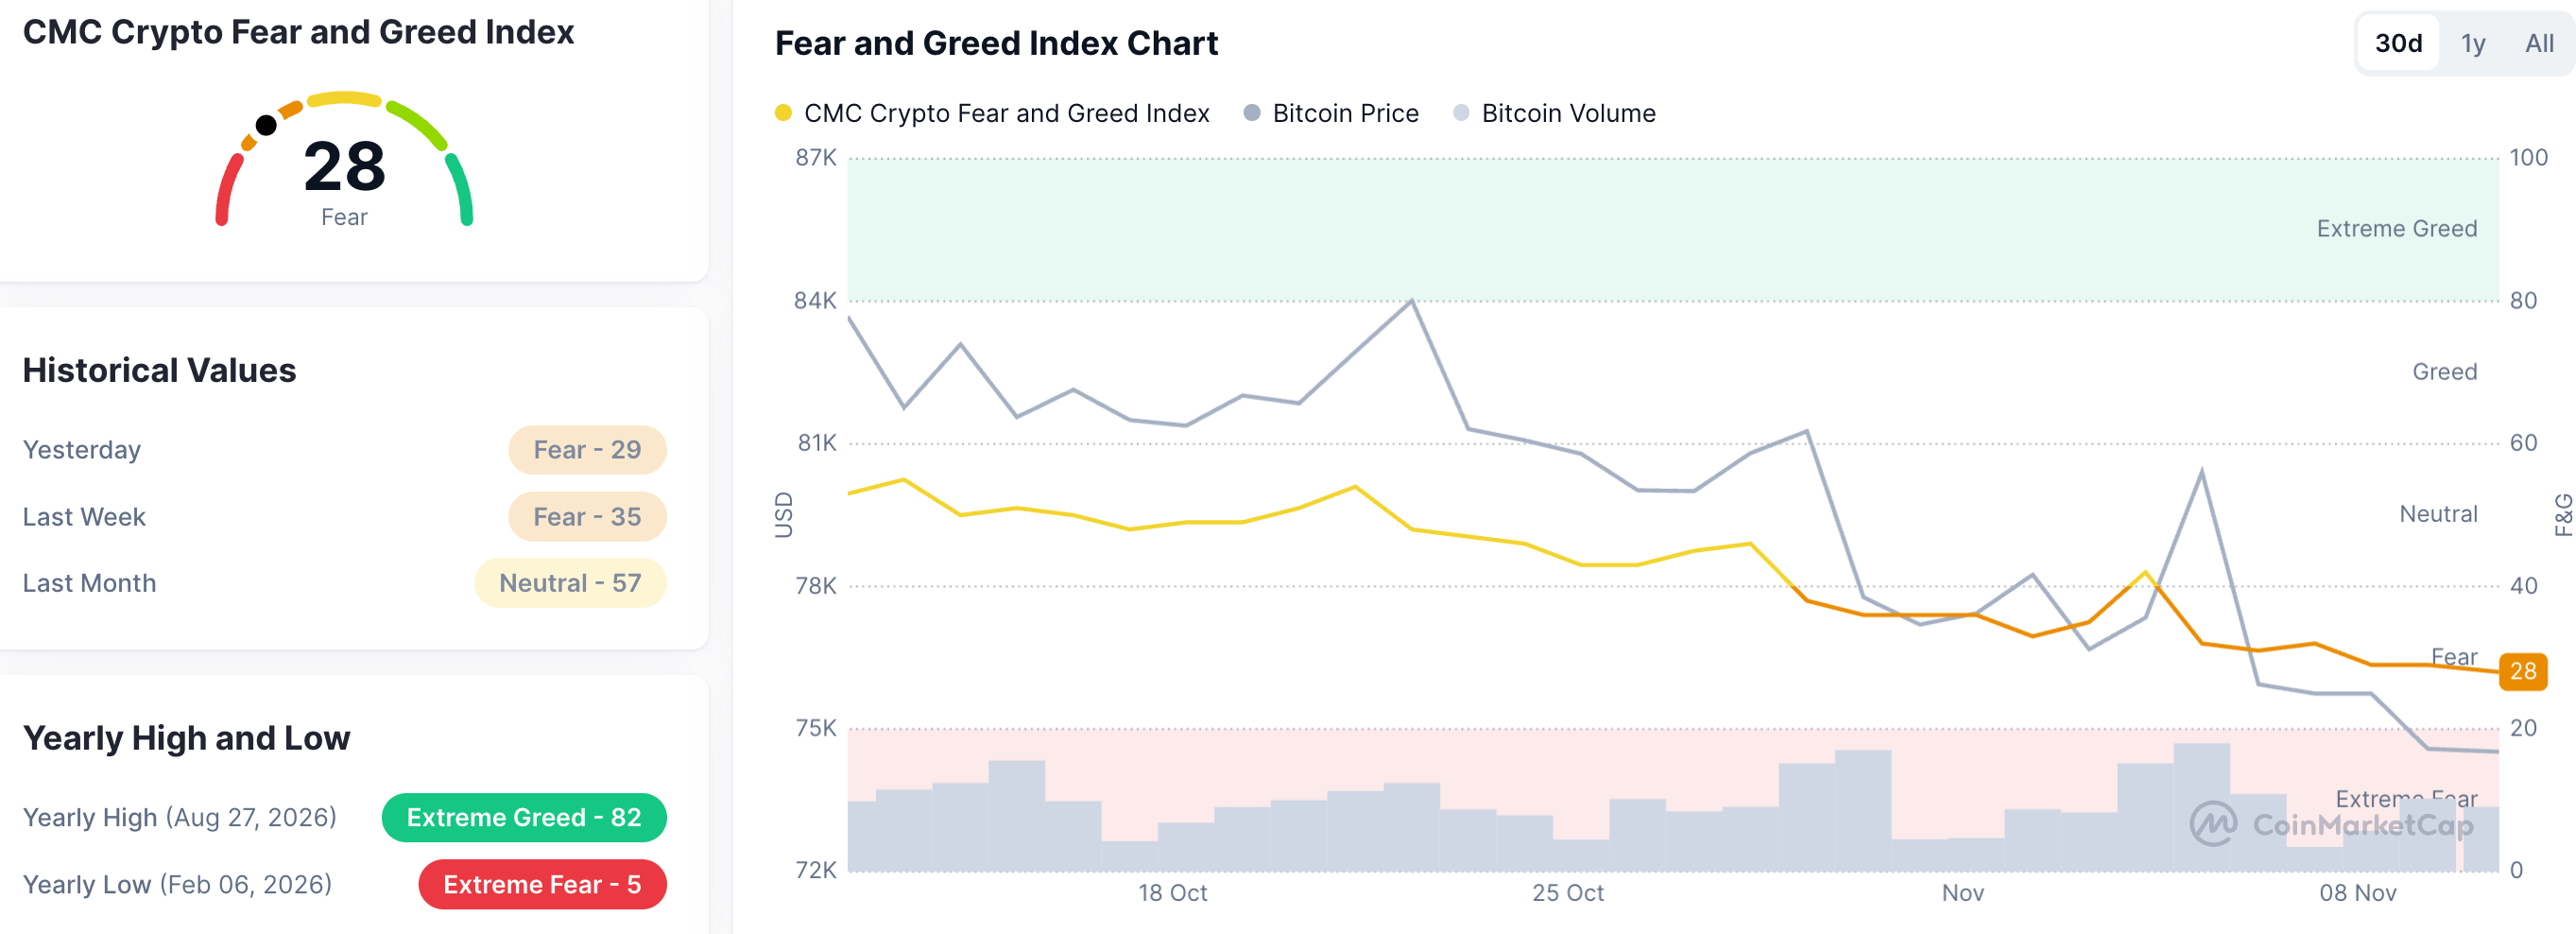
Market sentiment is weak as ceasefire talks between the US and Iran struggle to advance, while the odds of a truce have increased following Democrats’ majority in the US midterms. CoinMarketCap’s Fear and Greed Index is down to 28 on Tuesday, from 35 last week, suggesting a rise in risk-off sentiment among investors.
XRP and SOL ETFs face outflows while Cardano regains retail support
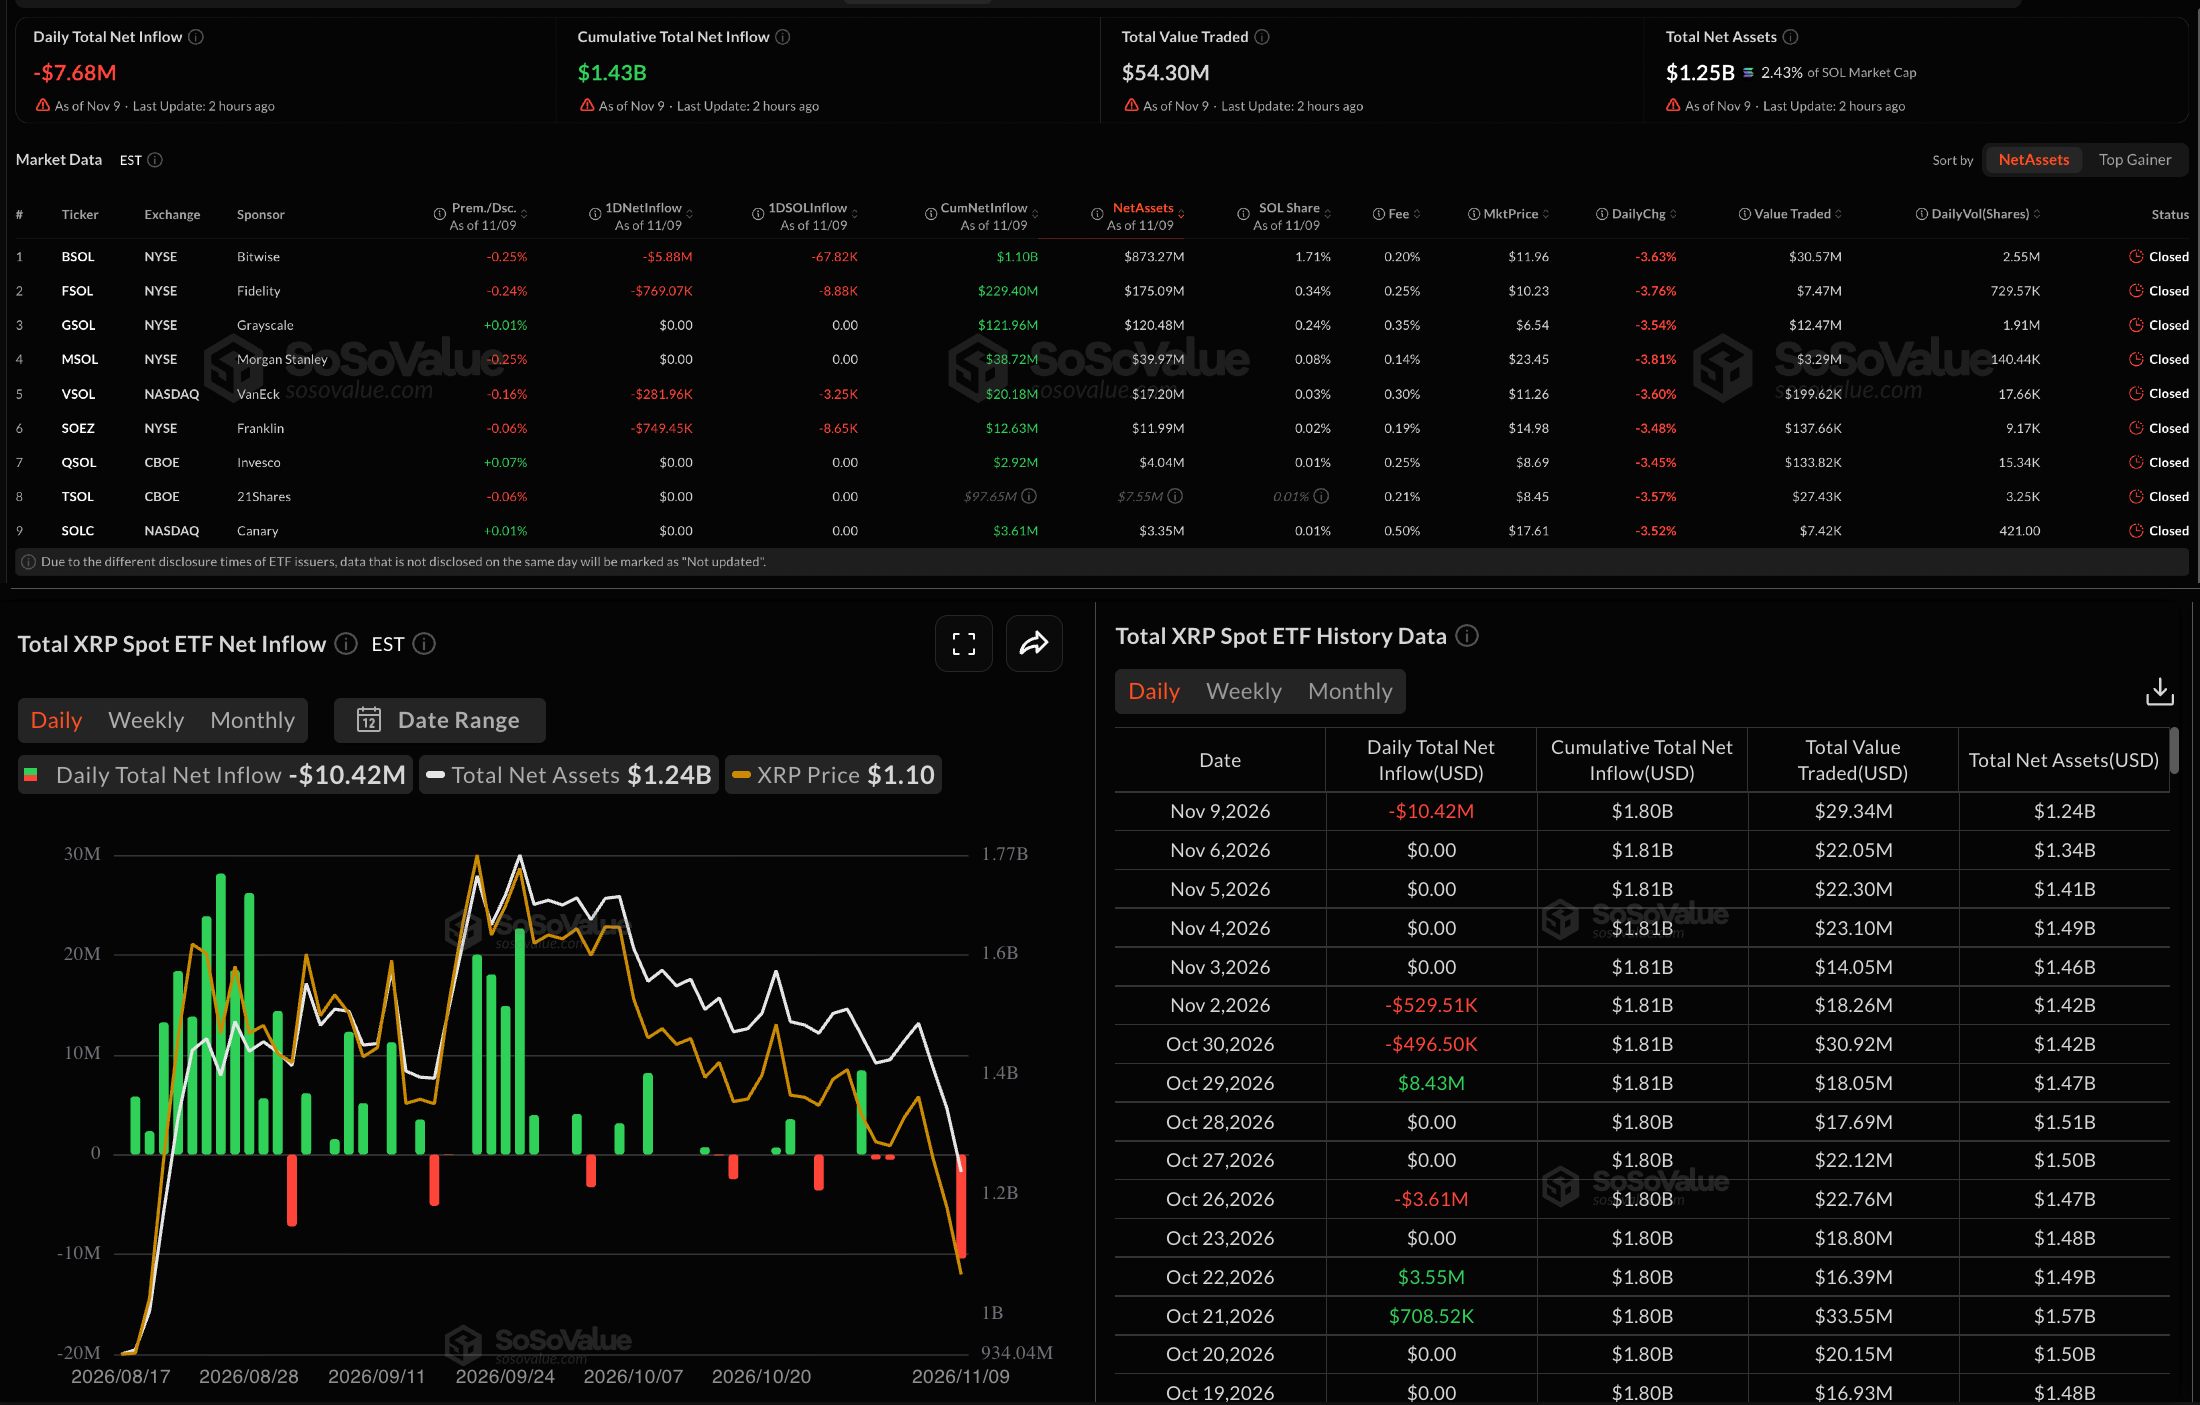
Ripple- and Solana-focused Exchange-Traded Funds (ETFs) face intense selling pressure. SoSoValue data shows that XRP ETFs recorded their largest daily outflow in eight months, at $10.42 million on Monday, while eight US SOL spot ETFs recorded $7.68 million in withdrawals, except for the 21shares TSOL, for which the numbers are still in the air.
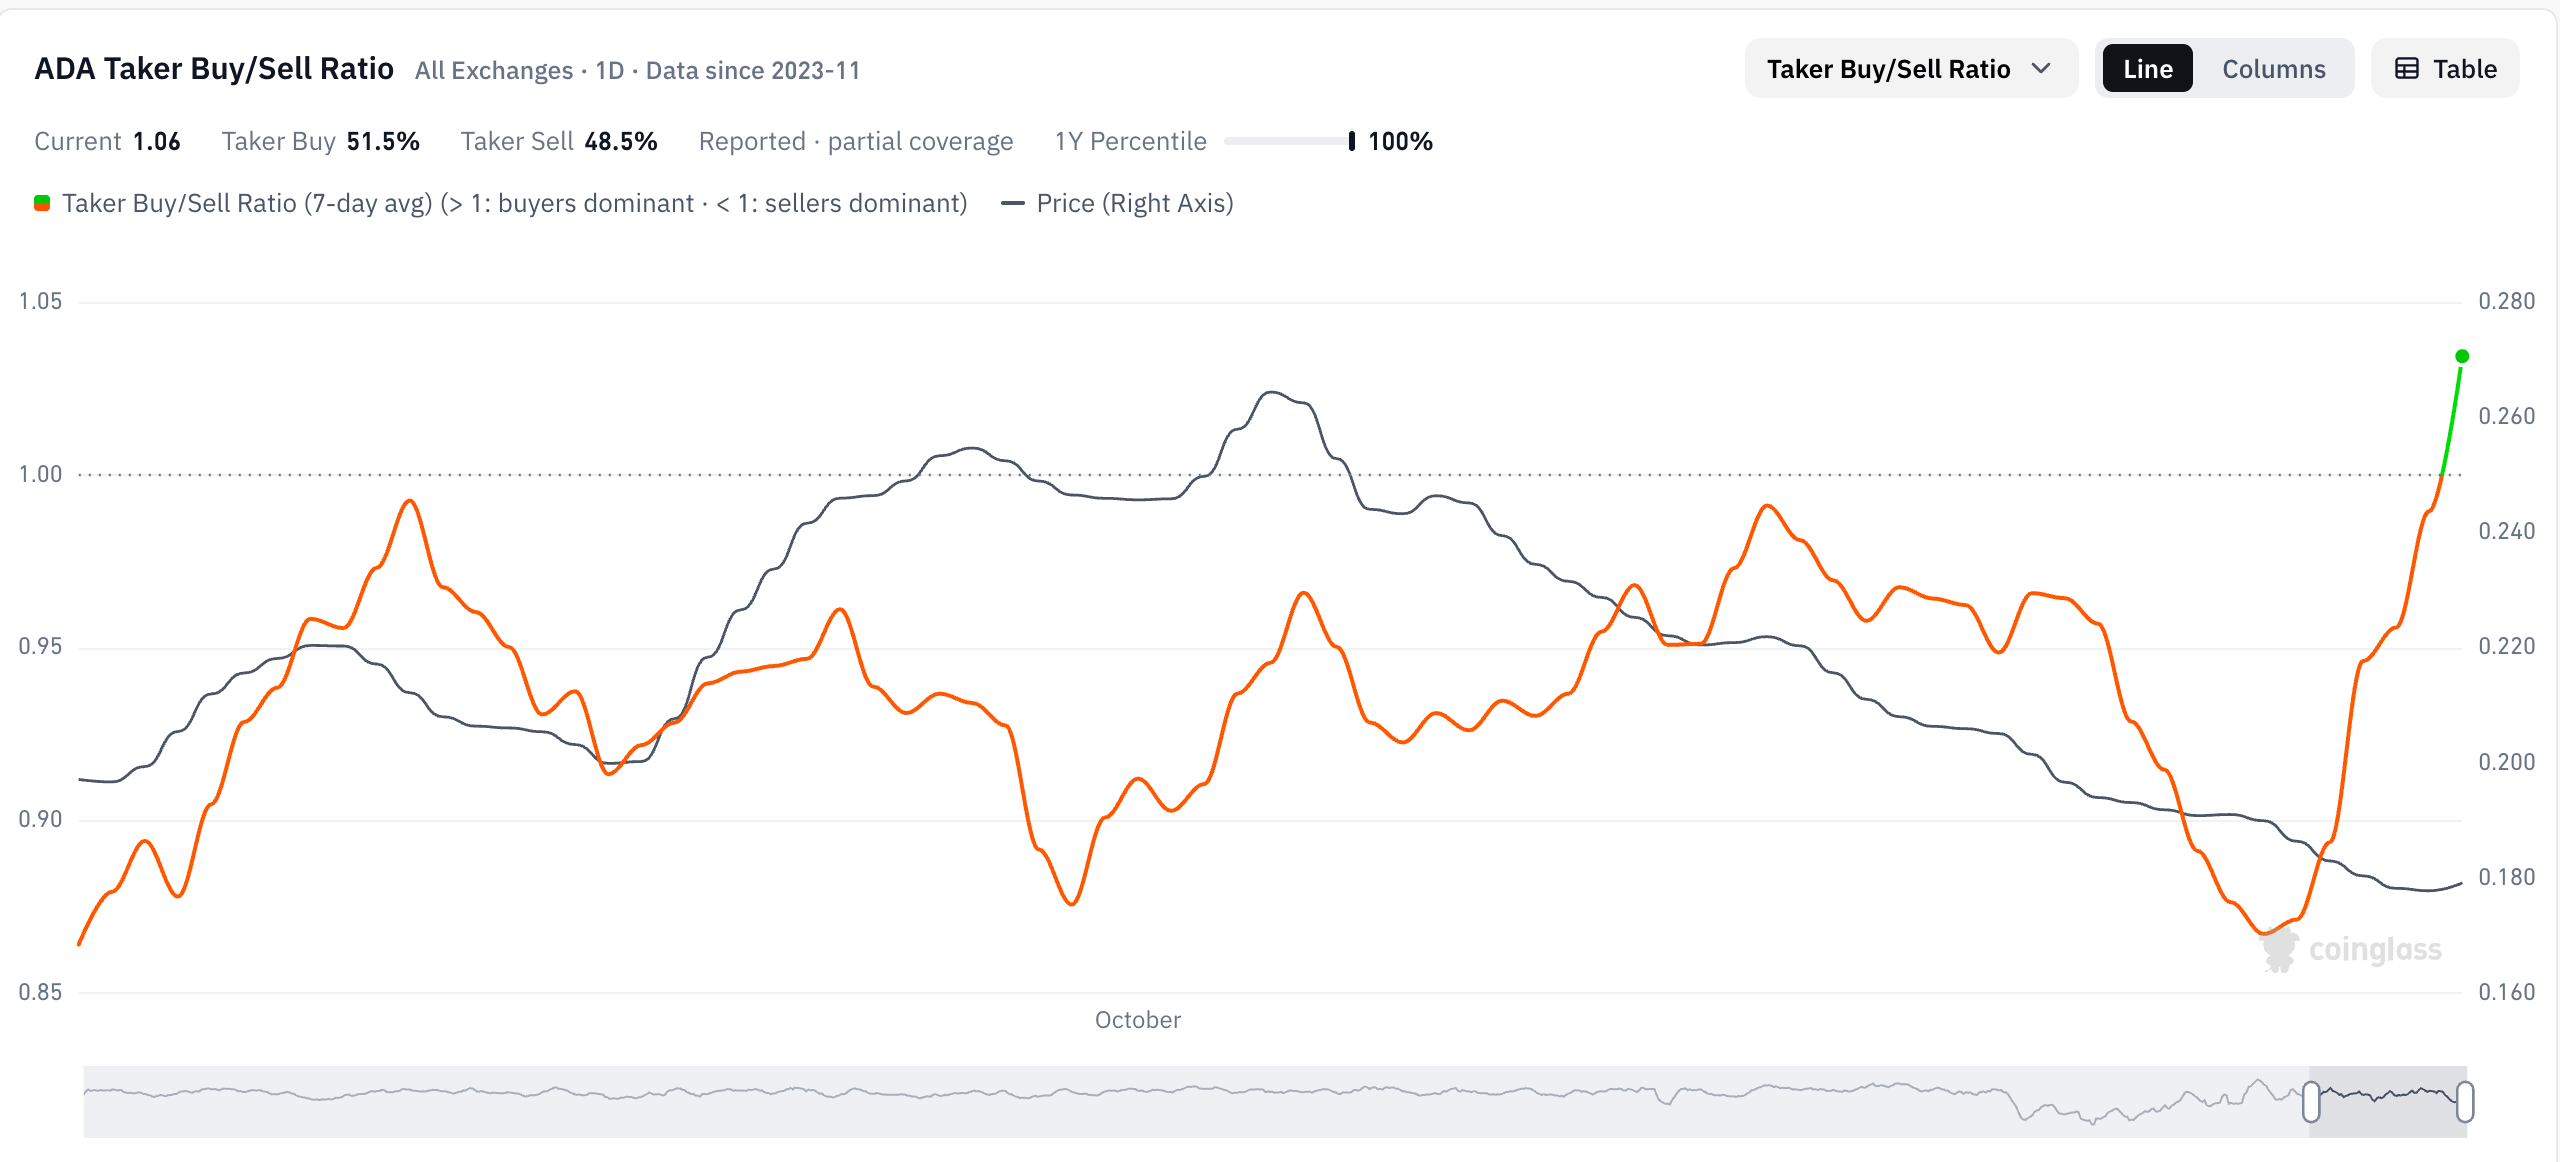
Meanwhile, Cardano shows signs of renewed demand in the derivatives market. CoinGlass data shows the ADA taker buy-to-sell ratio rising to 1.06, from 0.86 the previous day, indicating renewed buying pressure as traders are now aggressively crossing the spread and consuming liquidity faster than sellers.
Taken together, Cardano shows signs of near-term resilience, while Ripple and Solana could be exposed to deeper corrections.
Technical analysis: Ripple risks breaking below $1
XRP trades at $1.0977 at press time on Tuesday, maintaining a bearish near-term tone. The cross-border remittance token holds well below the 50-day Exponential Moving Average (EMA) at $1.2945 and the 200-day EMA at $1.3656.
Momentum is weak, with the Relative Strength Index (RSI) hovering near oversold territory at 26 and the Moving Average Convergence Divergence (MACD) in negative territory, both of which suggest that selling pressure remains dominant.
The immediate support is seen at the horizontal level around $1.0692, ahead of a deeper structural floor near $0.9862, where buyers previously emerged.
Looking up, initial resistance is defined by the downward trendline reference near $1.2259, followed by the 50-day EMA at $1.2945 and the 200-day EMA at $1.3656.
Cardano technical analysis: ADA wanes
Cardano trades at $0.1787, holding above its $0.1712 support floor after last week's 9% decline. From a technical perspective, the steady decline in ADA over the last five weeks takes a mild breather at a near-term support after breaking below a long-term support trendline around $0.2058. A slip below the $0.1712 immediate support could expose ADA to a more important base at $0.1537, with $0.1385 underpinning the broader bearish structure.
In addition, ADA holds both the 50-day EMA at $0.2081 and the 200-day EMA below at $0.2321, which now acts as resistance. Meanwhile, momentum remains fragile, with the RSI hovering near 33, just above oversold territory, and the MACD negative and below its signal line.
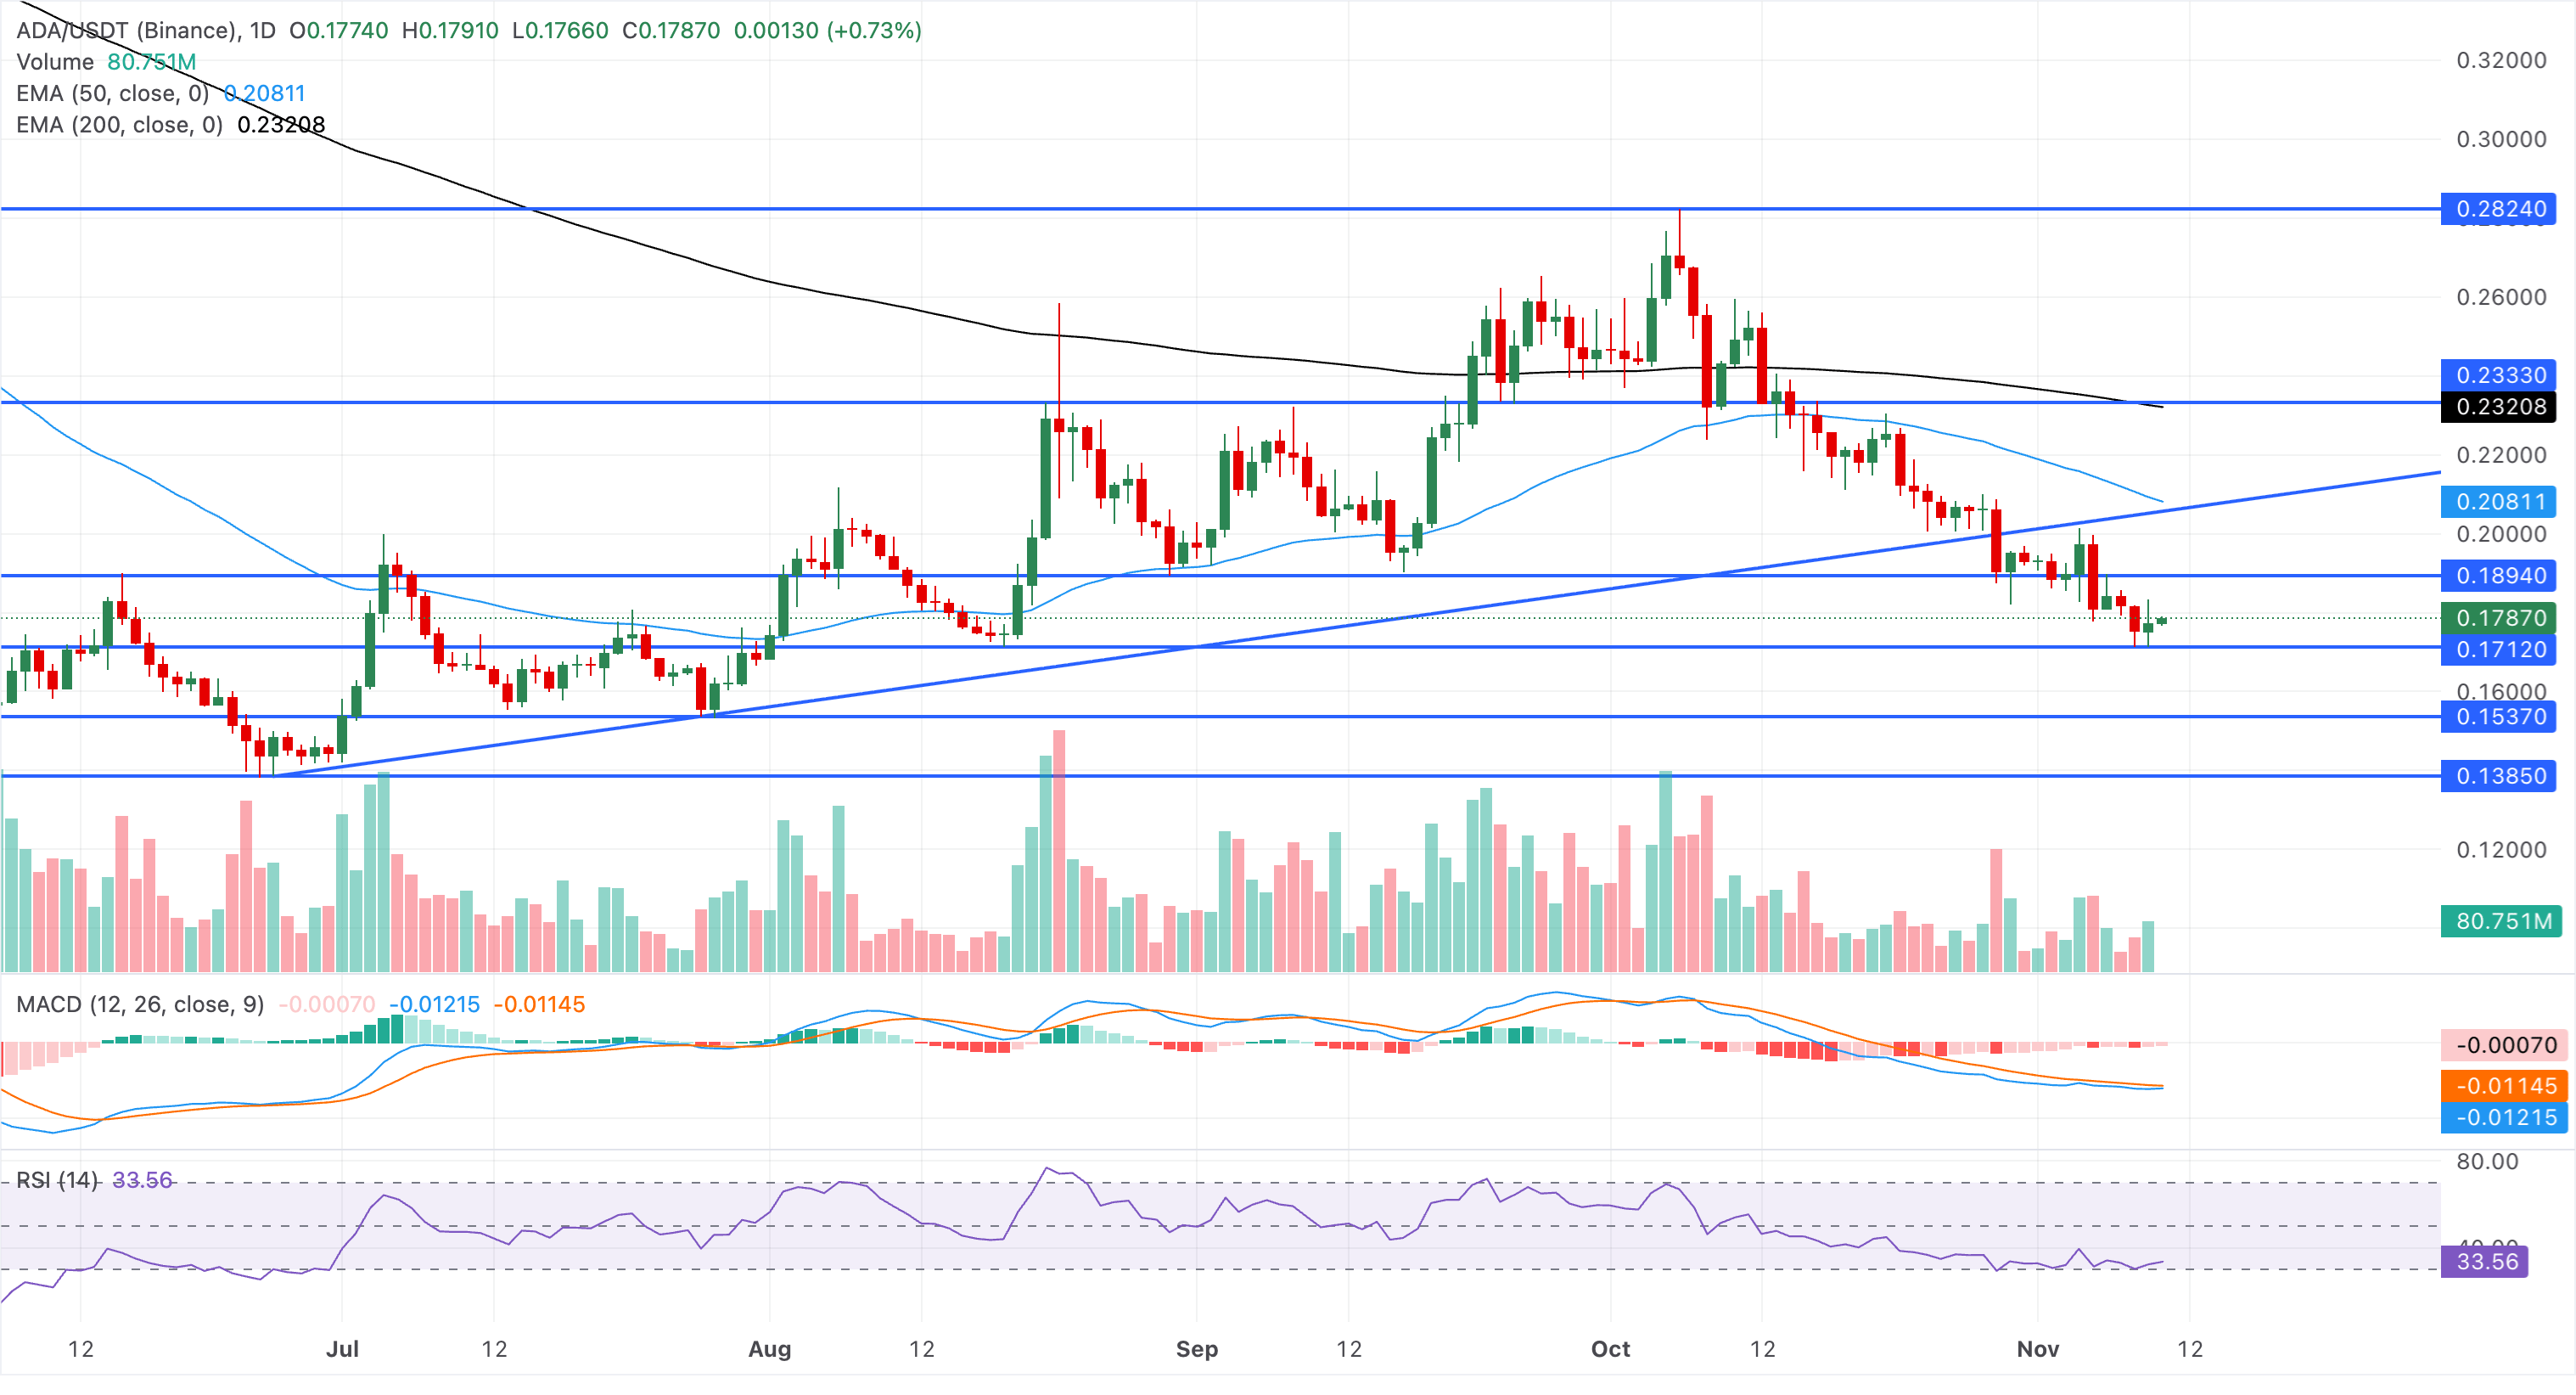
On the flip side, initial resistance is seen at $0.1894, with the former trendline floor at $0.2058 and the 50-day EMA at $0.2081.
Technical outlook: Death Cross looms over Solana
Solana hovers around $86.14, maintaining a medium-term declining trend since early October. SOL trades below both the 50-day and 200-day EMAs, now clustered around $99–$100, with overhead resistance and a risk of a bearish crossover.
The recent break beneath the rising trendline near $90.62 reinforces a corrective phase. SOL's path of least resistance suggests a steeper correction toward the $77.60 support floor.
The RSI hovering around 27 signals oversold conditions but not yet a confirmed rebound, and the MACD remains below the zero line, hinting at persistent downside pressure.
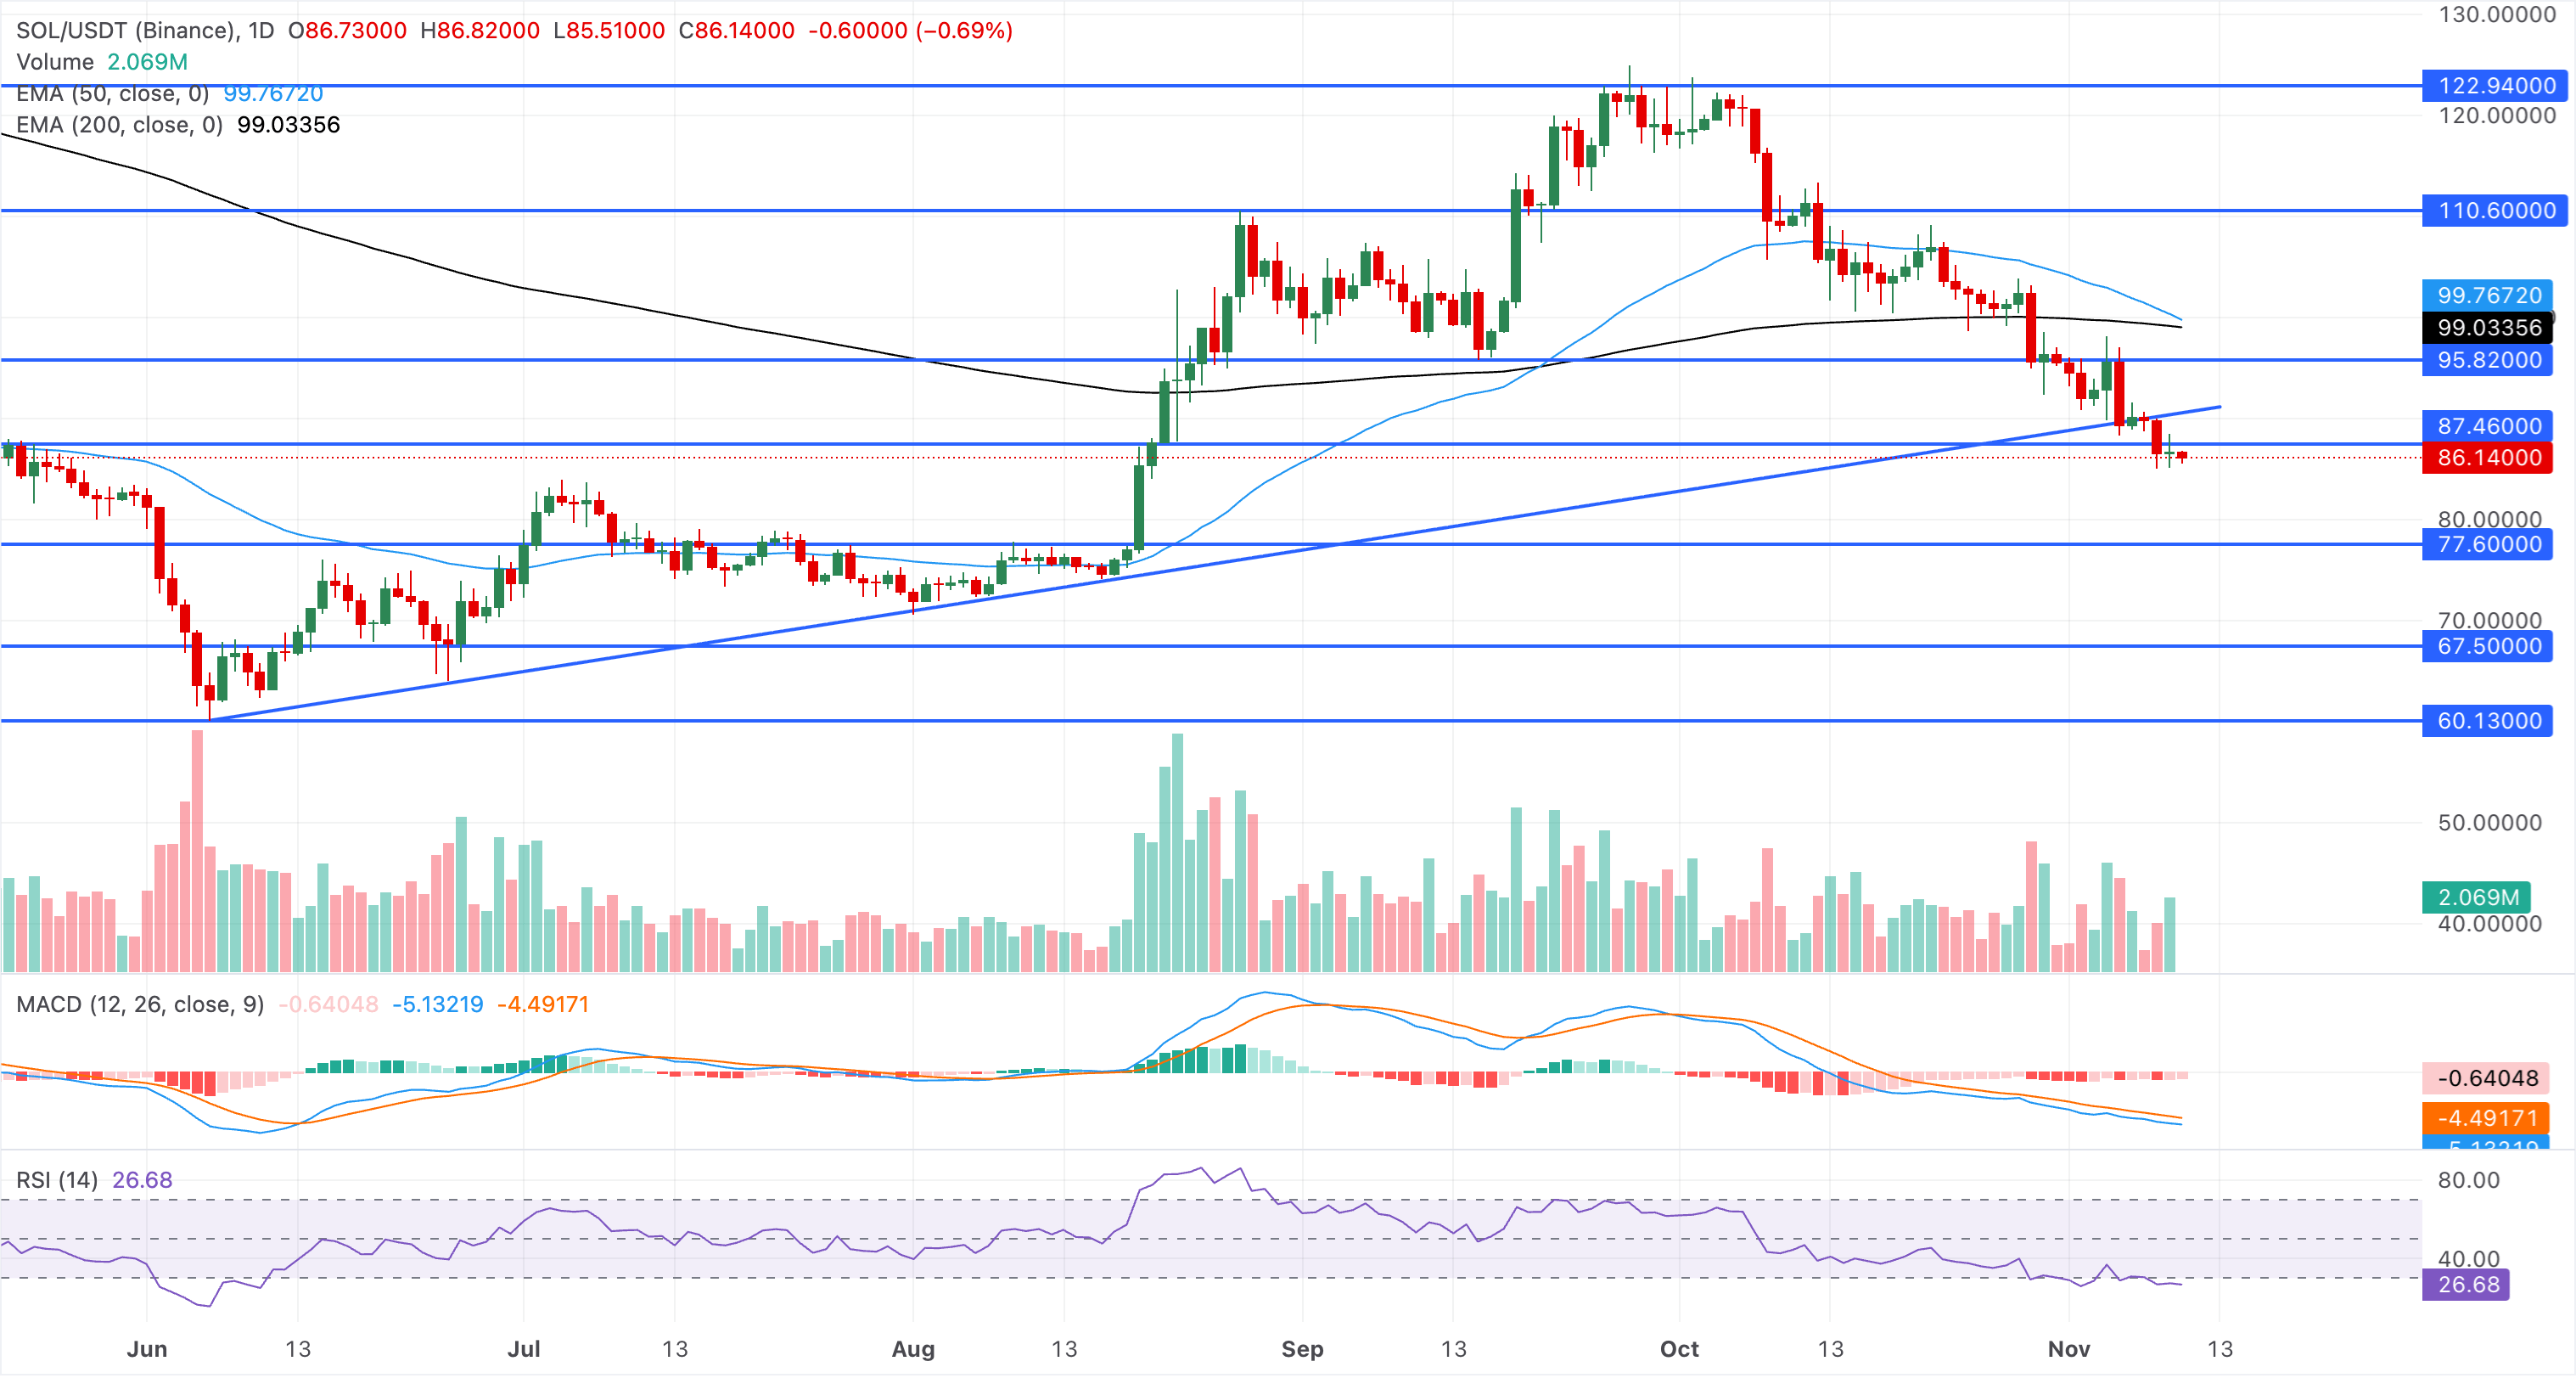
On the topside, initial resistance emerges at $87.46, ahead of the former trendline support, now turned resistance, around $90.62, with a more significant cap at the horizontal barrier near $95.82.
(The technical analysis of this story was written with the help of an AI tool. Know more.)
Nothing in this material constitutes investment advice, personal recommendation, investment research, an offer, or a solicitation to buy or sell any financial instrument. The content has been prepared without consideration of your individual investment objectives, financial situation, or needs, and should not be treated as such.
Past performance is not a reliable indicator of future performance and/or results. Forward-looking scenarios or forecasts are not a guarantee of future performance. Actual results may differ materially from those anticipated.
Mitrade makes no representation or warranty as to the accuracy or completeness of the information provided and accepts no liability for any loss arising from reliance on such information.
Recommended Articles


