



Zcash Price Forecast: ZEC tests $1,000 support as hot US CPI data offsets Grayscale’s marketing
- Zcash nears $1,000 on Wednesday, extending losses for the fifth consecutive day.
- Hot US CPI and rising odds of Fed rate hikes weigh on investors’ appeal toward high-risk assets.
- Grayscale launches a major Zcash ad campaign and redirects sponsor fees toward the network's development, marketing, community, and education.
Zcash (ZEC) is down to almost $1,000 on Wednesday, facing intense selling pressure over the last five days, with losses totaling over 20%. The hotter-than-expected US monthly inflation data offset the Grayscale’s Zcash-focused marketing campaign and the sponsor fees contribution to the network.
The technical outlook for Zcash is bearish as the downside momentum gains traction, bringing a crucial moving average around $880 into focus.
US inflation weighs on the crypto market
The US Consumer Price Index (CPI) data came in hot on Tuesday, with a 0.4% rise in October, above the market expectation of 0.3%. This followed the 0.6% increase reported in September, raising inflation concerns and the odds of a rate hike in the US.
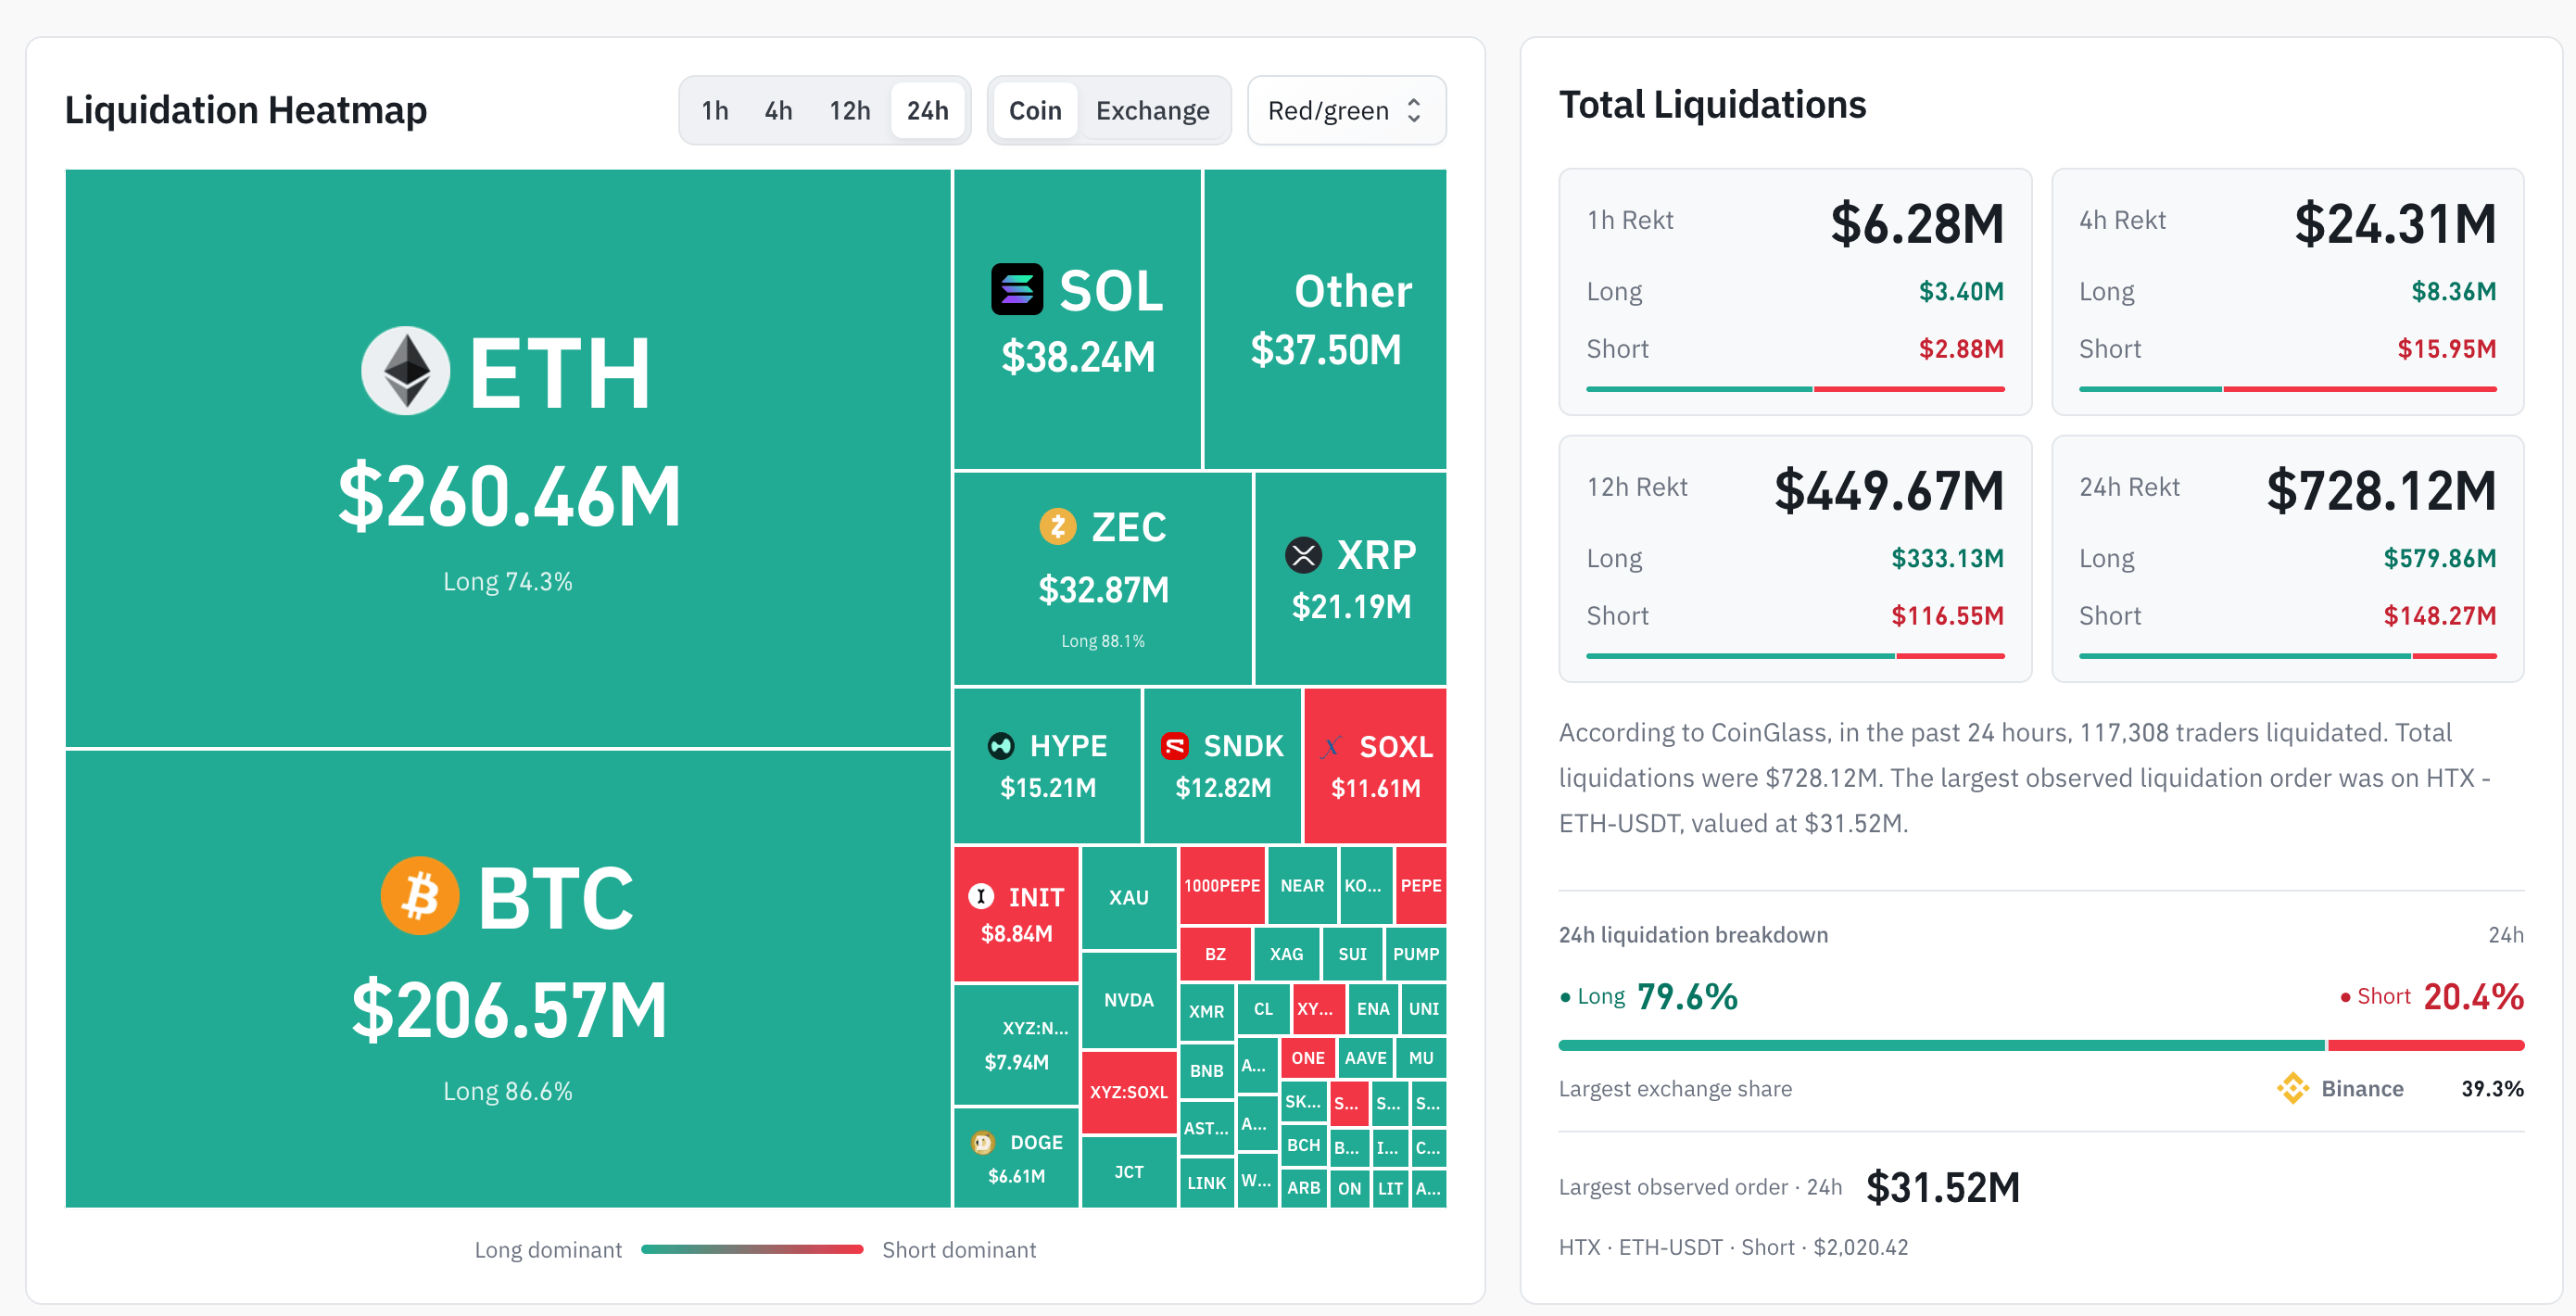
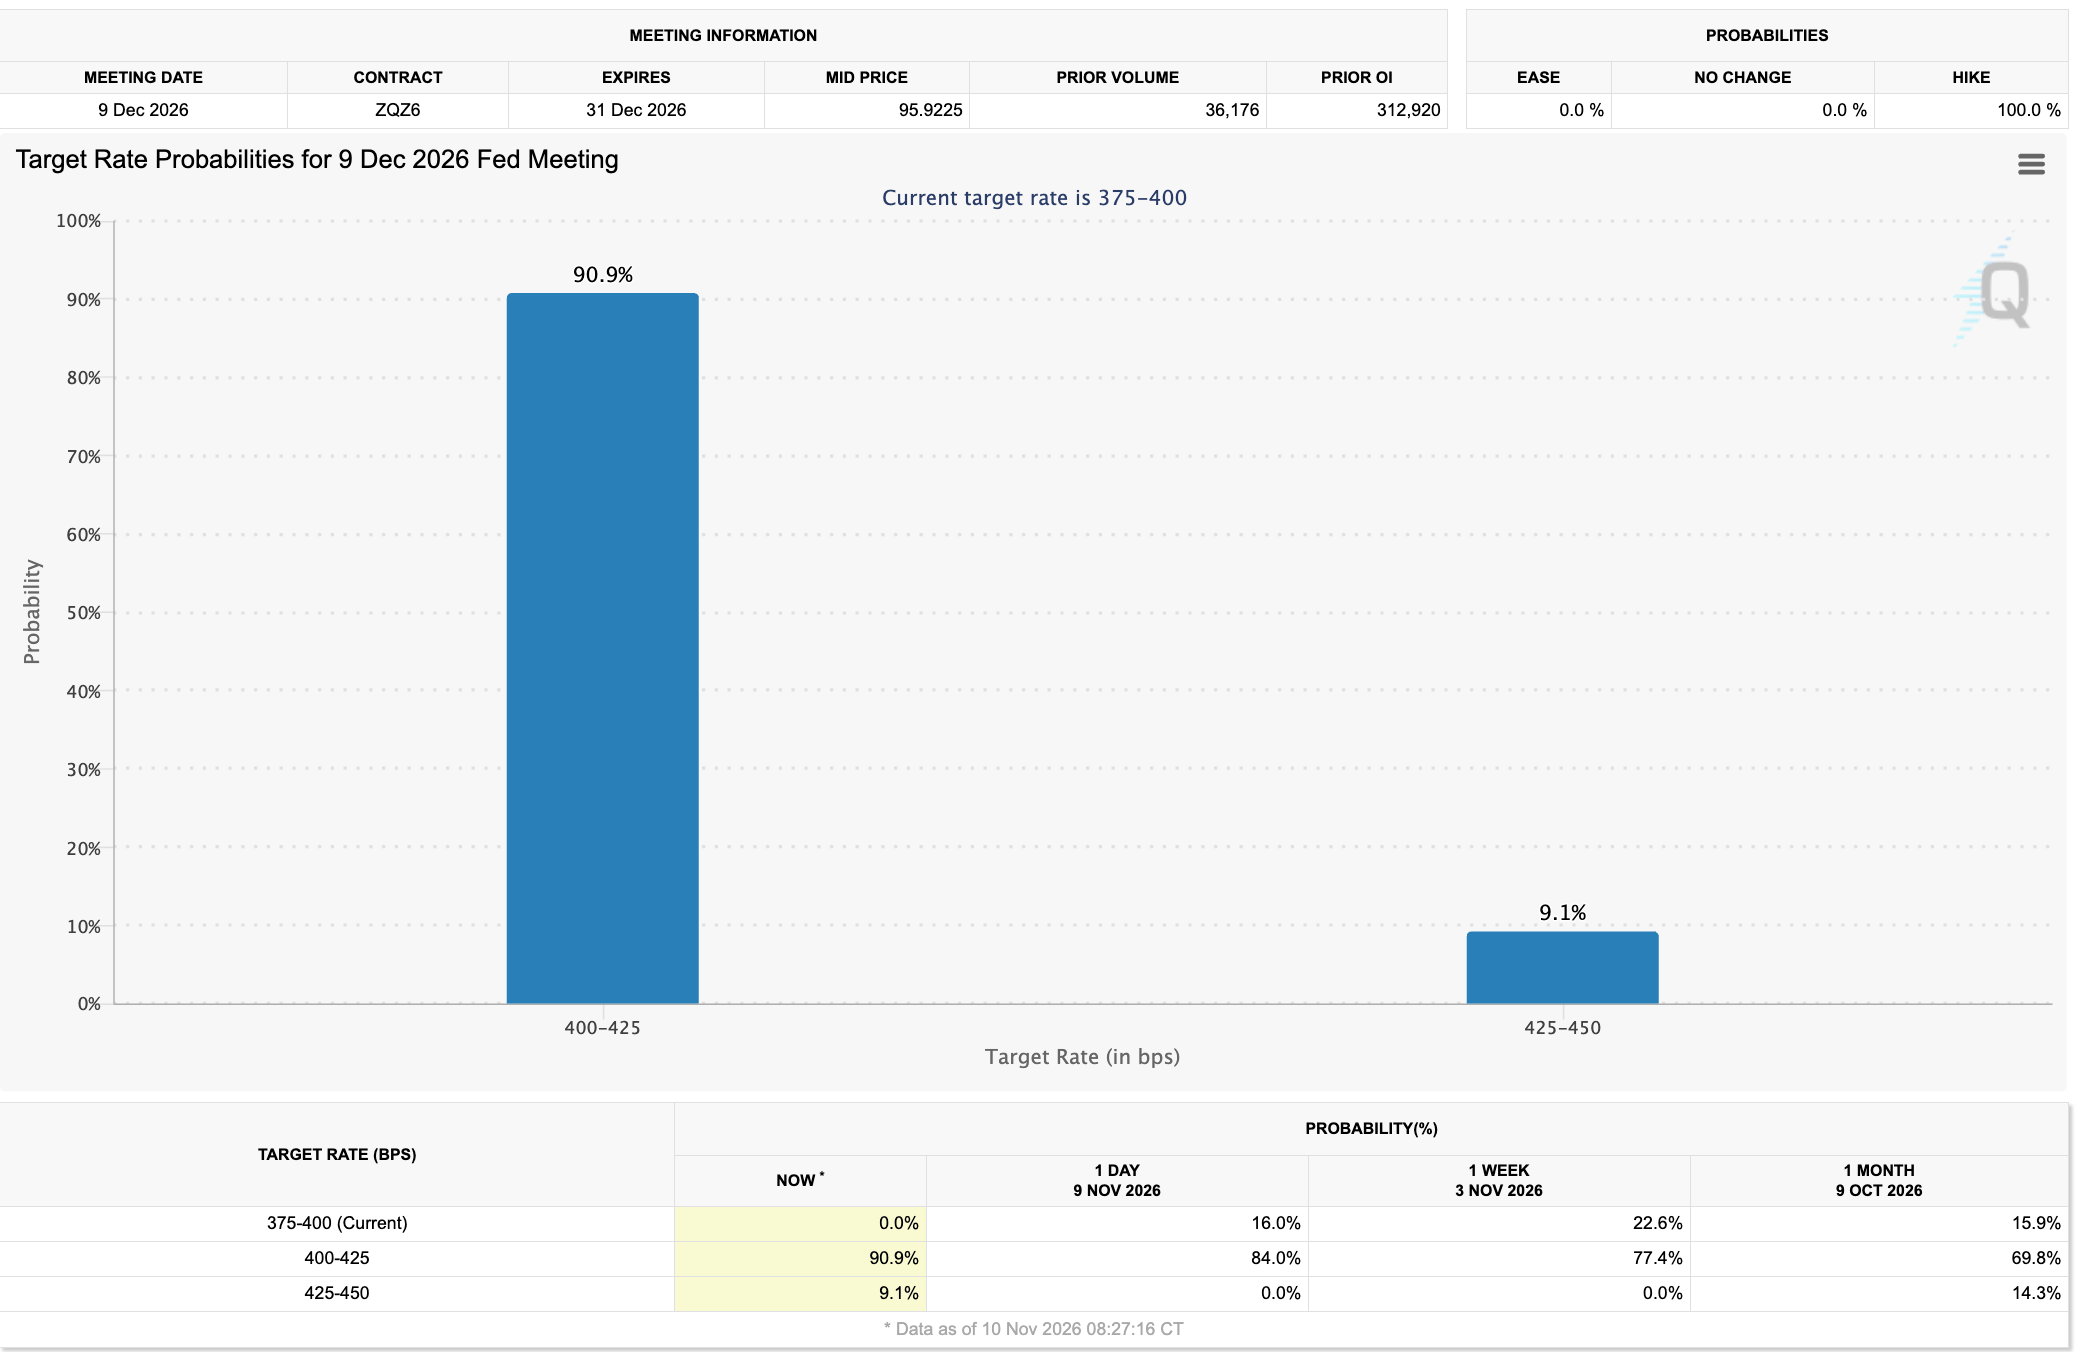
The CME FedWatch Tool shows a 90% probability that the Fed could raise rates by 25 basis points (bps) at the December 9 meeting, reducing liquidity in high-risk assets. This has hit the crypto market hard, with over $700 million liquidated in the last 24 hours, led by nearly $580 million in longs, as previously reported by FXStreet.
Bitcoin (BTC) slipped below $74,000, while Zcash fell 10% on Tuesday, putting it at risk of further downside below $1,000. The ZEC price drop offset the potential gains from Grayscale’s marketing campaign on the Wall Street Journal’s front page and the offering of its sponsor fees toward Zcash’s network development, marketing, community, and education.
However, the correction suggests that the market is pricing in the likelihood of a 25 bps rate hike, after which the crypto prices could stabilize and even recover.
Derivatives market flips bearish on Zcash
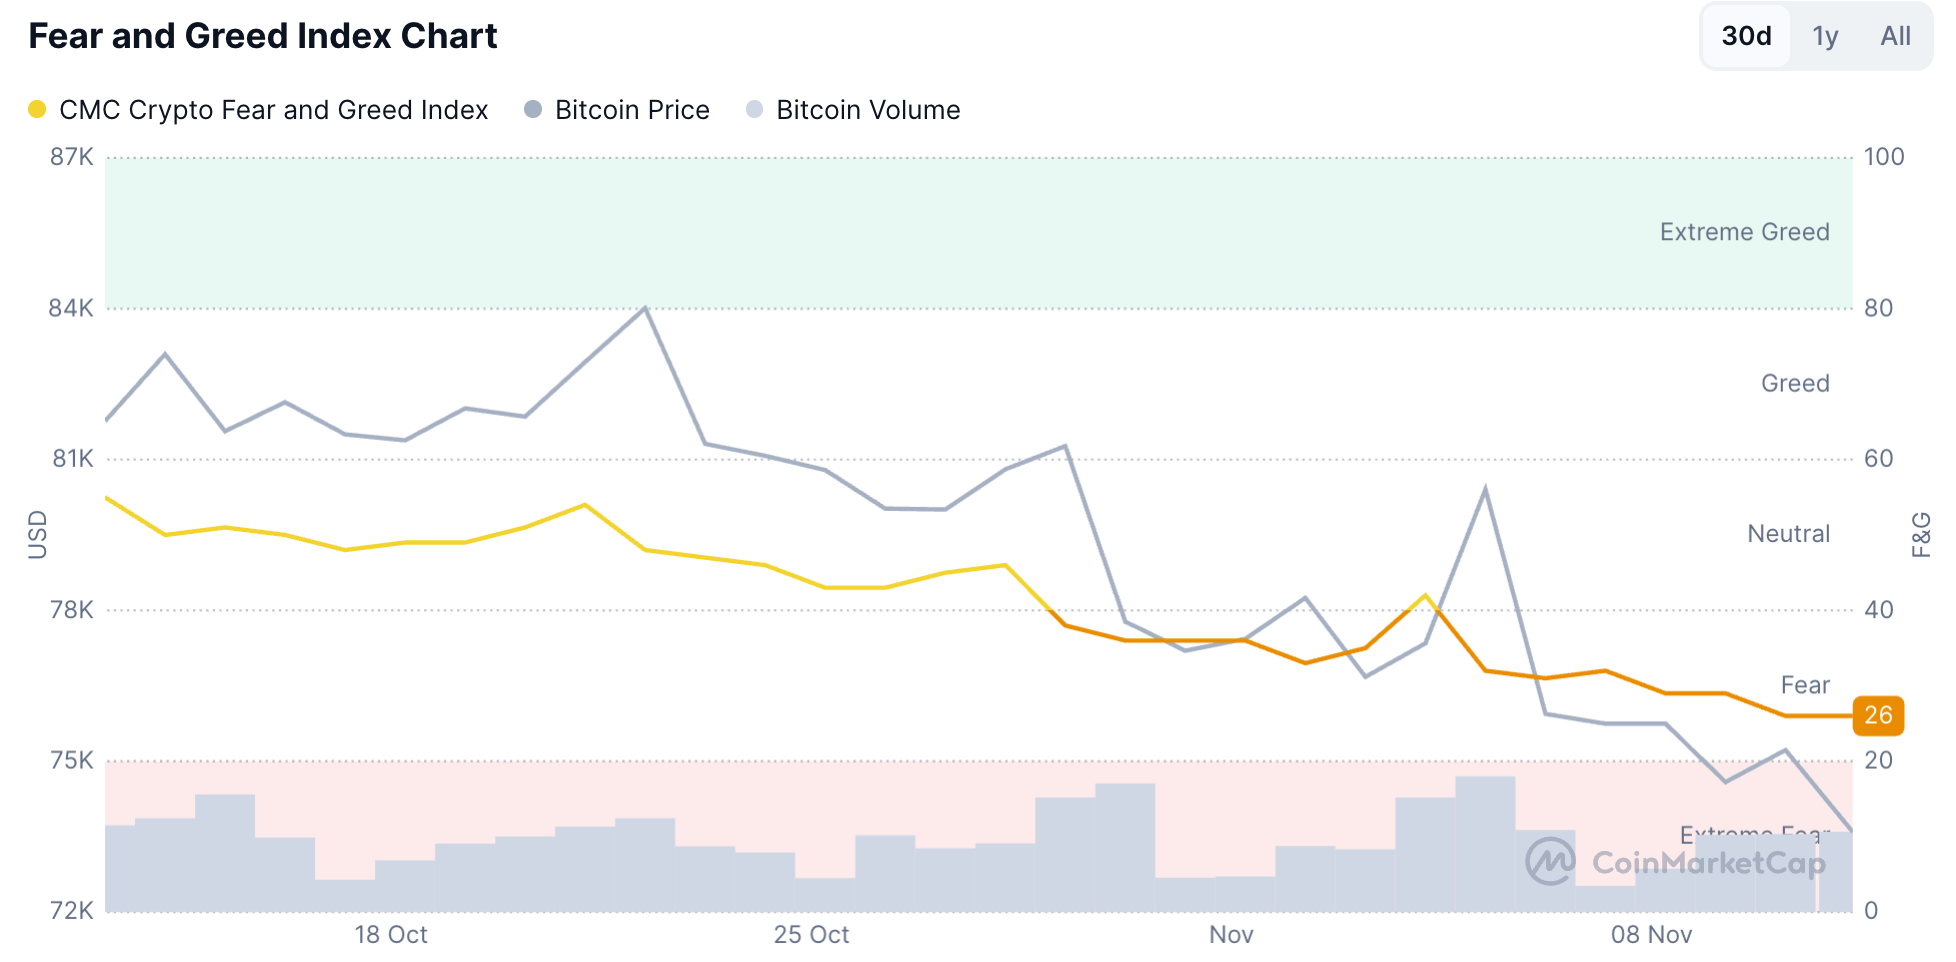
The crypto derivatives market shows a firm sell-side inclination as investors' fears peak. CoinMarketCap’s Fear and Greed Index drops to 26 on Wednesday, down from 42 last week, indicating a steady decline in investors’ risk appetite, following last week’s Democratic Party’s win in the US midterm elections and now the rising inflation concerns.
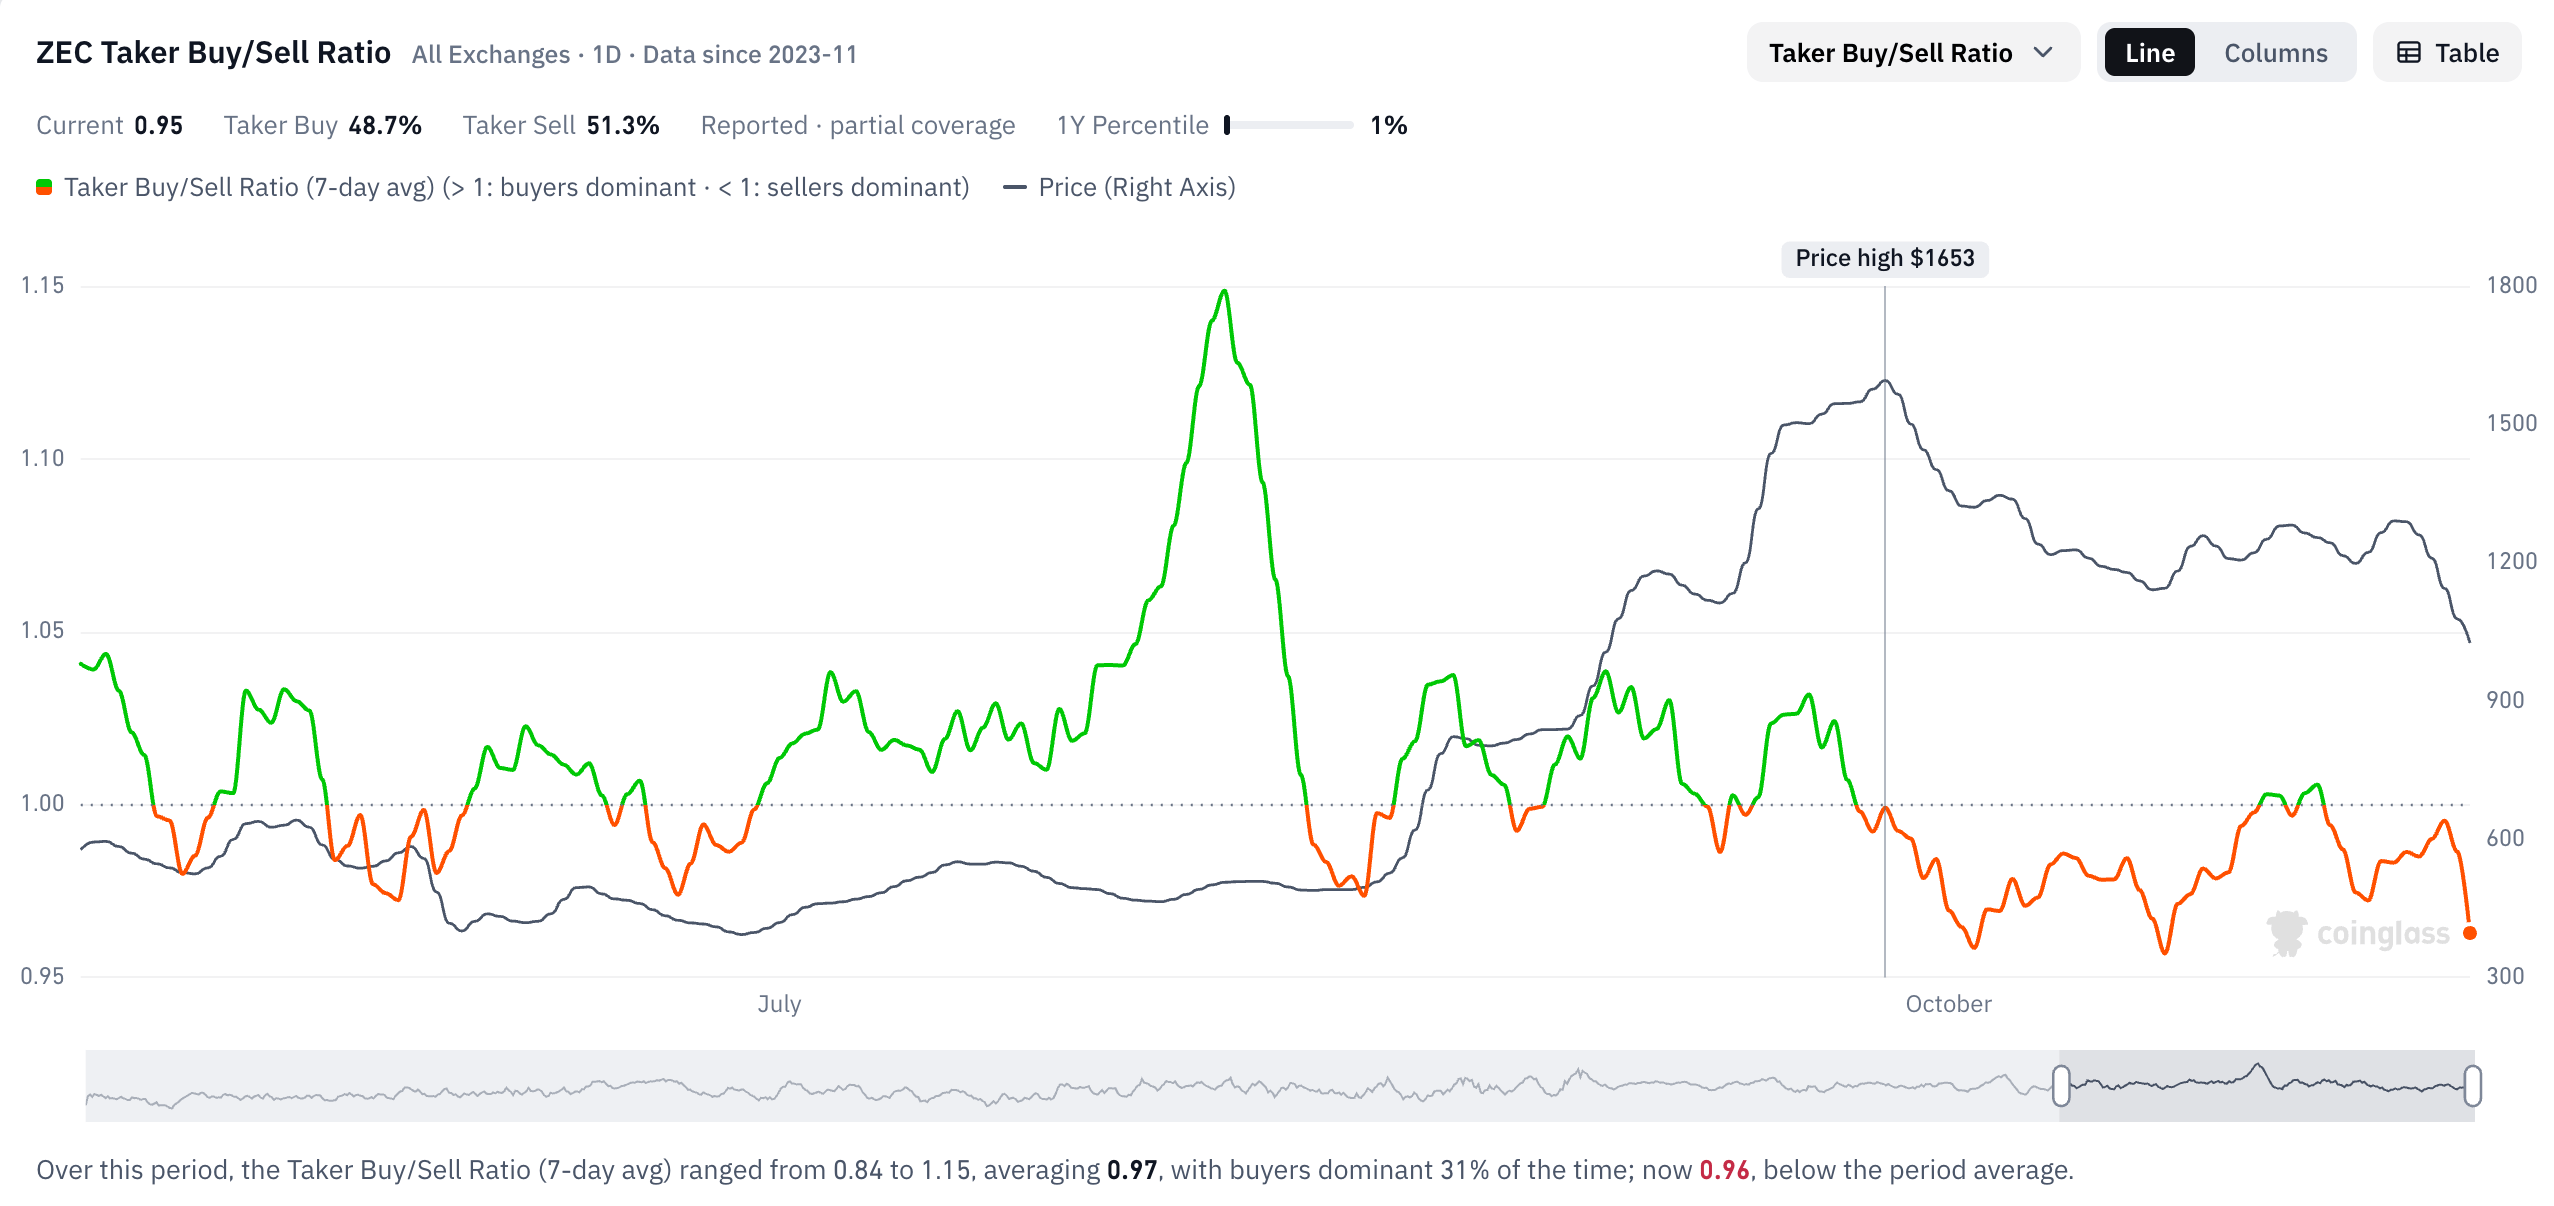
CoinGlass data shows the Zcash futures taker buy-to-sell ratio has dropped below 1, to 0.95 on Wednesday, suggesting that fresh market orders are instantly sweeping the resting bids. This decline in buy-side liquidity signals downward pressure and suggests panic selling as the broader crypto market slides.
Technical outlook: Zcash risks losing the $1,000 mark
Zcash is down 3% at press time on Wednesday, advancing a knife-fall move over the last five days. The corrective phase in the privacy coin extends below the 50-day Exponential Moving Average (EMA) at $1,202, and inches toward the longer-term 200-day EMA at $880.
From a technical perspective, the 10% on Tuesday confirmed a bearish breakout of a consolidation range between the October 8 high and low at $1,340 and $1,112, respectively. The close also breached the $1,050 horizontal support that had helped Zcash rebound on October 18, paving the way toward the 200-day EMA at $880.
Momentum tilts to the downside on the daily chart, with the Moving Average Convergence Divergence (MACD) descending below zero as the negative histogram profile expands, while the Relative Strength Index (RSI) declines to 36 amid persistent downside pressure.
Looking up, Zcash must reclaim the support-turned-resistance levels around $1,050 and $1,112 to ease the immediate bearish tone and reopen the path toward the 50-day EMA at $1,202.
(The technical analysis of this story was written with the help of an AI tool. Know more.)
Nothing in this material constitutes investment advice, personal recommendation, investment research, an offer, or a solicitation to buy or sell any financial instrument. The content has been prepared without consideration of your individual investment objectives, financial situation, or needs, and should not be treated as such.
Past performance is not a reliable indicator of future performance and/or results. Forward-looking scenarios or forecasts are not a guarantee of future performance. Actual results may differ materially from those anticipated.
Mitrade makes no representation or warranty as to the accuracy or completeness of the information provided and accepts no liability for any loss arising from reliance on such information.
Recommended Articles


