



Dogecoin Price Forecast: DOGE slips to a new yearly low
- Dogecoin trades around $0.068 on Wednesday after correcting to a new yearly low of $0.066 the previous day.
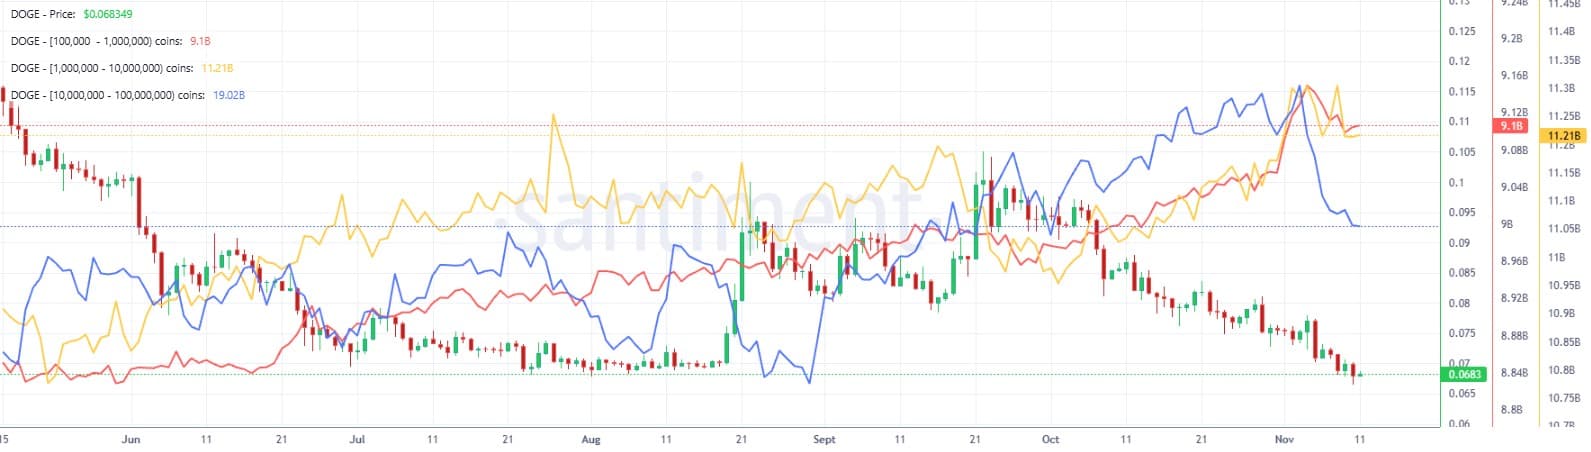
- Santiment data shows large whales offloading DOGE, fueling the near-term selling pressure.
- Weakening on-chain metrics and deteriorating technical outlook suggest DOGE could face further downside risks.
Dogecoin (DOGE) recovers mildly, trading around $0.068 on Wednesday after hitting a new yearly low the previous day. Santiment data shows whale wallets offloading DOGE holdings, fueling near-term selling pressure. Meanwhile, weakening on-chain metrics and bearish technical indicators suggest that the meme coin could face further downside risks.
Whales offloading DOGE tokens
Santiment’s Supply Distribution data shows cooling signs among whales. The metric indicates that whales holding between 100,000 and 1 million (red line), 1 million and 10 million (yellow line), and 10 million and 100 million tokens (blue line) have shed 750 million DOGE tokens since November 3. This continued distribution from whale wallets adds near-term selling pressure to the dog-themed meme coin.
On-chain data shows bearish bias
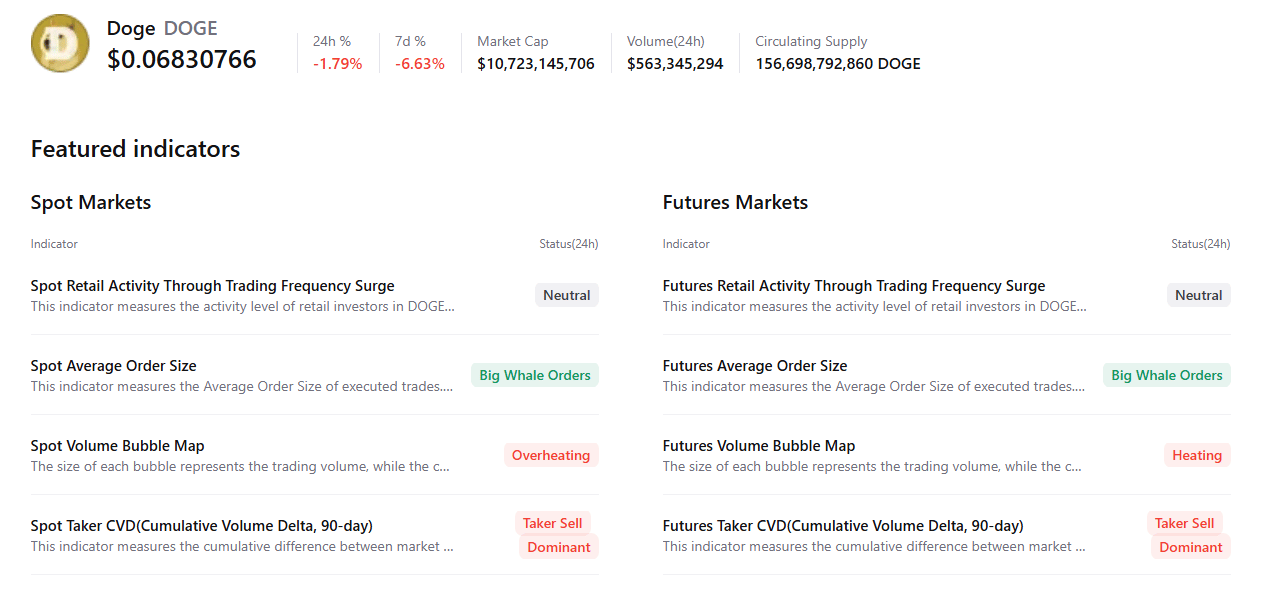
CryptoQuant’s summary data shows a cautious outlook for Dogecoin. DOGE’s spot and futures markets show large whale orders alongside heating conditions. Both markets also show sell-side dominance. These highlight a bearish, cautious sentiment bias among DOGE meme coin traders.
Dogecoin technical outlook: DOGE sets a new yearly low
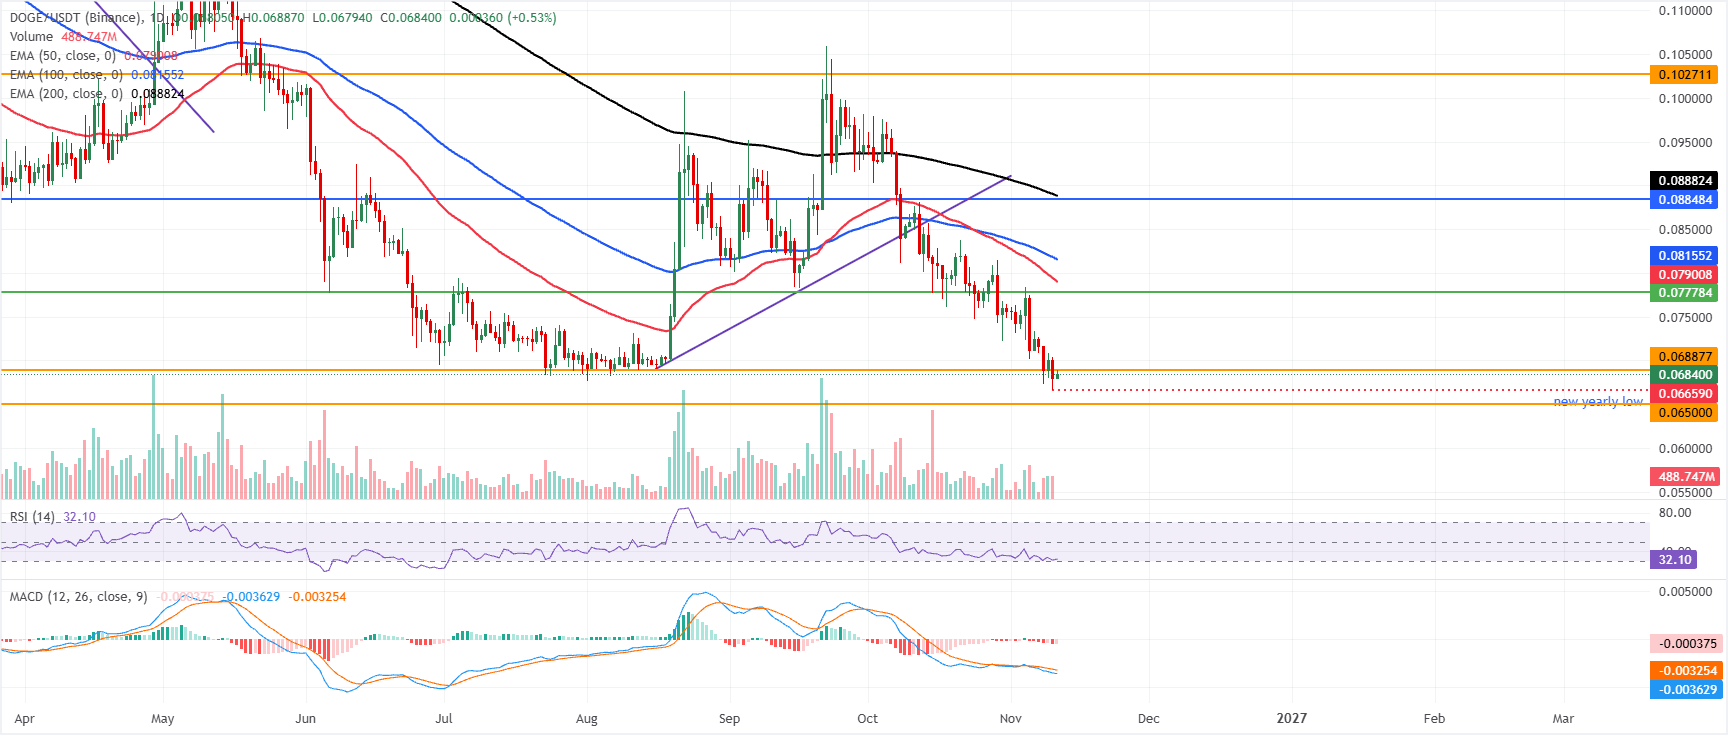
Dogecoin price trades at $0.068 on Wednesday after reaching a new yearly low of $0.066 the previous day. DOGE holds a bearish near-term bias as it sits beneath the 50-day, 100-day, and 200-day Exponential Moving Averages (EMAs), clustered between roughly $0.079 to $0.088.
The latest dip has dragged the Relative Strength Index (RSI) down toward the low-30s, hinting at weak but not yet extreme oversold conditions. At the same time, the Moving Average Convergence Divergence (MACD) holds slightly negative below the zero line, reinforcing persistent downside pressure rather than a decisive reversal.
On the topside, immediate resistance is located at $0.068, the first horizontal barrier just above spot, followed by $0.077 and the 50-day EMA at $0.079, with the 100-day EMA at $0.081 adding further supply overhead; above there, the 200-day EMA at $0.088 forms a heavier cap ahead of stronger resistance at $0.102.
On the downside, initial support is at the horizontal level of $0.065, and a clear break below this floor would likely open the door to a continuation of the broader downtrend, despite emerging signs of downside fatigue in momentum gauges.
(The technical analysis of this story was written with the help of an AI tool. Know more.)
Nothing in this material constitutes investment advice, personal recommendation, investment research, an offer, or a solicitation to buy or sell any financial instrument. The content has been prepared without consideration of your individual investment objectives, financial situation, or needs, and should not be treated as such.
Past performance is not a reliable indicator of future performance and/or results. Forward-looking scenarios or forecasts are not a guarantee of future performance. Actual results may differ materially from those anticipated.
Mitrade makes no representation or warranty as to the accuracy or completeness of the information provided and accepts no liability for any loss arising from reliance on such information.
Recommended Articles


