



Dow Jones Industrial Average slides all session as the Treasury bid falls short
- DJIA slid off its opening high all session, hitting roughly 440 points lower under 52,400.
- Treasury tripled its long-end buyback to $6 billion and yields rose anyway.
- Bank of America clients bought the sixth-largest weekly total since 2008 last week.
The Dow Jones Industrial Average trades roughly 440 points lower and under 52,400, and its session high sits within two points of the opening print. The Treasury said this morning it will buy back up to $6 billion of longer-dated government debt on Thursday, triple the size of a standard operation. The announcement was built to put a floor under the long end. The long end sold off on it.
The same policy, three times the size, the other direction
Thursday's operation covers 10-year and 20-year notes and runs to $6 billion against a $2 billion standard, with later operations held at $4 billion or more. It follows the August 19 decision to at least double the size, which took effect today. Dealers had been offering more paper than the old cap could absorb, and the Treasury has been describing liquidity in the long end as badly impaired.
That August announcement did what it was built to do. The 10-year yield fell 6 basis points to 4.647% on the day and the 30-year fell 9 to 5.196%. The larger version produced the opposite tape, with the 10-year up to 4.841% today, its highest since November 2023, the 20-year at 5.314% and the 30-year through the 5.30% line.
The upgrade was announced on August 19 and priced across the three weeks since, and parts of the market had looked for as much as $8 billion. Tripling the operation counted as a shortfall.
A $6 billion bid does not fill a $2.1 trillion hole
The federal deficit is projected near $2.1 trillion for the fiscal year ending September 30, more than 6% of Gross Domestic Product (GDP), and the national debt passed $40 trillion last month. Brent Crude Oil trades above $101.00 for the first time since July after American forces destroyed five Iranian tankers on Tuesday. A buyback is funded by issuing other paper, so it changes the maturity of the debt rather than the amount, and the amount is what the long end is pricing.
The marginal seller is foreign. China held $633.4 billion of American government debt in June against $731.4 billion a year earlier, and Norway's sovereign fund has proposed cutting government bonds from 70% of its fixed income allocation to 50%, roughly $75 billion of Treasuries. Foreign investors put a record $600 billion into American equities in the year to March, outweighing their government and agency bond buying by the widest margin on record. Thursday's operation covers $6 billion of that, once.
The sixth-largest buying week since 2008 was last week
Bank of America (BAC) clients were net buyers of American equities for a second straight week, the sixth-largest weekly total in the firm's records going back to 2008. Institutions and hedge funds led it, and private clients sold for a sixth consecutive week. Buying ran across eight of the eleven sectors, led by technology, and growth exchange-traded funds (ETFs) took their first inflows in five weeks.
Positioning is evidence about who owns the next move, not a verdict on anyone. Length opened near a high has the least room and the shortest patience, which is what turns a drift into a slide. That flow covers the week to September 4. The lowest trade since the end of July came two sessions later.
Two inflation prints, then a vote
The four-week average of private payrolls printed 12K this morning after 10K. The Producer Price Index (PPI) lands Thursday, September 10 at 12:30 GMT, with consensus at 0.4% on the month and 5.3% YoY after 4.7%, and the core measure at 0.3% and 4.6% after 4.2%. Initial Jobless Claims print alongside it at 205K after 206K.
The Consumer Price Index (CPI) follows Friday, September 11 at 12:30 GMT, with the headline seen holding at 3.4% YoY and the core easing to 2.4% from 2.5%. The Michigan preliminary survey lands at 14:00 GMT with sentiment seen at 51 after 51.7. The August budget statement follows at 18:00 GMT, seen at a $202.5 billion deficit after $432 billion.
Futures price roughly 60% odds of a quarter-point increase on September 16, from a target range of 3.50% to 3.75% that the committee held in July over three dissents in favour of a hike. Friday's consumer print is the last inflation reading the Federal Open Market Committee (FOMC) sees before it votes. The deficit number that has been driving the long end arrives five and a half hours after it.
Levels and bias
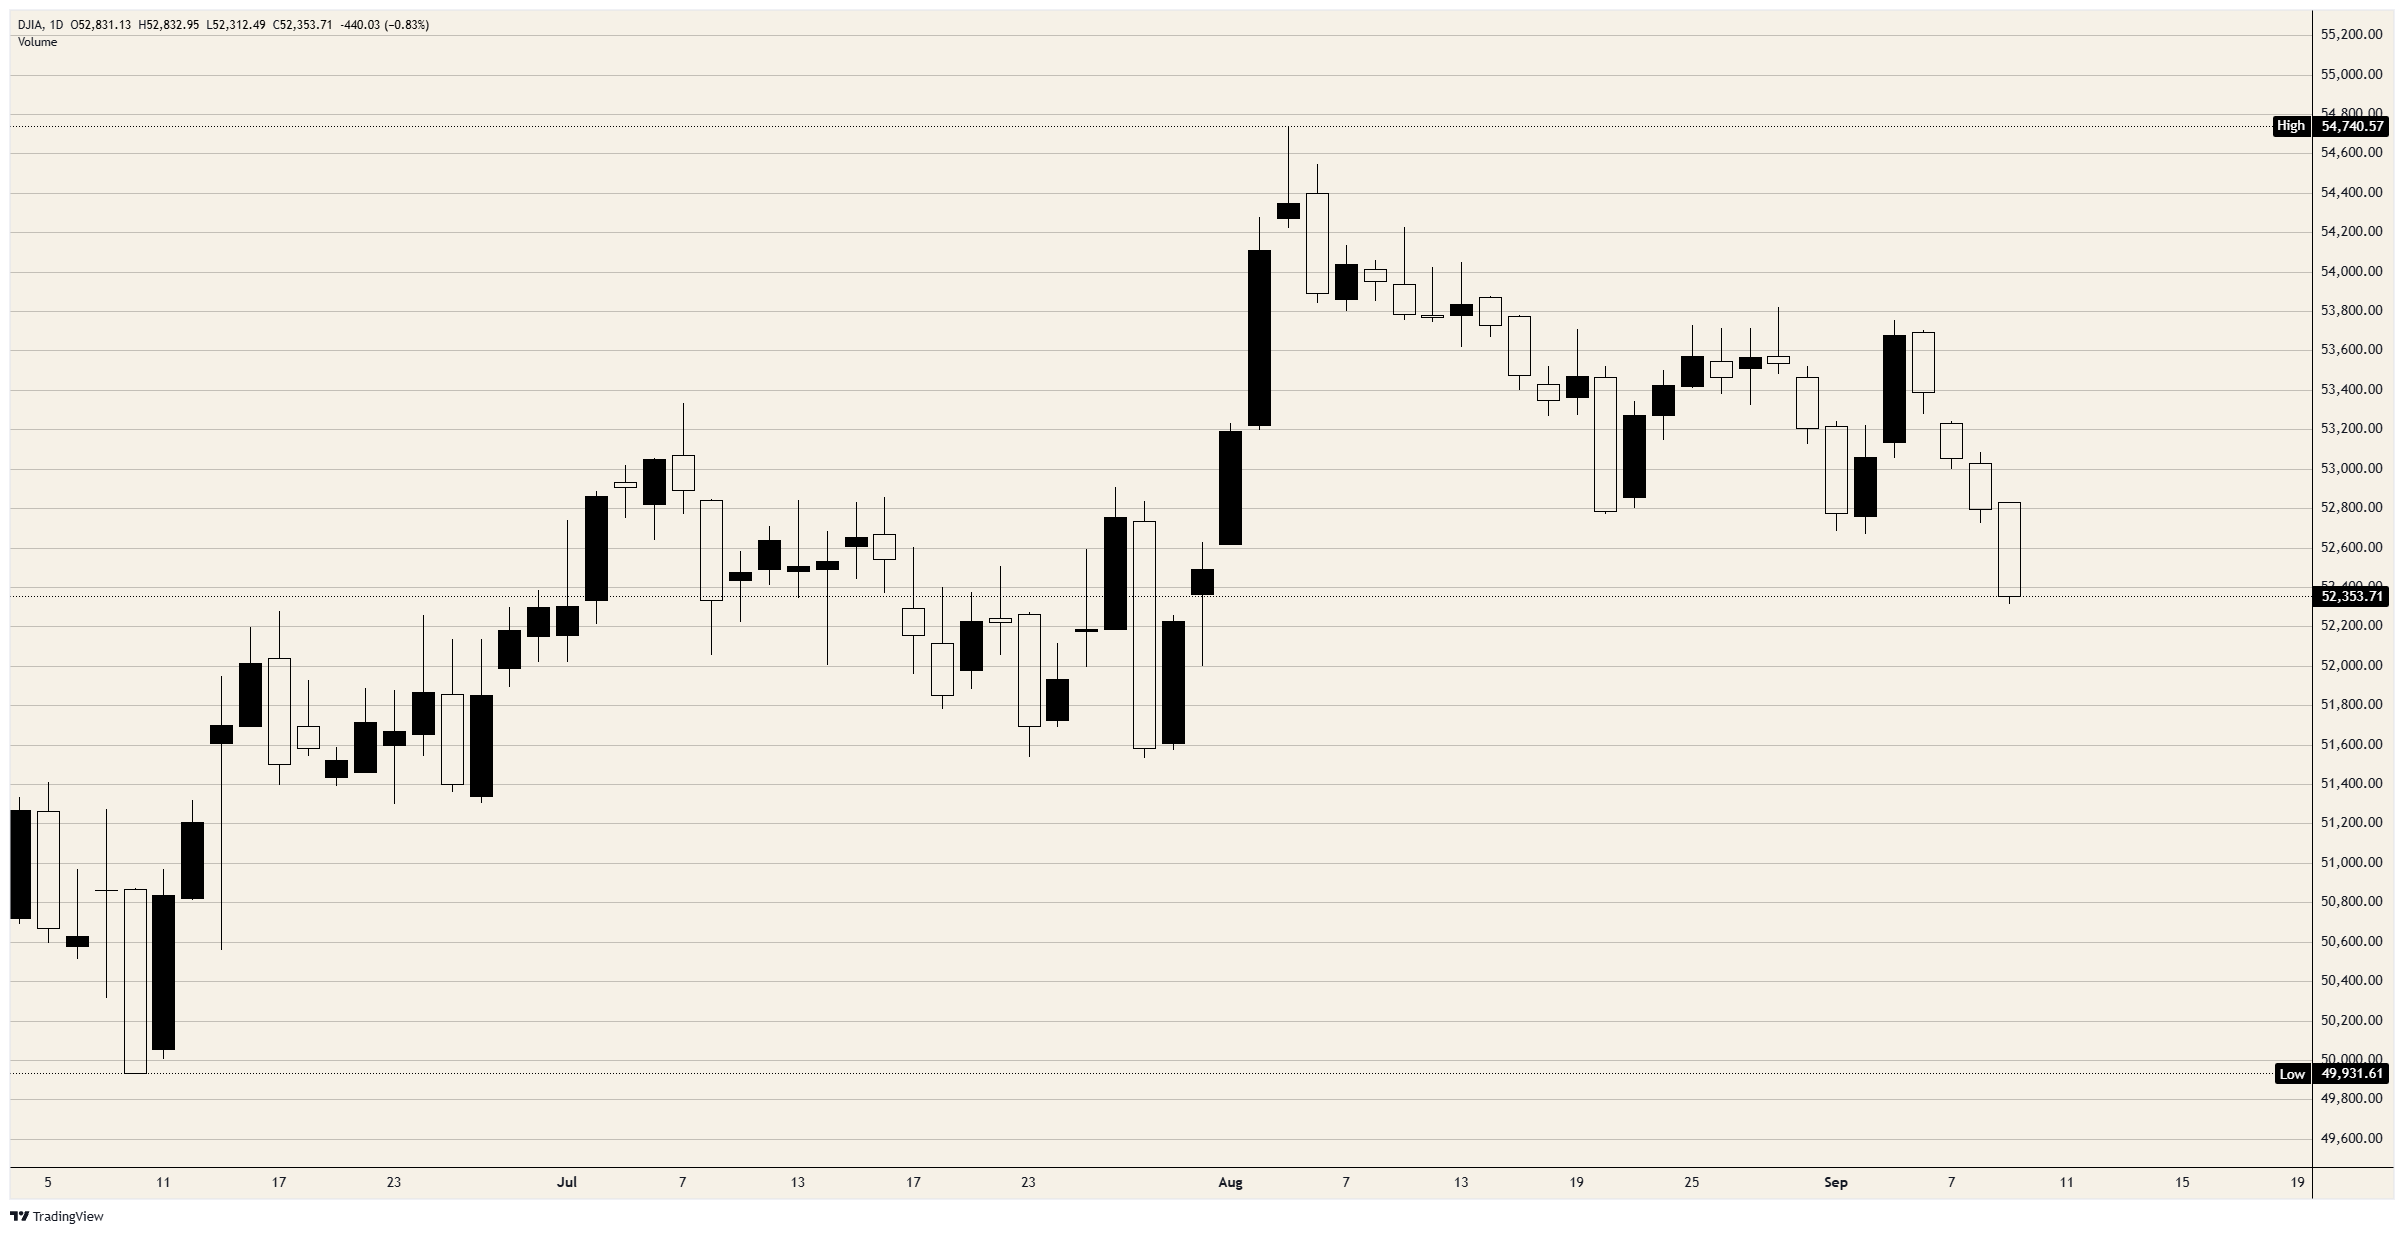
Resistance: The 52,500 area is the first hurdle and the index gave it up on the way down this morning. Above it sits the 52,800 area, which holds both today's opening high and yesterday's close, then 53,000 and the 53,250 shelf. The 53,500 band that broke on September 4 comes next, with the early-August peak just short of 54,750, roughly 4.4% overhead.
Support: The session low in the 52,300 area is the lowest trade since the end of July and the first floor. Beneath it the 52,000 handle is the next round figure, with the late-July base near 51,600 behind it. The June low just above 49,900 is not in play.
Bias: Bearish while the index holds beneath 52,800, with the 52,000 handle the objective. The index has given back roughly three-quarters of the rally that ran from the end of July to the early-August peak, and that rally took four sessions where the give-back has taken five weeks, so the selling is orderly rather than forced and has produced no capitulation bar to mark a low. Today's 520-point range with the high inside the first minutes is expansion, not exhaustion. A daily close back above 52,800 voids the case and restores 53,000.
Dow Jones daily chart
Dow Jones FAQs
The Dow Jones Industrial Average, one of the oldest stock market indices in the world, is compiled of the 30 most traded stocks in the US. The index is price-weighted rather than weighted by capitalization. It is calculated by summing the prices of the constituent stocks and dividing them by a factor, currently 0.152. The index was founded by Charles Dow, who also founded the Wall Street Journal. In later years it has been criticized for not being broadly representative enough because it only tracks 30 conglomerates, unlike broader indices such as the S&P 500.
Many different factors drive the Dow Jones Industrial Average (DJIA). The aggregate performance of the component companies revealed in quarterly company earnings reports is the main one. US and global macroeconomic data also contributes as it impacts on investor sentiment. The level of interest rates, set by the Federal Reserve (Fed), also influences the DJIA as it affects the cost of credit, on which many corporations are heavily reliant. Therefore, inflation can be a major driver as well as other metrics which impact the Fed decisions.
Dow Theory is a method for identifying the primary trend of the stock market developed by Charles Dow. A key step is to compare the direction of the Dow Jones Industrial Average (DJIA) and the Dow Jones Transportation Average (DJTA) and only follow trends where both are moving in the same direction. Volume is a confirmatory criteria. The theory uses elements of peak and trough analysis. Dow’s theory posits three trend phases: accumulation, when smart money starts buying or selling; public participation, when the wider public joins in; and distribution, when the smart money exits.
There are a number of ways to trade the DJIA. One is to use ETFs which allow investors to trade the DJIA as a single security, rather than having to buy shares in all 30 constituent companies. A leading example is the SPDR Dow Jones Industrial Average ETF (DIA). DJIA futures contracts enable traders to speculate on the future value of the index and Options provide the right, but not the obligation, to buy or sell the index at a predetermined price in the future. Mutual funds enable investors to buy a share of a diversified portfolio of DJIA stocks thus providing exposure to the overall index.
Nothing in this material constitutes investment advice, personal recommendation, investment research, an offer, or a solicitation to buy or sell any financial instrument. The content has been prepared without consideration of your individual investment objectives, financial situation, or needs, and should not be treated as such.
Past performance is not a reliable indicator of future performance and/or results. Forward-looking scenarios or forecasts are not a guarantee of future performance. Actual results may differ materially from those anticipated.
Mitrade makes no representation or warranty as to the accuracy or completeness of the information provided and accepts no liability for any loss arising from reliance on such information.
Recommended Articles


