



Bitcoin vs Gold: BTC springs above $80K as XAU tops $4,000 amid low compressed volatility
- Bitcoin reclaims $80,000 as bulls build momentum, eyeing highs above the 50-day EMA.
- Gold ticks up above the pivotal $4,000 level, rising in tandem with the RSI momentum indicator.
- Volatility remains broadly compressed ahead of the Fed decision and major tech companies' earnings.
Bitcoin (BTC) is bouncing back above $80,000 on Monday, while Gold (XAU/USD) is springing above the pivotal $4,000 level, up a modest 0.34% and 0.64%, respectively. Both assets are advancing amid low volatility as market participants position ahead of the Federal Reserve’s (Fed) decision on Wednesday and earnings from several major tech companies.
Fed rate pause bets hold higher
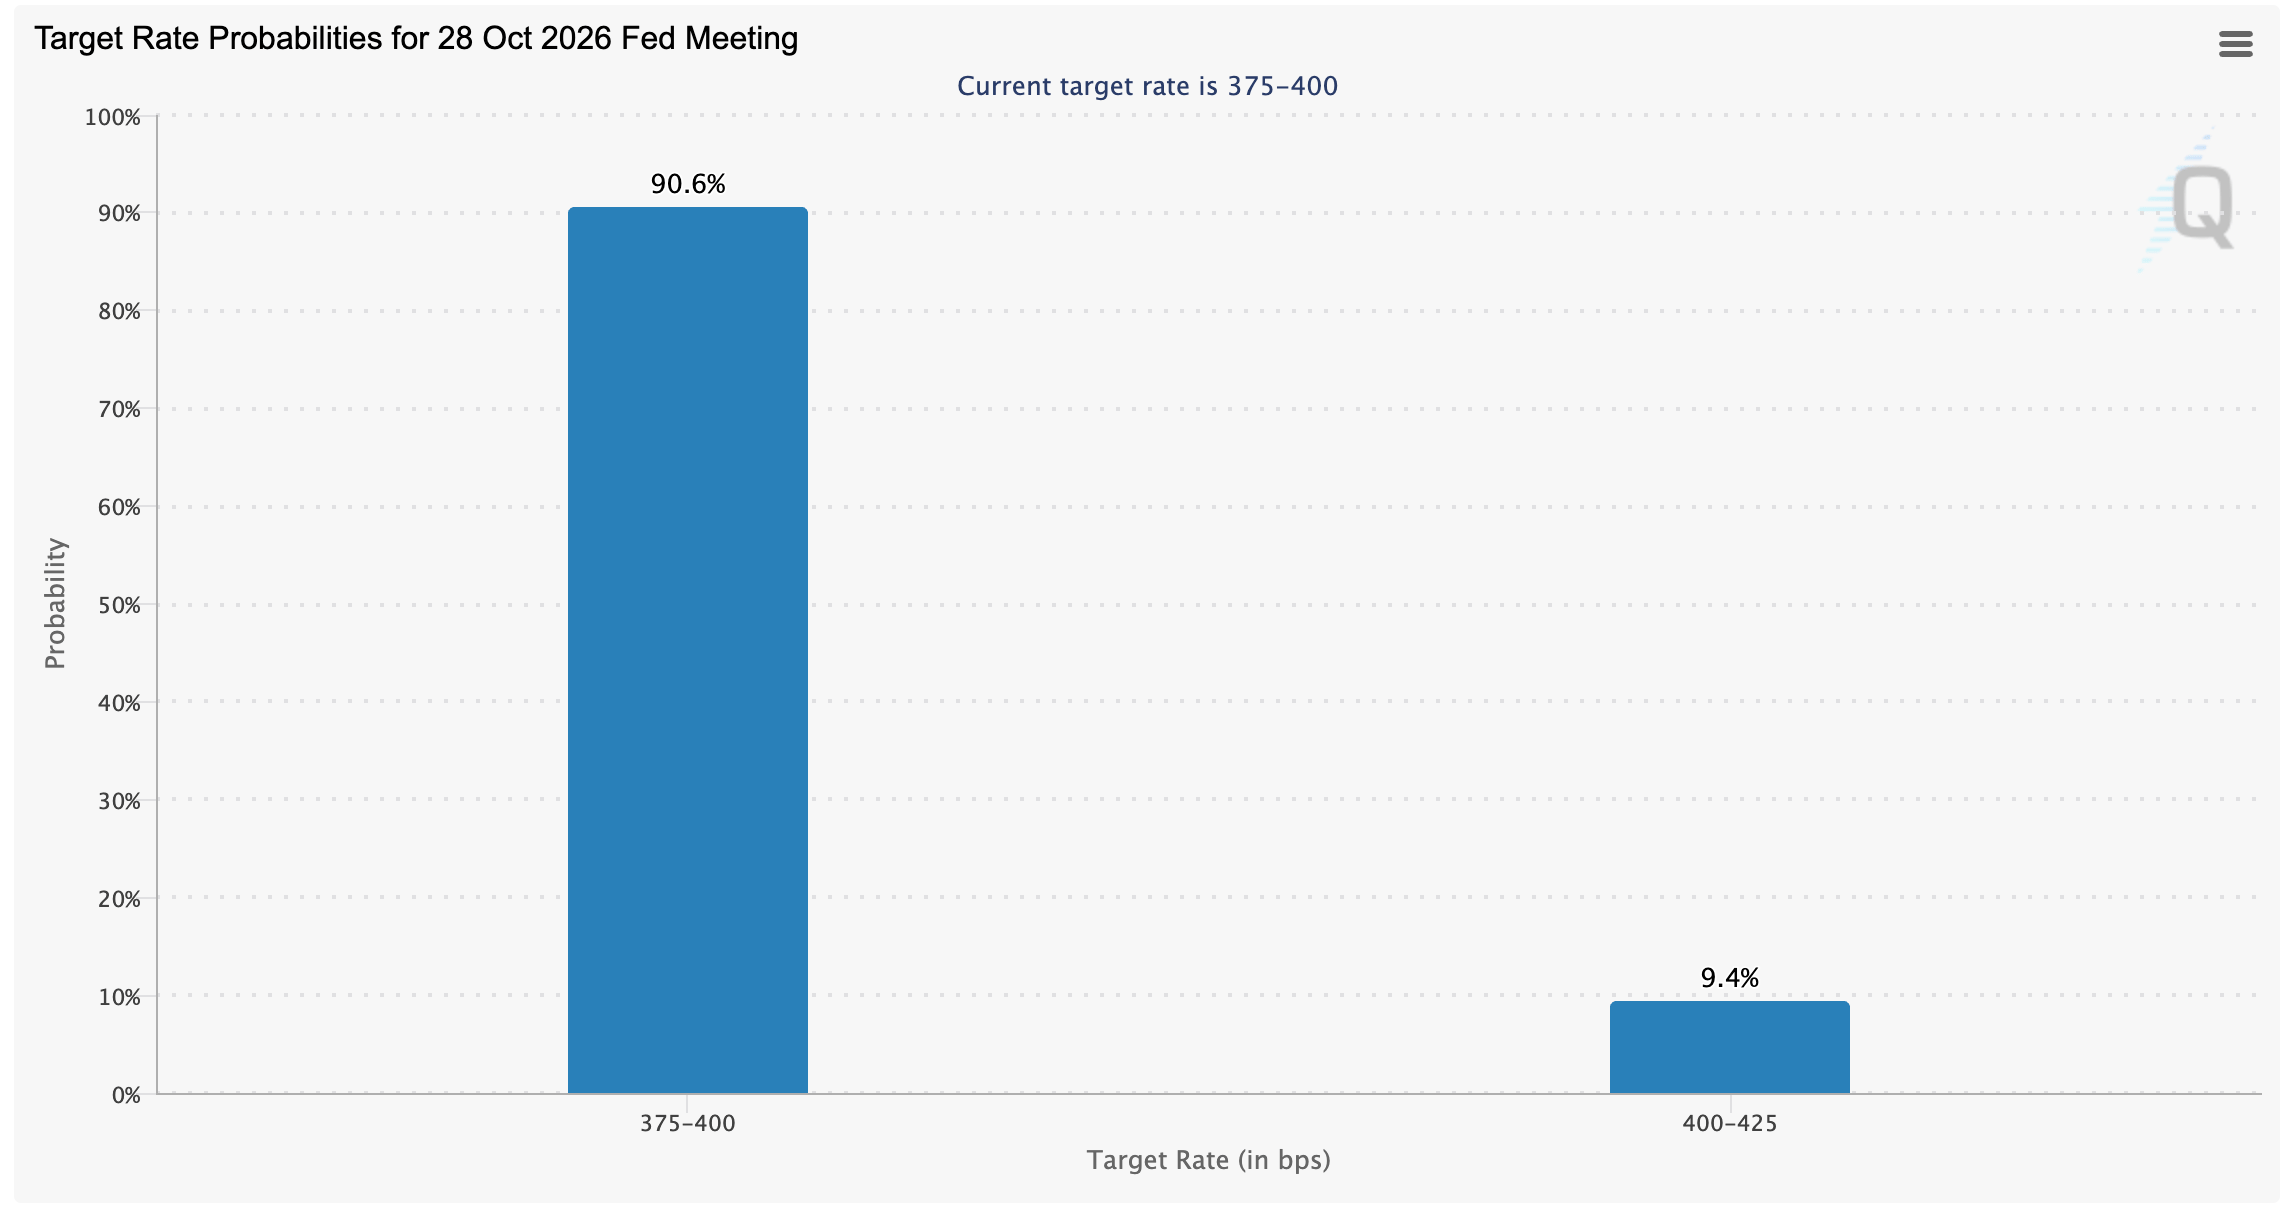
Traders are widely anticipating a steady monetary policy outcome on Wednesday. CME Group’s FedWatch Tool currently prices a roughly 91% chance of the Fed holding interest rates in the 3.75%-4.00% range. Only 9% of traders expect a rate hike. Steady conviction in a pause anchors the macro backdrop amid a cautious but stable tone across risk assets.
Market activity remains subdued as low volatility persists, reflected in broader crypto sentiment, which has cooled into Neutral territory at 50 on the Fear & Greed Index, well below last week's Greed readings of 59 and 74 last month.
“What keeps me constructive is what is happening beneath the drift. Participation is extremely low. Volumes are thin, leverage is subdued, and holders are simply refusing to sell at these levels,” Yusuf Fakhro, Partner at ARP Digital, said in an emailed commentary, adding, “That combination, quiet price action with no one forced to sell, is exactly the pattern that has marked past bottoming phases rather than tops.”
Gold is also navigating a tight range, holding its recovery above $4,000 without aggressive follow-through. Low volatility across Bitcoin and Gold reflects a waiting game ahead of the Fed announcement.
Nonetheless, volatility could spike after the Fed meeting, influenced by major Big Tech earnings calls scheduled for this week, including Microsoft (MSFT), Alphabet (GOOG), and Amazon (AMZN).
“The honest read is that this is a waiting game, and the wait is nearly over. The calendar from late October is dense: the Fed decision, major tech earnings including the largest corporate Bitcoin holder, and the US midterms all land within a week,” added Fakhro.
Technical analysis: Bitcoin
Bitcoin trades at $80,454, trapped between nearby dynamic levels that keep the short-term tone neutral to slightly bearish. Price now sits just under the 50-day Exponential Moving Average (EMA) at $80,812, which acts as immediate resistance, while it still holds above a dense support area defined by the SuperTrend line near $79,664 and the 100- and 200-day EMAs at $77,690 and $76,313, respectively.
The Relative Strength Index (RSI) at 43 leans weak but not oversold, and the Moving Average Convergence Divergence (MACD) indicator remains below zero with a contracting negative profile, suggesting fading downside momentum rather than a clear bullish turn.
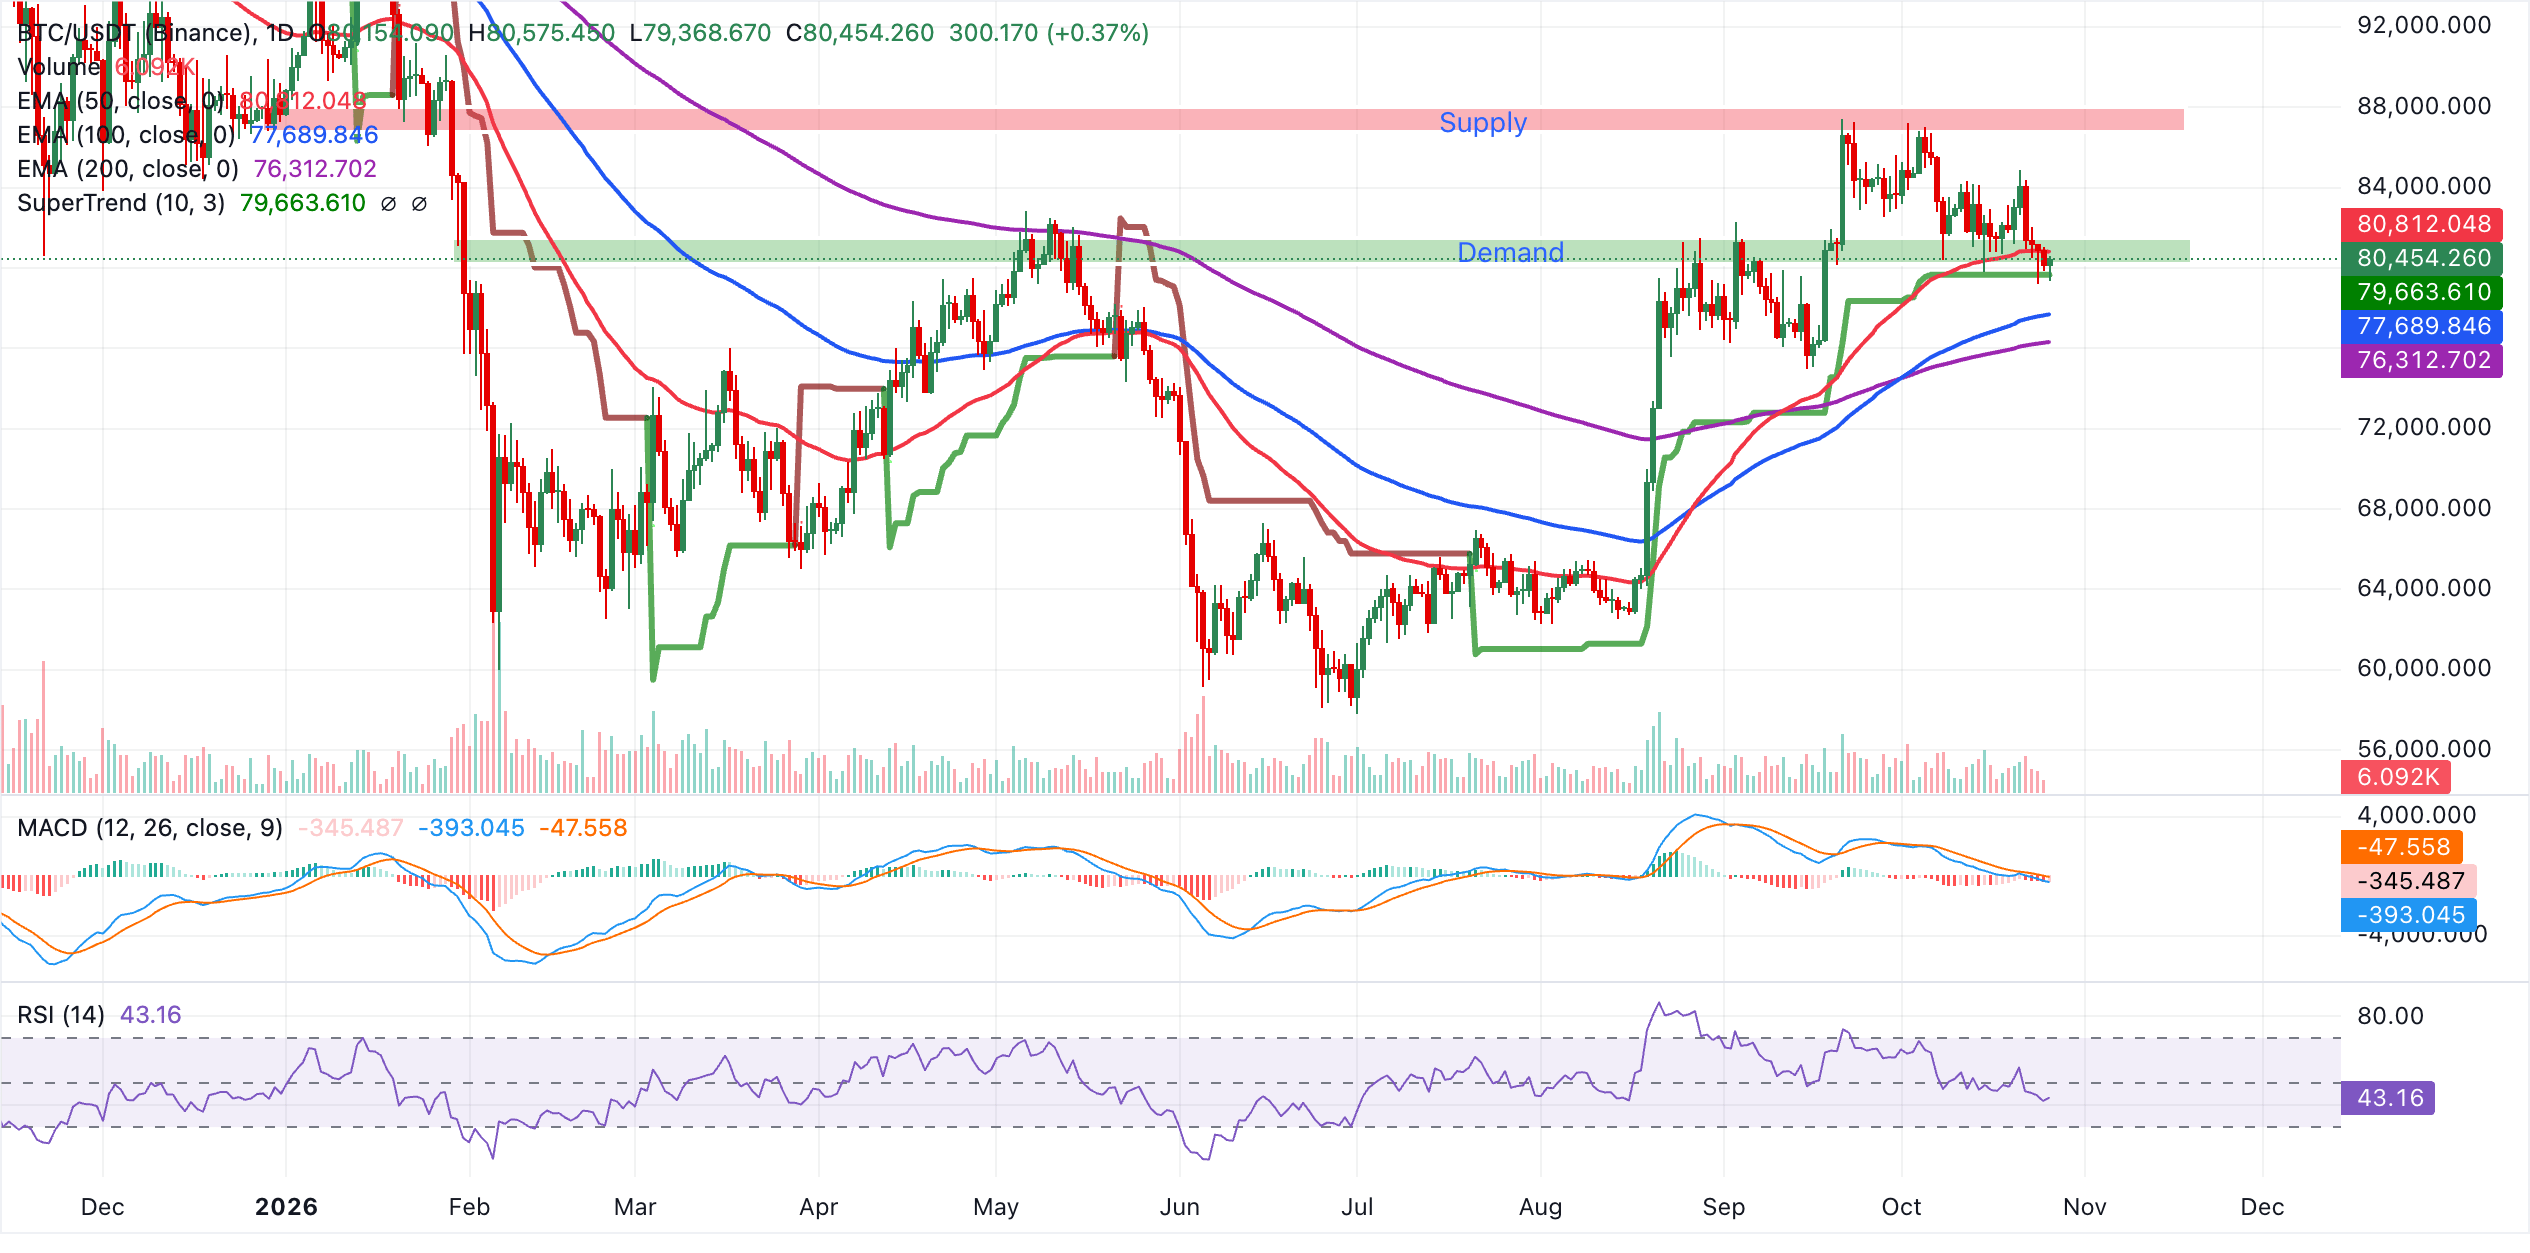
A sustained break above the 50-day EMA at $80,812 would be needed to reopen the path toward fresh highs and ease the current capped structure. On the downside, watch the immediate demand band around the current price and the SuperTrend signal at $79,664.
A daily close below this region would expose the 100-day EMA at $77,690 as the next support, followed by the more strategic 200-day EMA at $76,313. As long as BTC trades between the $79,664-$80,813 corridor, price action is likely to remain choppy and directionless, awaiting a clear break of either side.
Gold technical analysis: XAU builds recovery momentum
Gold trades at $4,021, keeping a bearish near-term bias as spot holds beneath a dense cap of moving averages and trend resistance. The 50-, 100-, and 200-day EMAs at $4,215, $4,278, and $4,284 sit overhead, suggesting the metal remains in a corrective phase below its medium- and long-term trend yardsticks, while the SuperTrend at $4,211 reinforces that topside pressure.
The MACD indicator stays in negative territory, with the latest reading having rolled lower again, hinting that bearish momentum persists despite earlier attempts to stabilize, as the RSI at 36 lingers below the 50 line and points to subdued buying interest rather than outright oversold conditions.
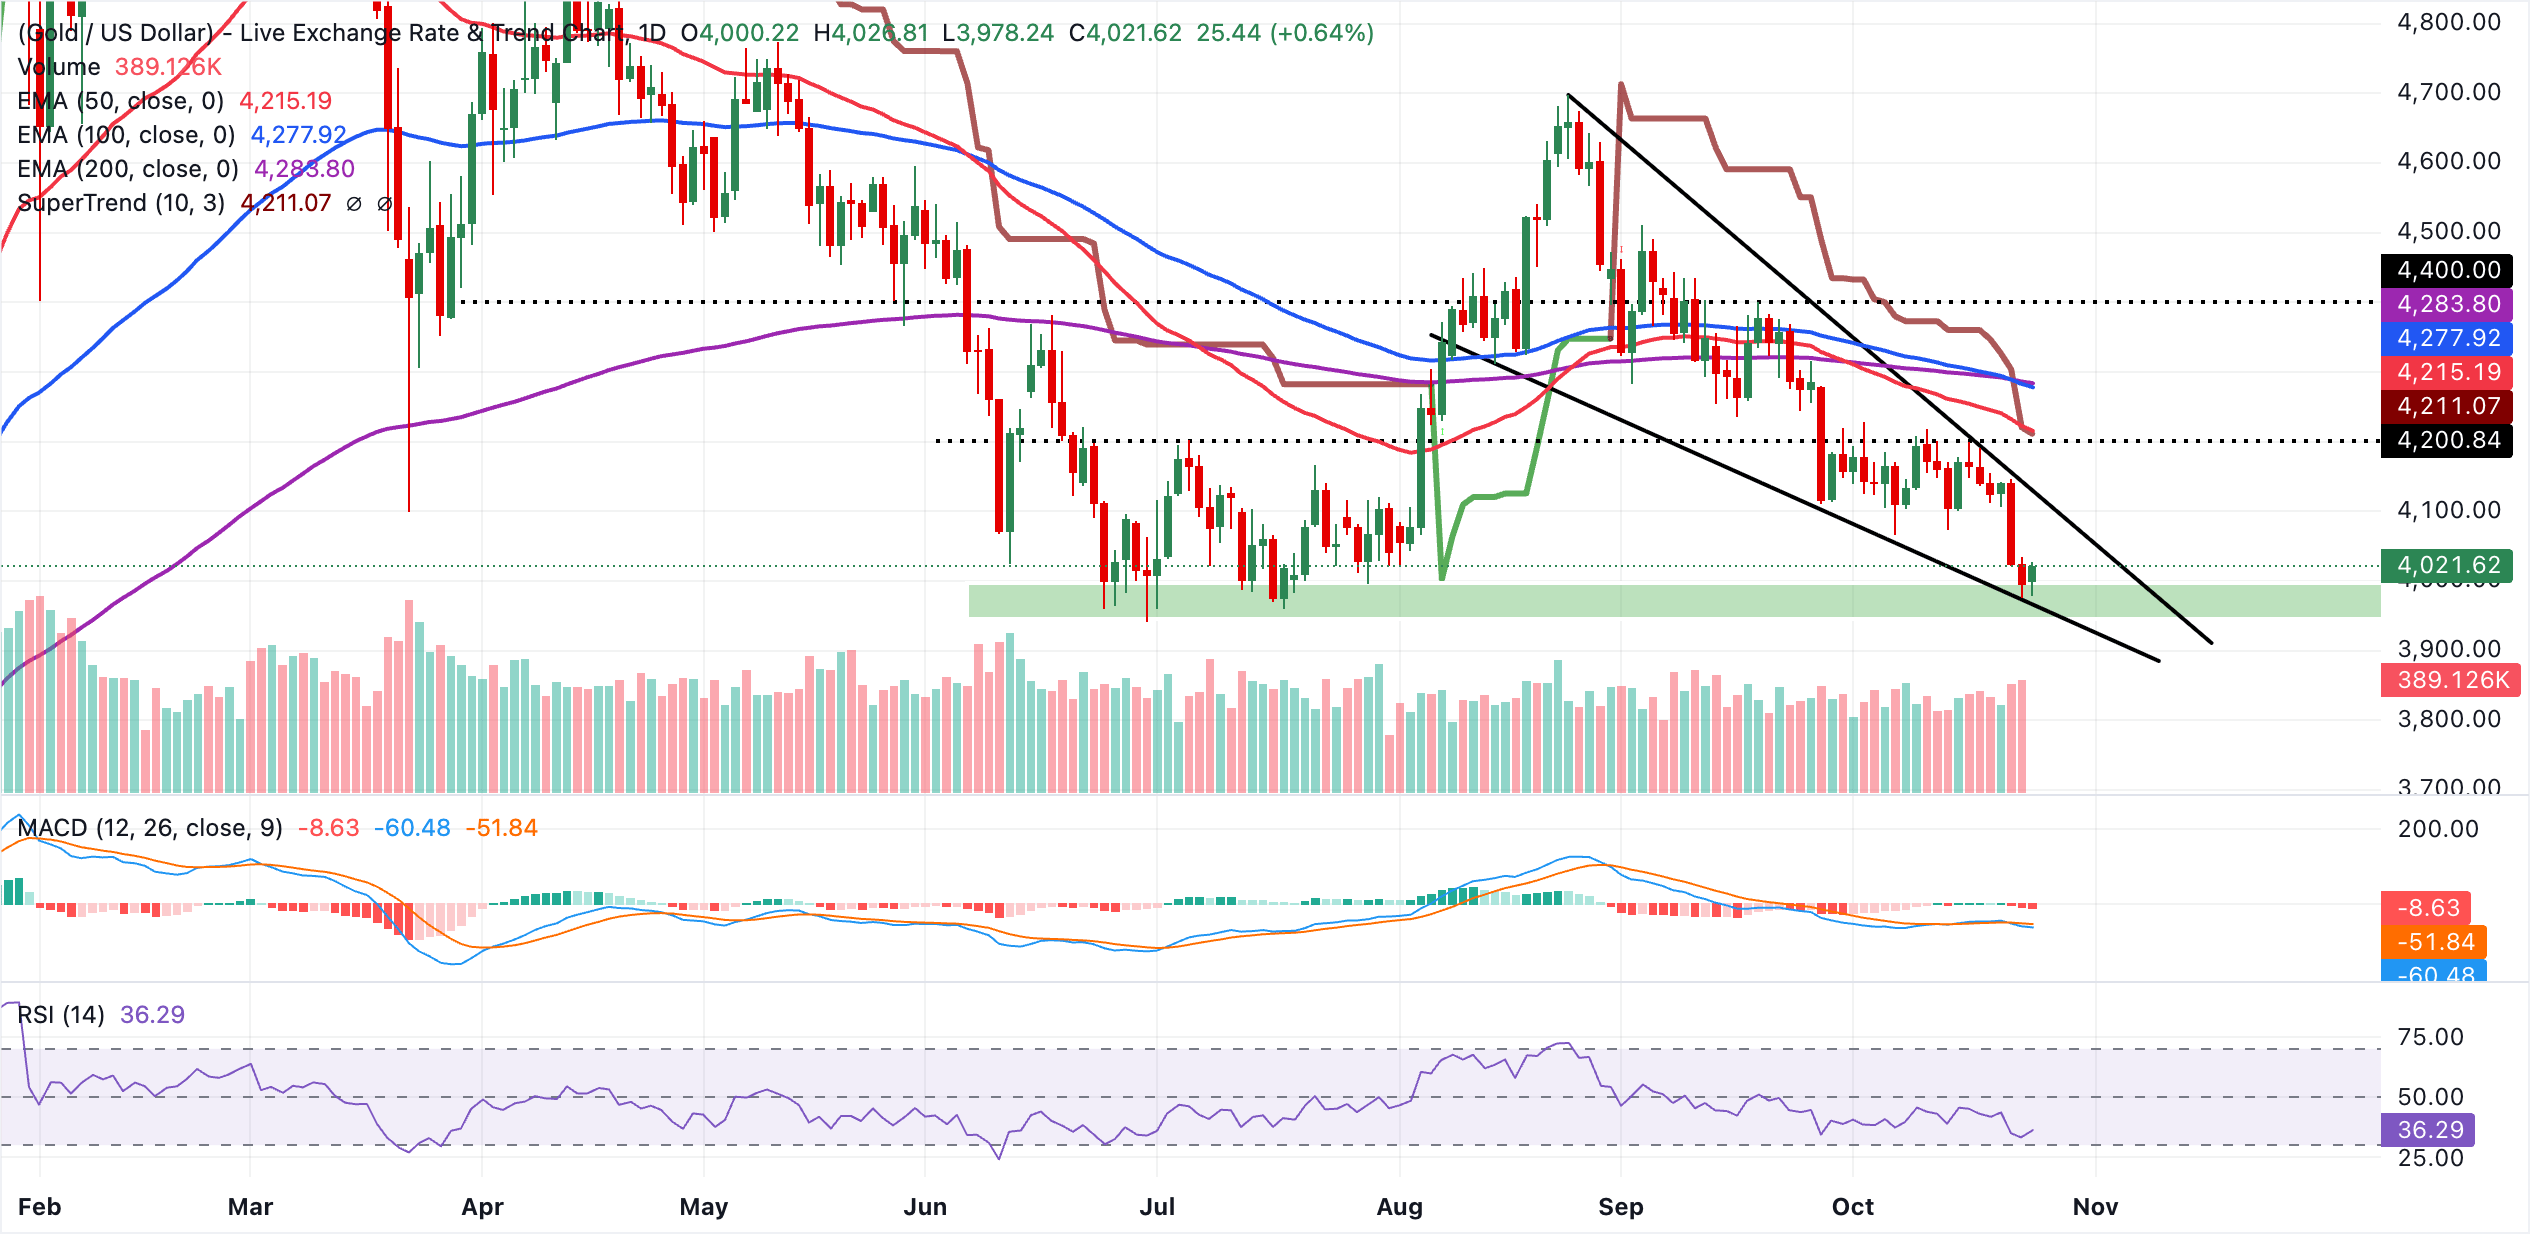
Initial resistance emerges at the downward-sloping trendline break price near $4,074, where the latest bounce attempt was rejected. Above that, the SuperTrend barrier at $4,211 and the 50-day EMA at $4,215 form a nearby cluster that would need to be reclaimed to ease immediate selling pressure, ahead of the 100-day EMA at $4,278 and the 200-day EMA at $4,284, which define a broader resistance band limiting any recovery.
With no clear technical support levels on the daily chart, the bearish structure suggests that any upticks toward these overhead markers could attract renewed sellers until price closes decisively above at least the trendline and the short-term EMA.
(The technical analysis of this story was written with the help of an AI tool. Know more.)
Bitcoin, altcoins, stablecoins FAQs
Bitcoin is the largest cryptocurrency by market capitalization, a virtual currency designed to serve as money. This form of payment cannot be controlled by any one person, group, or entity, which eliminates the need for third-party participation during financial transactions.
Altcoins are any cryptocurrency apart from Bitcoin, but some also regard Ethereum as a non-altcoin because it is from these two cryptocurrencies that forking happens. If this is true, then Litecoin is the first altcoin, forked from the Bitcoin protocol and, therefore, an “improved” version of it.
Stablecoins are cryptocurrencies designed to have a stable price, with their value backed by a reserve of the asset it represents. To achieve this, the value of any one stablecoin is pegged to a commodity or financial instrument, such as the US Dollar (USD), with its supply regulated by an algorithm or demand. The main goal of stablecoins is to provide an on/off-ramp for investors willing to trade and invest in cryptocurrencies. Stablecoins also allow investors to store value since cryptocurrencies, in general, are subject to volatility.
Bitcoin dominance is the ratio of Bitcoin's market capitalization to the total market capitalization of all cryptocurrencies combined. It provides a clear picture of Bitcoin’s interest among investors. A high BTC dominance typically happens before and during a bull run, in which investors resort to investing in relatively stable and high market capitalization cryptocurrency like Bitcoin. A drop in BTC dominance usually means that investors are moving their capital and/or profits to altcoins in a quest for higher returns, which usually triggers an explosion of altcoin rallies.
Nothing in this material constitutes investment advice, personal recommendation, investment research, an offer, or a solicitation to buy or sell any financial instrument. The content has been prepared without consideration of your individual investment objectives, financial situation, or needs, and should not be treated as such.
Past performance is not a reliable indicator of future performance and/or results. Forward-looking scenarios or forecasts are not a guarantee of future performance. Actual results may differ materially from those anticipated.
Mitrade makes no representation or warranty as to the accuracy or completeness of the information provided and accepts no liability for any loss arising from reliance on such information.
Recommended Articles


