



Bitcoin Weekly Forecast: Bears tighten grip as BTC eyes fifth weekly loss
- Bitcoin is down over 3% this week, trading near $75,500 on Friday and heading for its fifth straight weekly loss.
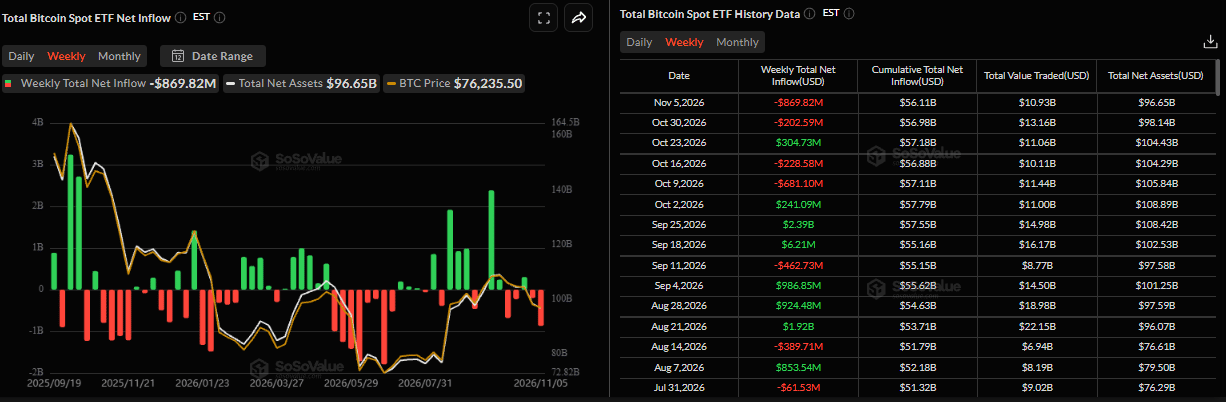
- US-listed BTC spot ETFs are on track for a second consecutive weekly outflow, with $869.82 million in net withdrawals through Thursday.
- A sharp sell-off in US technology stocks reversed Bitcoin’s post-election rally on Thursday, triggering a wave of liquidations across the market and intensifying bearish pressure.
Bitcoin (BTC) remains under pressure, down over 3% this week, trading near $75,500 on Friday and heading for its fifth straight weekly loss. Persistent outflows from US-listed BTC spot Exchange Traded Funds (ETFs), a sharp sell-off in US technology stocks, and rising market liquidations are weighing on sentiment and limiting Crypto King’s recovery attempts.
Institutional demand shows signs of cooling
Institutional demand for Bitcoin has weakened so far this week. SoSoValue data show BTC spot ETFs are on track for a second straight weekly outflow, with $869.82 million in net withdrawals through Thursday, up from $202.59 million last week.
If Friday’s outflows continue and intensify, they could put additional pressure on BTC, pushing its price into a deeper correction.
Waves of liquidations
Bitcoin price saw sharp volatility this week, amid the US midterm elections. The largest cryptocurrency by market capitalization surged nearly 4%, closing above $80,500 on Wednesday after news that Democrats won control of both the House and the Senate.
This victory removed a major source of uncertainty and lowered expectations that US President Donald Trump would resume military strikes against Iran, which supported risky assets such as BTC.
However, the move was short-lived as the Democratic sweep in the US midterm elections sparked concerns about a slowdown in Artificial Intelligence (AI) development, with the NASDAQ Index falling over 6% on Thursday. Moreover, this political shift also means tighter crypto regulations, which weigh on BTC, erasing most of Wednesday’s gains and dropping over 5% to a low of $75,208 that day.
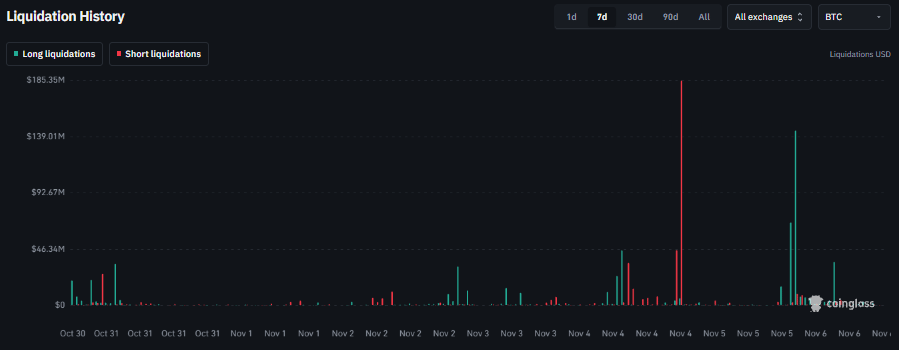
This week’s price action triggered a wave of liquidation in the crypto market. Coinglass chart below shows that over $500 million in BTC positions were liquidated. Wednesday’s rebound liquidated mostly short positions, while Thursday’s decline wiped out longs, highlighting uncertainty and leveraged positioning across the Crypto King.
Traders now await the key economic data releases
Market participants now look to the release of the closely watched US monthly employment data before positioning for the next leg of a directional move.
The US Nonfarm Payrolls (NFP) report is expected to show the economy added 65K new jobs in October, up from the previous month’s softer reading of 29K. Meanwhile, the Unemployment Rate is forecast to hold steady at 4.2%.
Investors will also watch Average Hourly Earnings, as wage-growth pressures could strongly influence Federal Reserve (Fed) policy expectations. Nevertheless, these closely watched macroeconomic indicators are set to add volatility to financial markets and drive the US Dollar (USD), providing meaningful impetus to risky assets such as Bitcoin.
Bitcoin technical outlook: Bears in charge
The Crypto King is extending losses, down over 3% so far this week, trading below $75,800 at the time of writing on Friday and heading into the fifth straight negative week.
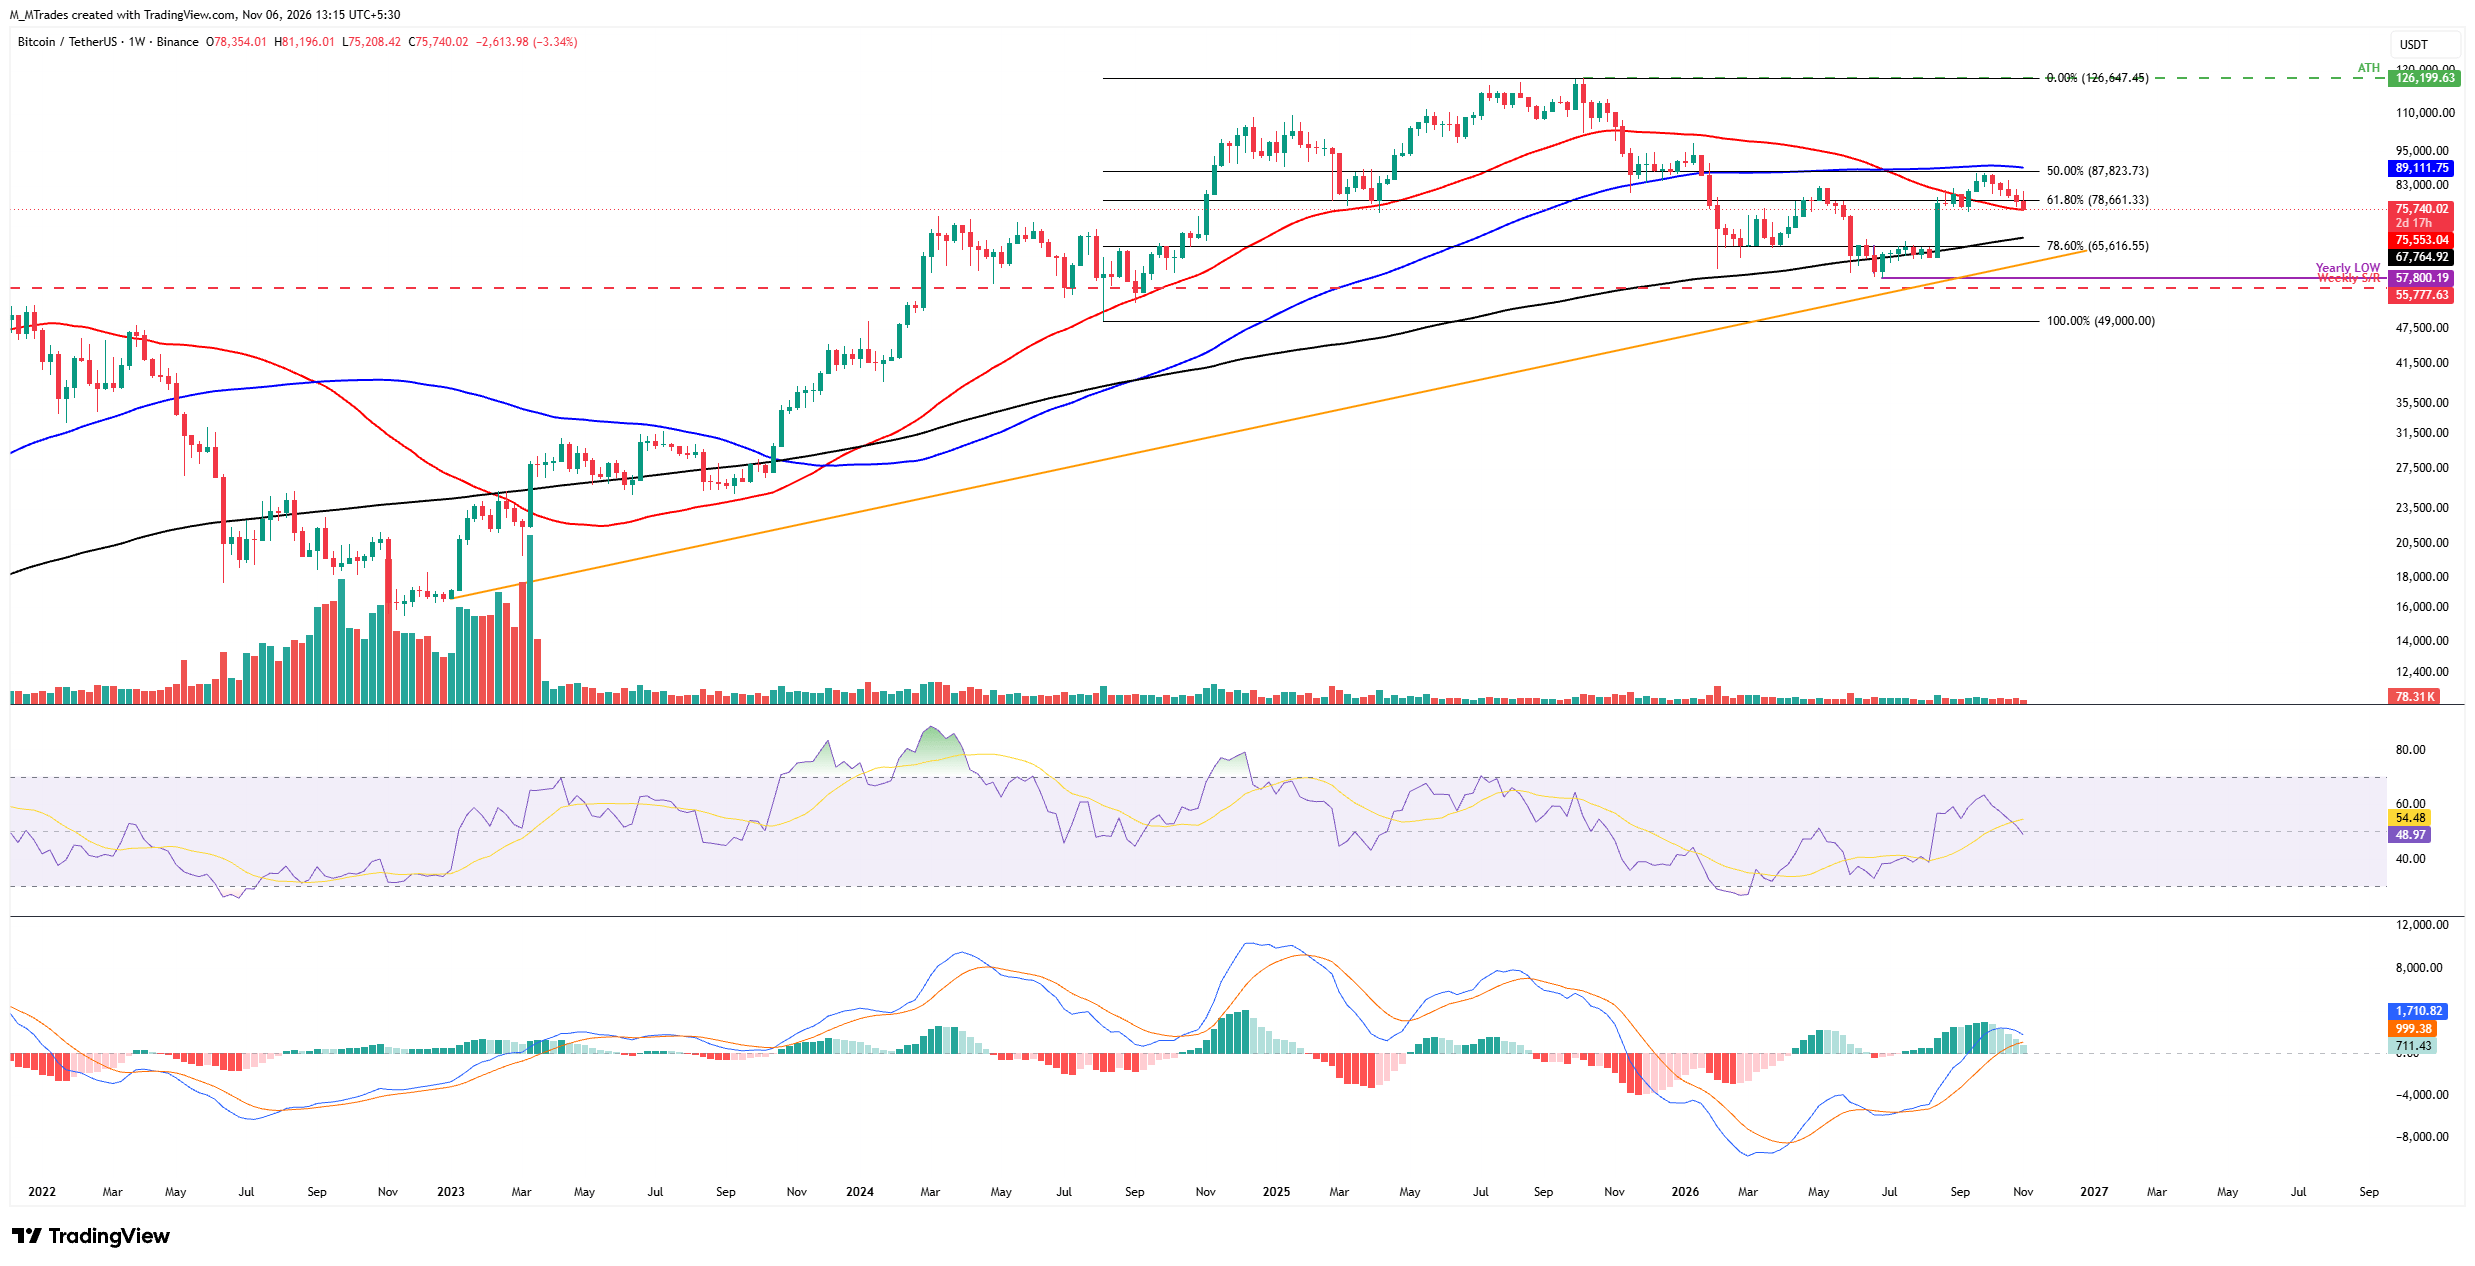
If BTC continues its correction, it could test the 50-week Simple Moving Average (SMA) at $75,553. A weekly close below this level could trigger further losses toward the 200-week SMA at $67,764.
The Relative Strength Index (RSI) on the weekly chart stands at 48, below the neutral 50 level, suggesting fading bullish momentum. Meanwhile, the Moving Average Convergence Divergence (MACD) histogram remains positive, although its bars are weakening. This suggests broader upside momentum remains intact but is losing strength amid nearby resistance and the ongoing pullback.
On the other hand, if BTC recovers, it could extend the advance toward the 61.8% Fibonacci retracement level of $78,661 (drawn from the August 2024 low of $49,000 to the October 2025 record high of $126,199). If this level holds, BTC could head toward the 50% retracement level of $87,823, then the 100-week SMA at $89,111.
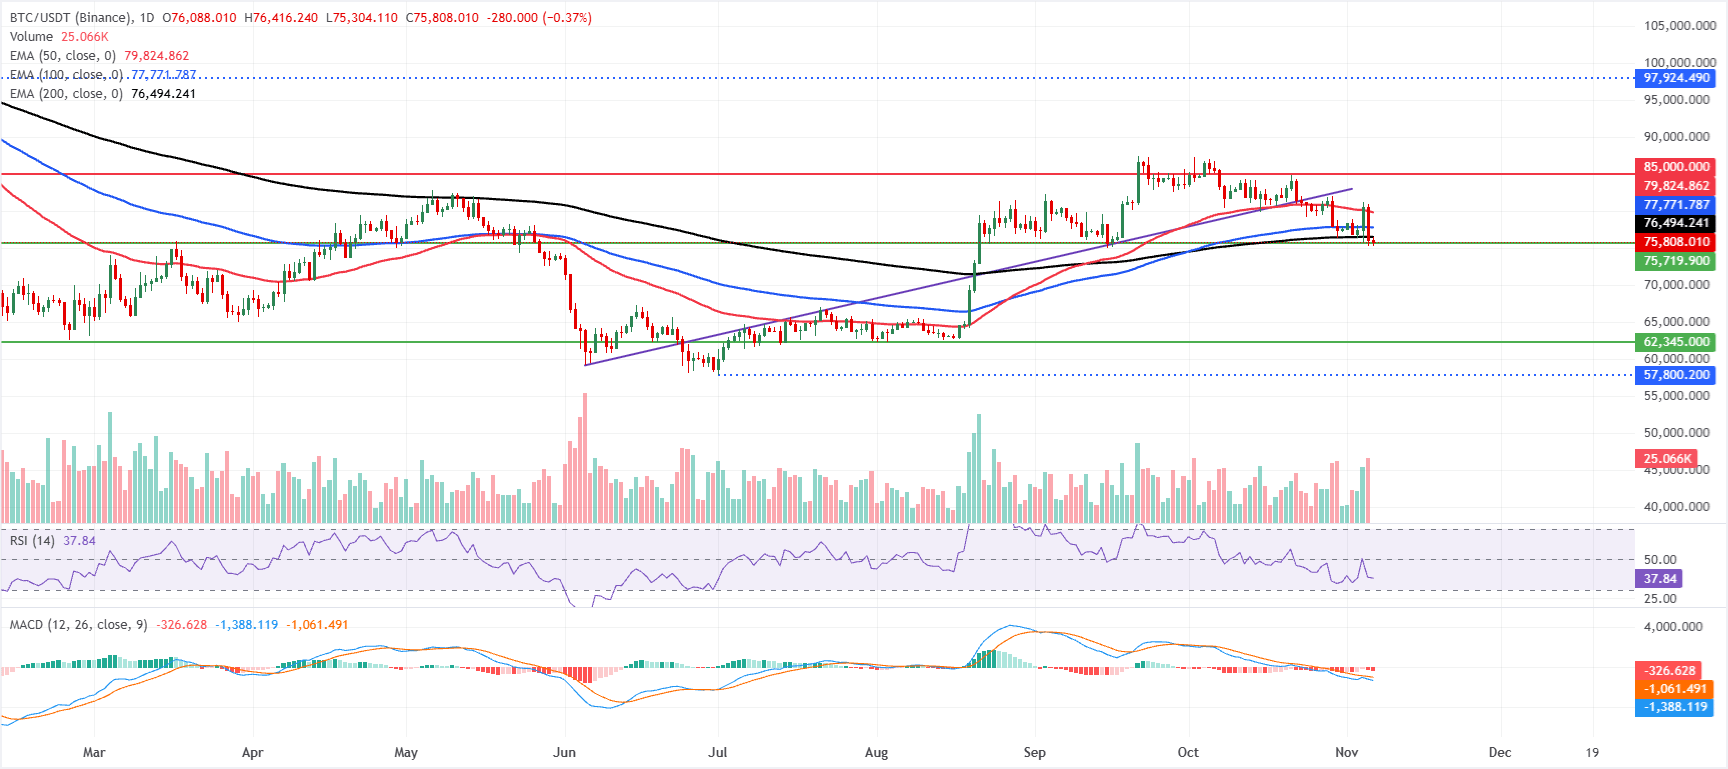
On the daily chart, BTC maintains a bearish near-term bias as it holds below key Exponential Moving Averages (EMAs). The 200-day EMA at $76,494 is the first overhead cap, followed by the 100-day EMA near $77,771 and the 50-day EMA around $79,824, suggesting rallies are likely to meet supply as the pair trades under this stacked resistance layer.
The daily RSI sits around 38, pointing to weak but not extreme downside momentum, while the MACD remains negative, suggesting bearish pressure remains dominant despite recent attempts to stabilize.
On the topside, immediate resistance is located at the 200-day EMA at $76,494; a daily close above this level would be the first sign of easing downside pressure. Further up, the 100-day EMA at $77,771 and the 50-day EMA at $79,824 form successive barriers ahead of the more distant horizontal resistance at $85,000, where sellers are likely to reassert control if the recovery extends.
With no clear nearby support levels from the shown indicators, price action remains vulnerable to additional downside while it trades beneath this dense EMA cluster.
(The technical analysis of this story was written with the help of an AI tool. Know more.)
Bitcoin, altcoins, stablecoins FAQs
Bitcoin is the largest cryptocurrency by market capitalization, a virtual currency designed to serve as money. This form of payment cannot be controlled by any one person, group, or entity, which eliminates the need for third-party participation during financial transactions.
Altcoins are any cryptocurrency apart from Bitcoin, but some also regard Ethereum as a non-altcoin because it is from these two cryptocurrencies that forking happens. If this is true, then Litecoin is the first altcoin, forked from the Bitcoin protocol and, therefore, an “improved” version of it.
Stablecoins are cryptocurrencies designed to have a stable price, with their value backed by a reserve of the asset it represents. To achieve this, the value of any one stablecoin is pegged to a commodity or financial instrument, such as the US Dollar (USD), with its supply regulated by an algorithm or demand. The main goal of stablecoins is to provide an on/off-ramp for investors willing to trade and invest in cryptocurrencies. Stablecoins also allow investors to store value since cryptocurrencies, in general, are subject to volatility.
Bitcoin dominance is the ratio of Bitcoin's market capitalization to the total market capitalization of all cryptocurrencies combined. It provides a clear picture of Bitcoin’s interest among investors. A high BTC dominance typically happens before and during a bull run, in which investors resort to investing in relatively stable and high market capitalization cryptocurrency like Bitcoin. A drop in BTC dominance usually means that investors are moving their capital and/or profits to altcoins in a quest for higher returns, which usually triggers an explosion of altcoin rallies.
Nothing in this material constitutes investment advice, personal recommendation, investment research, an offer, or a solicitation to buy or sell any financial instrument. The content has been prepared without consideration of your individual investment objectives, financial situation, or needs, and should not be treated as such.
Past performance is not a reliable indicator of future performance and/or results. Forward-looking scenarios or forecasts are not a guarantee of future performance. Actual results may differ materially from those anticipated.
Mitrade makes no representation or warranty as to the accuracy or completeness of the information provided and accepts no liability for any loss arising from reliance on such information.
Recommended Articles


