



Indian Rupee extends advance on weak US Dollar, lower oil prices
- The Indian Rupee rallies further against the US Dollar due to multiple tailwinds.
- Weak US Dollar and lower oil prices have improved the appeal of riskier currencies.
- US Republicans face a setback in midterm elections.
The Indian Rupee (INR) extends its winning streak against the US Dollar (USD) for the sixth trading day on Thursday. The USD/INR pair falls to a two-month low of 94.32 as the US Dollar faces significant selling pressure and oil prices have fallen significantly, following the setback of United States (US) Republicans in midterm elections.
As of writing, the US Dollar Index (DXY), which gauges the Greenback’s value against six major currencies, is down 0.25% to near 101.25. The USD Index is close to its monthly low of 101.10 posted the previous day.
Meanwhile, the MCX Crude Oil contract expiring on November 19 is down 1.7% to near Rs. 8,222. The oil price is down almost 17.50% in the last few days from its recent highs of Rs. 9,972.
Lower oil prices bode well for currencies from economies, such as India, which rely heavily on oil imports to meet their energy needs.
The US Dollar faces intense selling pressure amid expectations that Democrats taking control of both the Senate and the House of Representatives would likely “lead to gridlock on the debt ceiling, a prolonged government shutdown next year”, ING said. The bank further warned that “fears of tougher regulation could weigh on Artificial Intelligence (AI) stocks (we’ve recently seen how that can hit the greenback)”.
Dollar outlook darkens on US political friction heading into 2027
Analysts at ING suggest that the US political backdrop could become an additional headwind for the Dollar over the medium term. They argue that “the dollar could see a little more weakness into 2027, however, if an emboldened Democratic Party takes greater issue with Republican policy, including deregulation and the AI build-out.” ING adds that “the potential for a prolonged government shutdown in mid-2027 adds to the case for a weaker dollar next summer,” reinforcing their view that rising political friction may increasingly weigh on the currency’s appeal.
Republicans’ defeat eases risks of further escalation in Iran war
The victory of US Democrats in the midterm elections has eased fears of further escalation in conflict between the US and Iran, resulting in a sharp decline in oil prices.
Meanwhile, crude shipments through the Strait of Hormuz — a critical chokepoint to almost 20% of global energy supply — have recovered to close to pre-war levels, according to analysts, though at a higher cost, Reuters reported.
“The resumption of Gulf supply has pushed the global oil market back into surplus after months of disruption caused by the war,” JP Morgan said.
USD/INR Technical Analysis
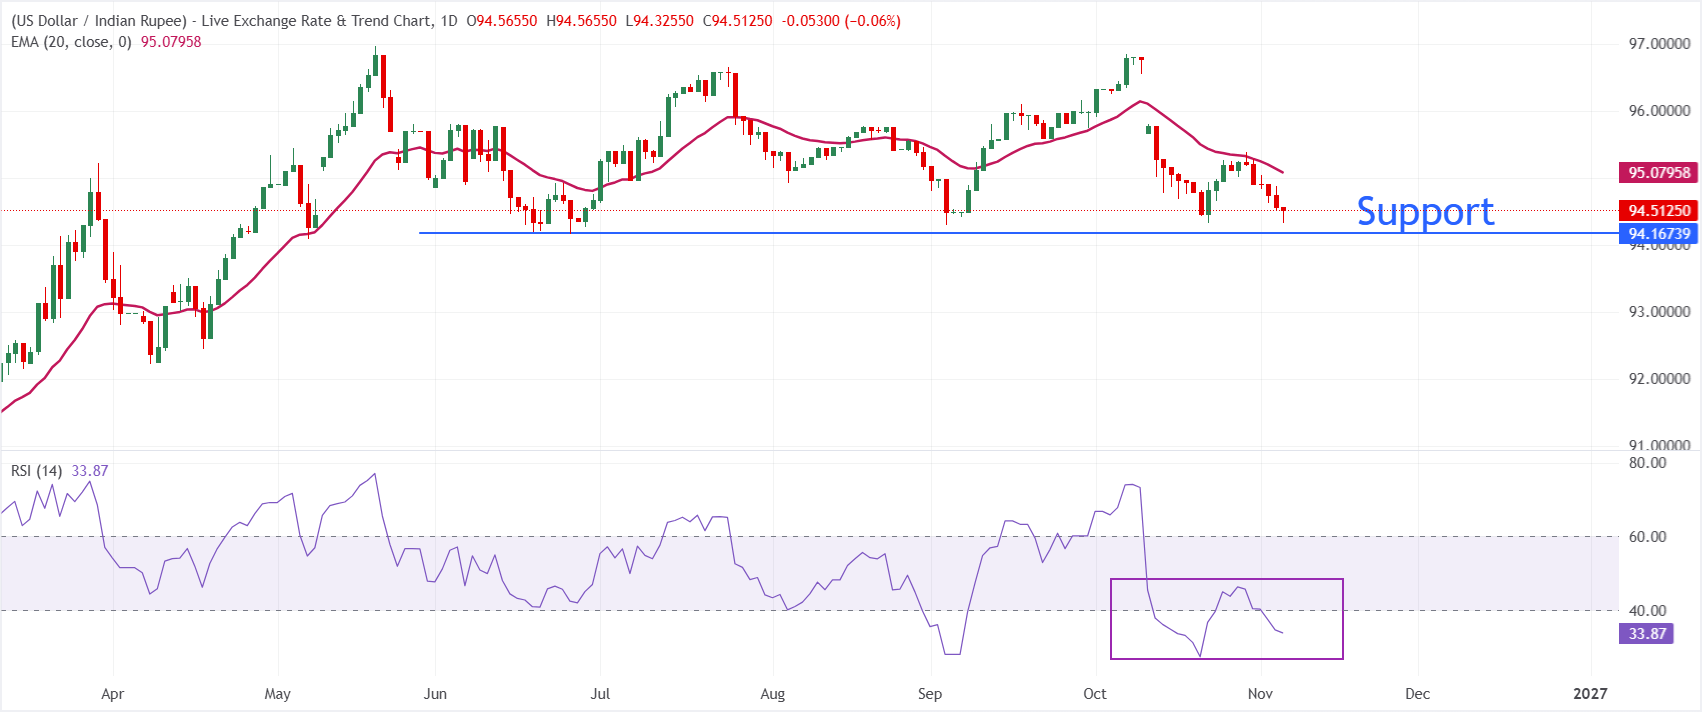
On Thursday, USD/INR falls to 94.32, maintaining a bearish near-term tone as spot remains capped beneath the 20-period Exponential Moving Average (EMA) at 95.08. The pair continues to hold below this dynamic barrier, while the Relative Strength Index (RSI) at 33.9 hovers just above oversold territory, hinting that downside pressure persists but is becoming stretched.
On the topside, initial resistance is located at the 20-day EMA near 95.08, which would need to be reclaimed to ease the current bearish pressure and open the door to a corrective bounce. Looking down, the June 25 low at 94.16 is the key support level.
(The technical analysis of this story was written with the help of an AI tool. Know more.)
Indian Rupee FAQs
The Indian Rupee (INR) is one of the most sensitive currencies to external factors. The price of Crude Oil (the country is highly dependent on imported Oil), the value of the US Dollar – most trade is conducted in USD – and the level of foreign investment, are all influential. Direct intervention by the Reserve Bank of India (RBI) in FX markets to keep the exchange rate stable, as well as the level of interest rates set by the RBI, are further major influencing factors on the Rupee.
The Reserve Bank of India (RBI) actively intervenes in forex markets to maintain a stable exchange rate, to help facilitate trade. In addition, the RBI tries to maintain the inflation rate at its 4% target by adjusting interest rates. Higher interest rates usually strengthen the Rupee. This is due to the role of the ‘carry trade’ in which investors borrow in countries with lower interest rates so as to place their money in countries’ offering relatively higher interest rates and profit from the difference.
Macroeconomic factors that influence the value of the Rupee include inflation, interest rates, the economic growth rate (GDP), the balance of trade, and inflows from foreign investment. A higher growth rate can lead to more overseas investment, pushing up demand for the Rupee. A less negative balance of trade will eventually lead to a stronger Rupee. Higher interest rates, especially real rates (interest rates less inflation) are also positive for the Rupee. A risk-on environment can lead to greater inflows of Foreign Direct and Indirect Investment (FDI and FII), which also benefit the Rupee.
Higher inflation, particularly, if it is comparatively higher than India’s peers, is generally negative for the currency as it reflects devaluation through oversupply. Inflation also increases the cost of exports, leading to more Rupees being sold to purchase foreign imports, which is Rupee-negative. At the same time, higher inflation usually leads to the Reserve Bank of India (RBI) raising interest rates and this can be positive for the Rupee, due to increased demand from international investors. The opposite effect is true of lower inflation.
Nothing in this material constitutes investment advice, personal recommendation, investment research, an offer, or a solicitation to buy or sell any financial instrument. The content has been prepared without consideration of your individual investment objectives, financial situation, or needs, and should not be treated as such.
Past performance is not a reliable indicator of future performance and/or results. Forward-looking scenarios or forecasts are not a guarantee of future performance. Actual results may differ materially from those anticipated.
Mitrade makes no representation or warranty as to the accuracy or completeness of the information provided and accepts no liability for any loss arising from reliance on such information.
Recommended Articles


