



Alphabet Stock Forecast: GOOGL Breaks Triangle Support as Capex and Cloud Face the October 28 Test
TradingKey - Alphabet (NASDAQ: GOOGL) heads into next week’s earnings after falling 3.15% to $324.22 on Thursday, October 22, as the AI spending selloff hit Big Tech. The stock is about 21% below its 52-week high of $408.61 and close to the $317.69 level where it ended after its July earnings drop.
Alphabet reports third-quarter results after the close next Wednesday, October 28, with the call at 4:30 p.m. ET. The Federal Reserve announces its rate decision at 2:00 p.m. ET that day, and Microsoft reports after the close too.
What the Street Expects
Analysts expect revenue of about $127.4 billion to $127.8 billion, up roughly 25% from $102.35 billion a year earlier, and EPS of about $2.94 to $3.04, versus $2.87. Alphabet does not give quarterly guidance, so consensus is the benchmark. Investing.com said EPS estimates slipped about 2% in the 30 days to October 16, while revenue estimates rose 3% over 90 days.
Q2 Showed Strong Growth and Heavy Spending
In July, revenue rose 24% to $119.8 billion. Google Cloud revenue jumped 82% to $24.8 billion, and its operating income, the profit from running that business, rose to $8.8 billion from $2.8 billion. Search and other revenue grew 17%, YouTube ads 13%, and the operating margin widened two points to 34%.
Capex, the money spent on data centers and equipment, reached $44.9 billion, more than the $39.1 billion of operating cash flow. That left free cash flow, the cash left after operating costs and capital spending, at negative $5.9 billion, the first negative reading in Alphabet's public history according to Motley Fool. Alphabet also raised 2026 capex guidance to $195 billion to $205 billion from $180 billion to $190 billion. Even with Cloud up 82%, the stock fell 7.13% to $317.69 the next day.
Reported EPS Can Swing on Investment Gains
Q2 diluted EPS of $9.11 included a $99.0 billion gain on equity securities, mostly unrealized, meaning paper gains on holdings Alphabet has not sold. Adjusted EPS was about $2.85, just under the $2.89 estimate. Similar gains or losses could distort GAAP earnings again in Q3, so operating income is the cleaner measure.
Cloud Backlog Is the Key Number
Google Cloud backlog, contracted revenue not yet recognized, reached $514 billion at the end of Q2. Alphabet also began recognizing revenue from TPU systems, its in-house AI chips, placed in customers' own data centers. Cloud growth near 80% would show that the spending is turning into sales.
Funding the Buildout
In June, Alphabet announced about $80 billion of equity offerings. That included $30 billion of public offerings, a $10 billion private placement with Berkshire Hathaway and a $40 billion at-the-market program, which sells shares gradually on the open market. Alphabet said about $30 billion of the at-the-market proceeds would cover tax payments on employee stock vesting this year. CFO Anat Ashkenazi said no further equity offerings were planned. Long-term debt reached $98.2 billion at June 30, up from $46.5 billion at the end of 2025.
Like Microsoft, Alphabet rents cloud capacity to outside customers, which spreads the cost of its data centers. Even so, after Meta revived worries about who pays for AI, Alphabet's free cash flow will draw as much attention as its EPS.
Valuation and Analysts
The stock trades at about 24 times forward earnings. StockAnalysis shows a Strong Buy consensus from 62 analysts and an average target of $430.51, about 33% above Thursday's close.
Alphabet Technical Analysis: Daily Close Below $315.29 Could Open $297.45
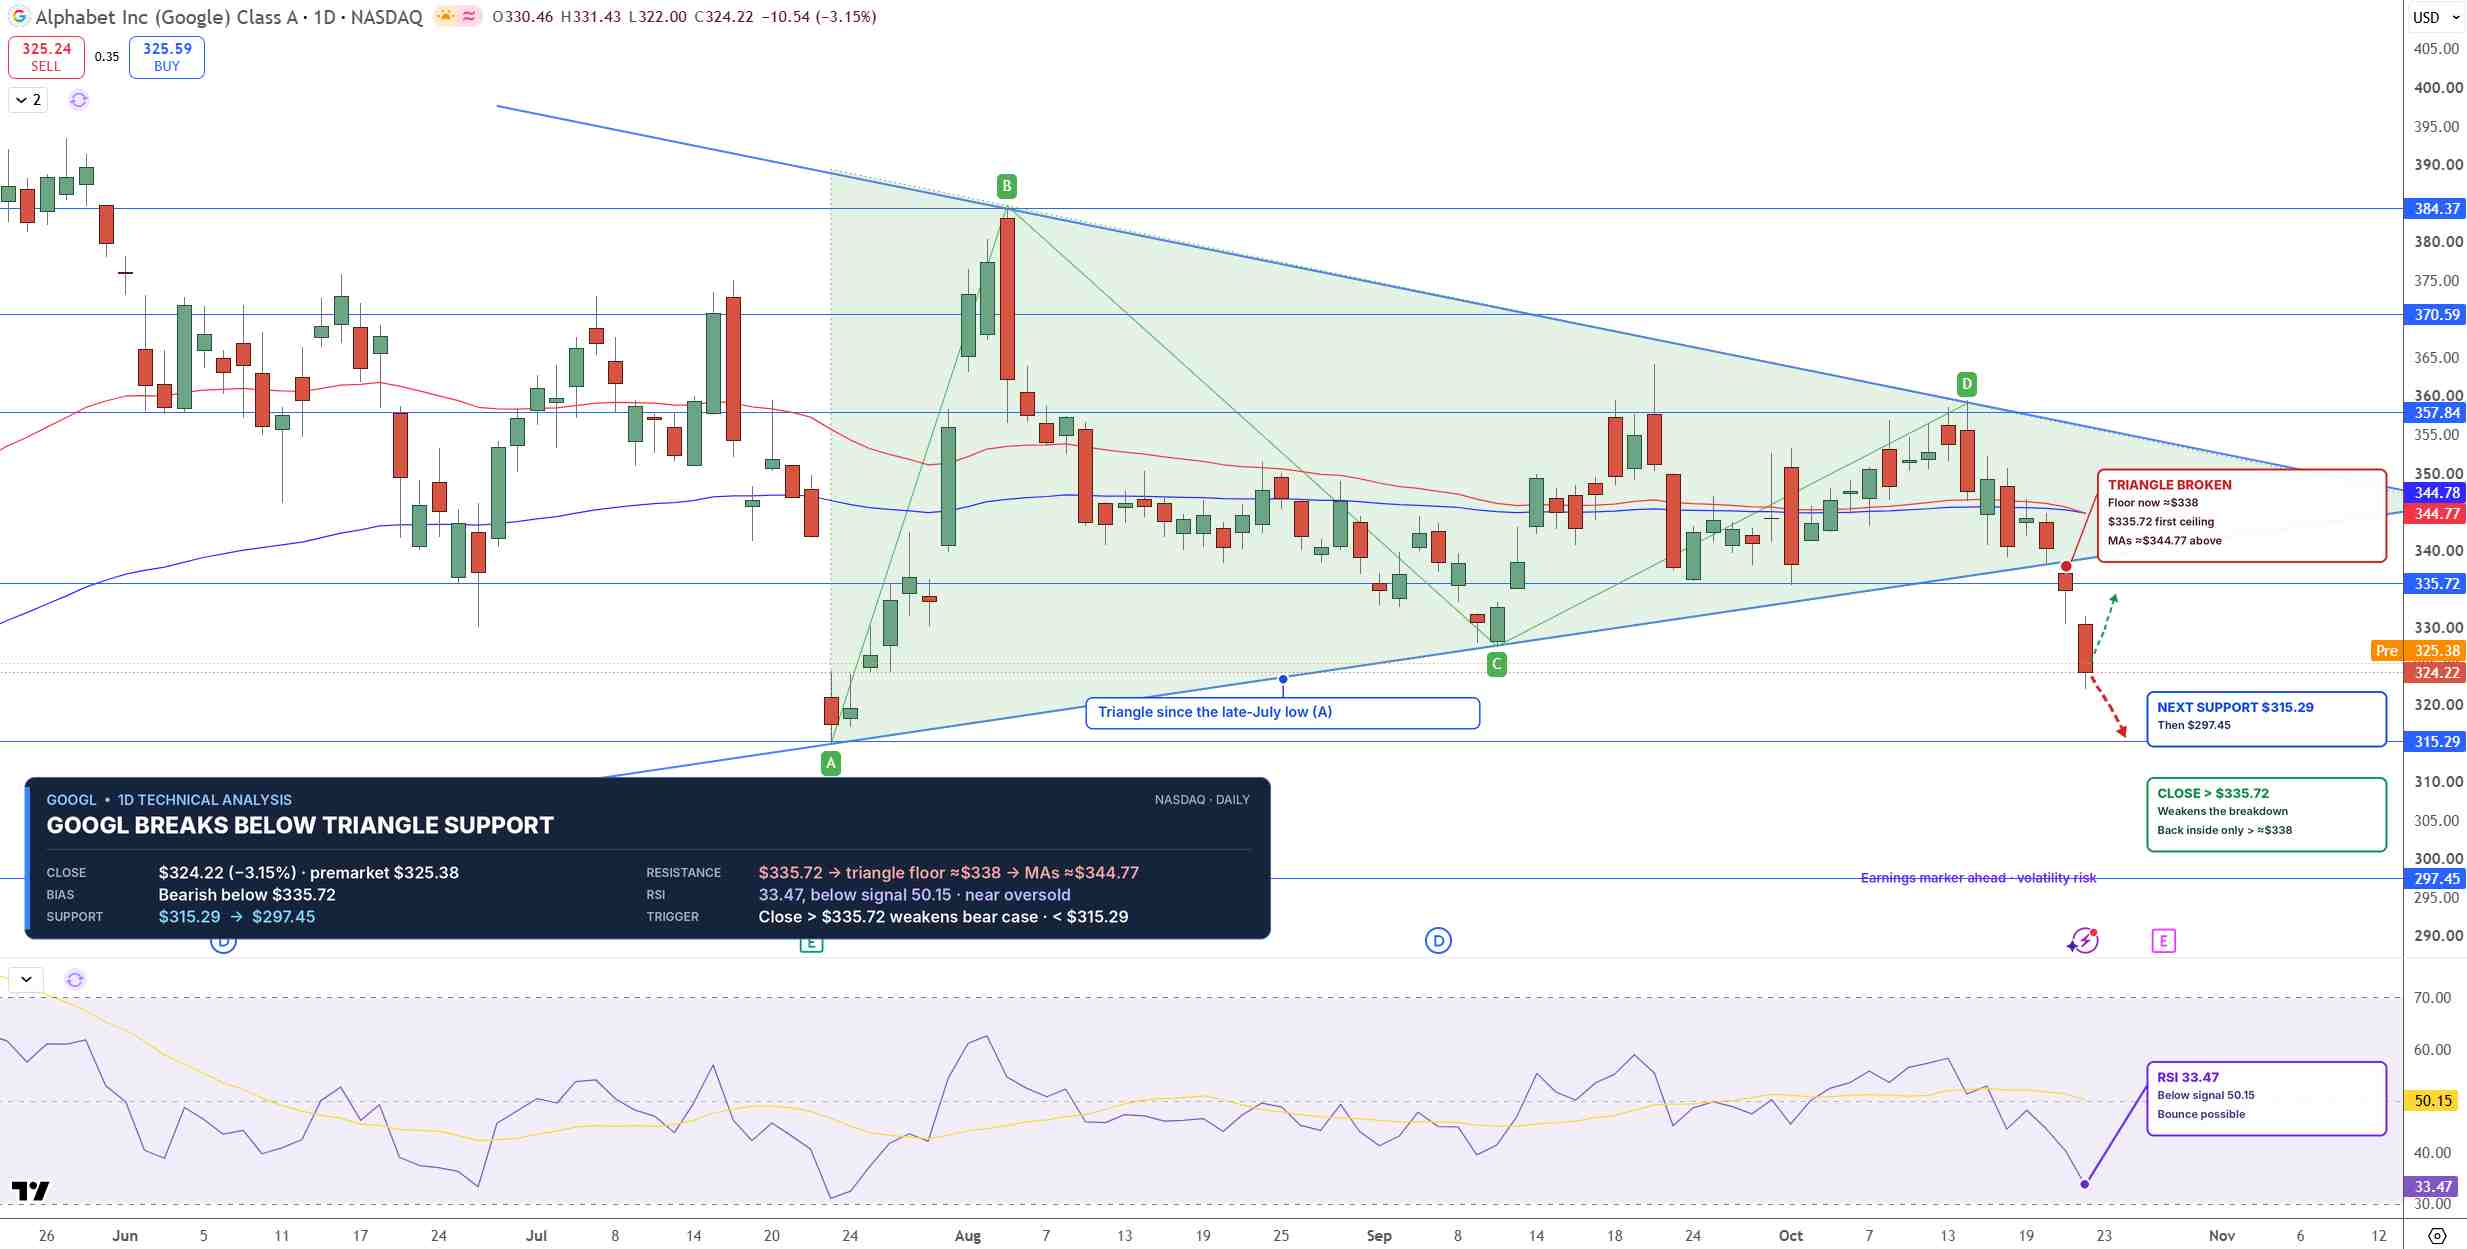
Worries about that spending show up on the daily chart, where GOOGL broke down out of a triangle that had held price since July. A triangle forms when highs and lows narrow toward a point, and a break usually decides the next move. Price fell below the lower trendline, the line under the rising lows, and $335.72 support, and it now trades below both moving averages, which sit almost together near $344.77. Moving averages track the average price over a set period, and trading below both is a sign that sellers have the edge.
RSI, a momentum gauge that runs from 0 to 100, has dropped to about 33. Momentum is weak and nearing 30, the usual oversold line, so a short bounce is possible.
GOOGL Price Chart - Source: Tradingview
Buyers need a daily close back above $335.72 to cancel the breakdown, which would open $344.78. On the downside, $315.29 is the next support, a level where buying has stopped declines before, and it sits just below the $317.69 post-earnings close from July. A close below it would open $297.45.
I lean bearish while GOOGL stays below $335.72.
Key Levels
- Last close: $324.22, down 3.15% on October 22
- Support: $315.29, $297.45
- Resistance: $335.72, $344.77 to $344.78
- RSI: 33.47, below the 50 midline
- Bullish trigger: Daily close above $335.72
- Bearish trigger: Daily close below $315.29
FAQs
When does Alphabet report Q3 2026 earnings?
Alphabet reports after the close on Wednesday, October 28, 2026, with the call at 4:30 p.m. ET. Analysts expect revenue of about $127.4 billion to $127.8 billion and EPS of about $2.94 to $3.04.
What is the Alphabet stock forecast before earnings?
The bias is bearish below $335.72. A daily close below $315.29 targets $297.45, while a close above $335.72 would cancel the triangle breakdown and open $344.78.
Bottom Line
Alphabet's Cloud business is growing fast, but negative free cash flow and an $80 billion equity raise mean the October 28 capex number matters more than EPS. The level that matters is $315.29, just under July's post-earnings close. In my view, a daily close below it opens $297.45, and only a close back above $335.72 would cancel the breakdown.
Nothing in this material constitutes investment advice, personal recommendation, investment research, an offer, or a solicitation to buy or sell any financial instrument. The content has been prepared without consideration of your individual investment objectives, financial situation, or needs, and should not be treated as such.
Past performance is not a reliable indicator of future performance and/or results. Forward-looking scenarios or forecasts are not a guarantee of future performance. Actual results may differ materially from those anticipated.
Mitrade makes no representation or warranty as to the accuracy or completeness of the information provided and accepts no liability for any loss arising from reliance on such information.
Recommended Articles


